
Paper Recycling Company Financial Model Template
Starting or expanding a paper recycling business? This Paper Recycling Company Financial Model Template is a fully integrated, 10-year Excel model for waste paper collection, sorting and baling operations. It is built for entrepreneurs, investors, lenders and consultants who need a credible, bank-ready business plan. It forecasts monthly for the first five years with annual totals, then annually to Year 10. Volumes, paper prices, collection fees, operating costs, CAPEX, payroll, debt, tax and grants all link into a three-statement financial forecast that balances every period.
Financial Model for a Paper Recycling Company
The model follows the real flow of a paper recycling plant: waste paper collected → graded → baled → sold to paper mills. Baling line capacity, shifts, downtime, ramp-up, seasonality and growth drive intake across 10 paper grades. These include OCC/cardboard, mixed paper, newspapers and magazines, sorted office paper, confidential shredding paper, kraft and cartons. Intake comes from six supply channels, including commercial collections, municipal kerbside contracts, retail back-haul and confidential shredding clients. Fibre composition and recovery rates then calculate baled output by grade, plastic and metal by-products, rejects and landfill diversion.
Revenue combines baled paper sales, commercial collection fees, confidential shredding fees, municipal contracts, baler rental, EPR and packaging recovery note (PRN) income. Mill quality claims, broker commissions and feedstock rebates paid to suppliers are all modelled. The model calculates EBITDA, CFADS, DSCR, LLCR, project and equity IRR, NPV, MIRR, payback and break-even tonnage. One start date controls every date in the workbook, and a single selector switches between Base, Upside and Downside scenarios.
What’s Inside the Model – Tab by Tab
01. Dashboard
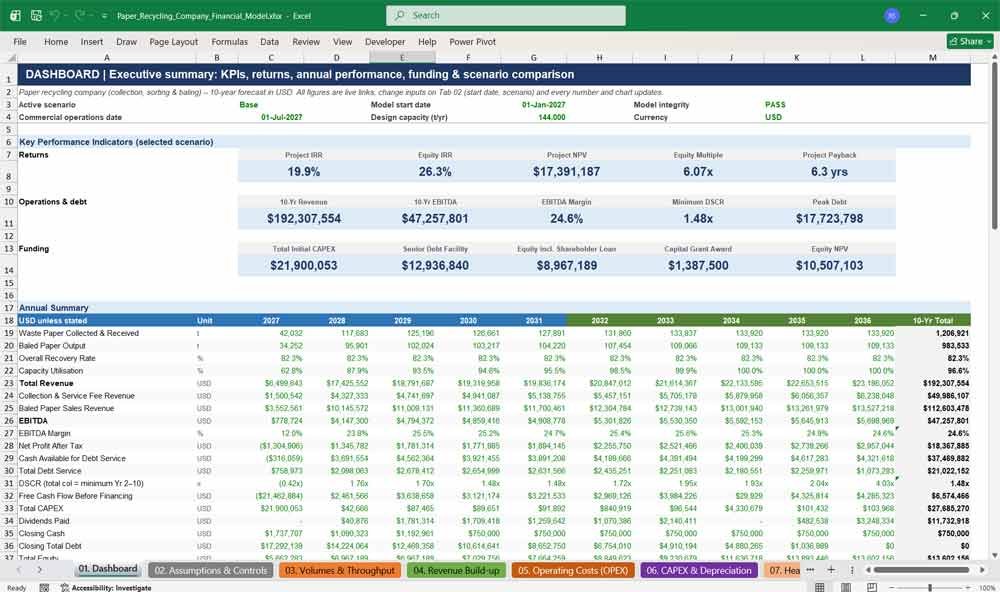
The executive dashboard presents the paper recycling company’s performance on one page. Returns, revenue, EBITDA, cash flow, debt and tonnage are summarised with six charts and a Base, Upside and Downside scenario comparison, ready for investors, lenders and board presentations.
- KPI tiles: Project IRR, Equity IRR, NPV, equity multiple and payback period
- 10-year summary of tonnes collected, baled output, revenue, EBITDA, NPAT, CFADS, DSCR, cash and debt
- Charts: revenue & EBITDA, CFADS vs debt service with DSCR, debt vs cash, scenario IRRs, revenue mix, tonnage
- Funding summary: total CAPEX, senior debt, equity and grant award
- Live model integrity status (PASS / REVIEW)
02. Assumptions & Controls
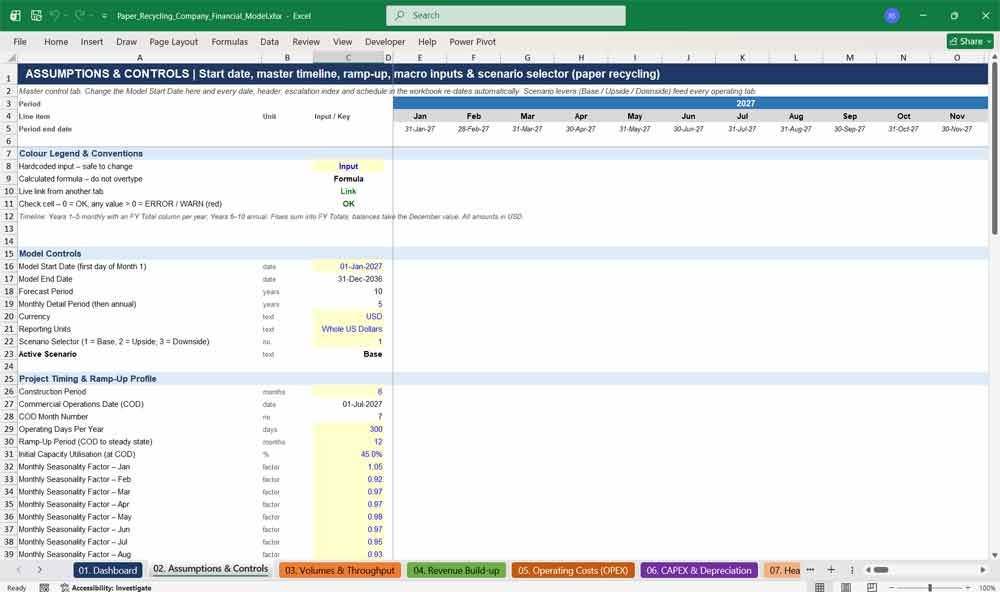
The control centre of the paper recycling business plan. Set the start date, construction period, ramp-up, operating days, inflation, tax and discount rates, and the paper-specific seasonality profile, then select Base, Upside or Downside. Every tab re-dates automatically from one input.
- Single start date drives every header, schedule and escalation index
- Eight scenario levers: utilisation, growth, collection fees, paper prices, recovery, OPEX, CAPEX, interest rate
- Seasonality reflecting Christmas retail cardboard peaks
- Master timeline with construction, operations and distribution flags
- Clear colour-coded legend for inputs, formulas and links
Paper Recycling Company Operating Costs
04. Revenue Build-up
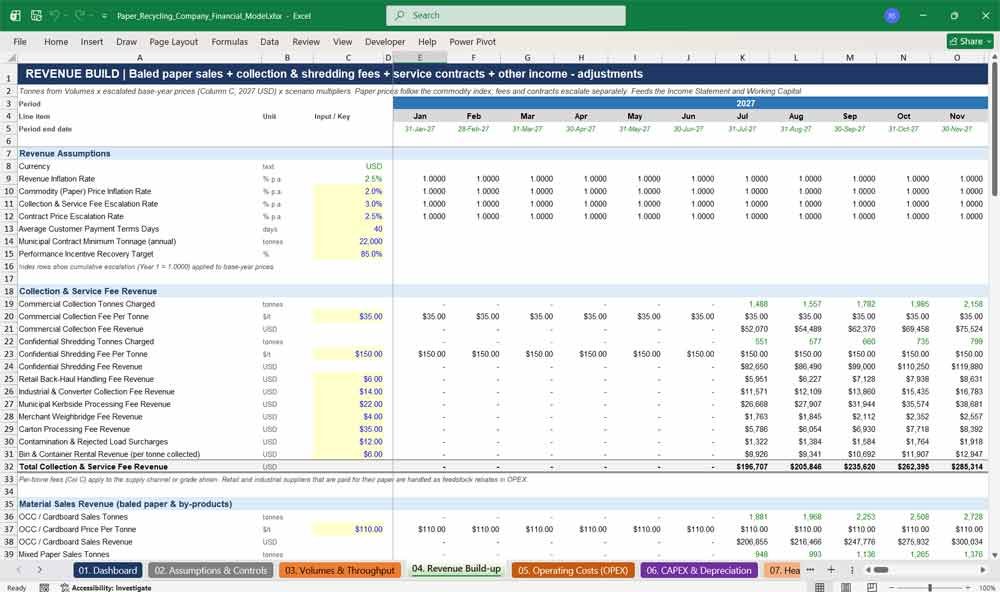
A detailed paper recycling revenue model combining baled paper sales by grade with collection and service fees, contracts and compliance income. Paper prices follow a commodity index, while fees and contracts escalate separately, net of mill claims, commissions and bad debt.
- Baled paper sales by grade: OCC, mixed paper, ONP/OMG, office paper, shredded paper, kraft, cartons
- Commercial collection fees and confidential shredding fees per tonne
- Municipal kerbside contracts, put-or-pay minimum volumes and baler & compactor rental
- EPR, PRN, certificates of destruction, SRF and carbon credit income
- Mill quality & moisture claims, broker commissions and revenue reconciliation checks
05. Operating Costs (OPEX)
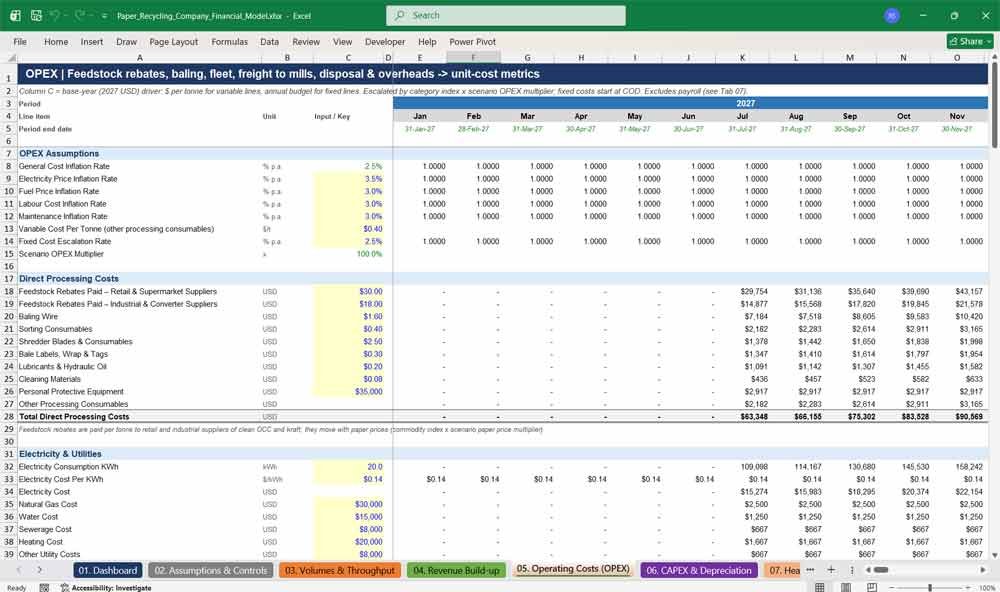
A complete paper recycling operating cost model with over 100 cost lines. Variable costs are driven per tonne and fixed costs by annual budget. Each line escalates by its own index, and supplier feedstock rebates move with paper prices.
- Feedstock rebates paid to retail and industrial paper suppliers
- Baling wire, shredder blades, sorting consumables and electricity per tonne
- Collection fleet fuel, bale haulage to paper mills and export shipping costs
- Reject disposal, landfill tax and SRF gate fees
- Maintenance, fire insurance, compliance, admin and cost-per-tonne metrics
06. CAPEX & Depreciation
The full capital budget for a paper recycling facility, from land, yard and bale storage to balers, shredders and collection fleet. Spend follows the construction profile, with contingency, capitalised interest, asset register, depreciation, replacements and disposals.
- Over 80 CAPEX lines across land, buildings, processing equipment, vehicles, technology and development
- Automatic channel baler, two-ram baler, optical grade sorter, disc screens and industrial shredders
- Collection vehicles, mobile shredding truck, bale-clamp forklifts and customer bins
- Asset register with useful lives and residual values by class
- Fleet replacement, technology refresh, sustaining CAPEX and disposal gains or losses
07. Headcount & Payroll
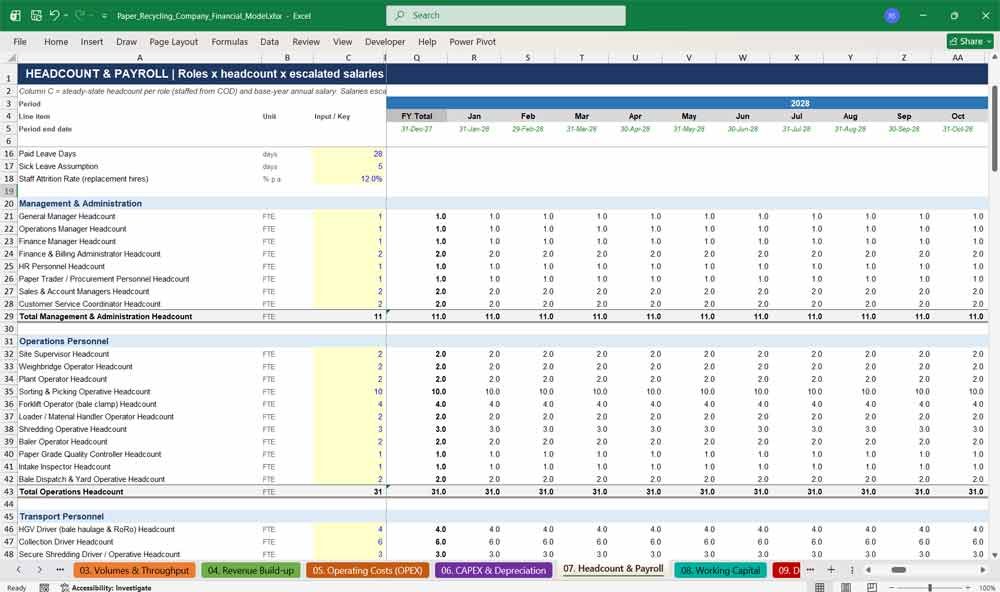
A role-by-role staffing plan with 33 paper recycling job roles across management, operations, transport, maintenance and compliance. Headcount, escalated salaries, shift allowances, overtime, bonuses and employer on-costs build total payroll by department.
- Roles include paper trader, baler operators, grade quality controller and secure shredding drivers
- Headcount summary with hires, attrition and FTE
- Employer National Insurance, pension, benefits, healthcare and payroll taxes
- Agency cover calculated from paid leave and sickness
- Payroll cost per tonne and allocation by department
Paper Recycling Company Financial Statements Balance Sheet
08. Working Capital
Models working capital for a paper recycling company using debtor, creditor, inventory, prepayment and accrual days. Baled paper stock, customer credit, VAT timing and supplier terms produce the net working capital movement feeding the cash flow statement.
- Trade receivables by revenue stream with credit sales percentages
- Baled paper inventory, consumables and spare parts
- VAT receivable and payable with a settlement lag
- Trade payables, payroll accruals and deferred contract income
- Debtor days, creditor days and cash conversion cycle
09. Debt & Financing
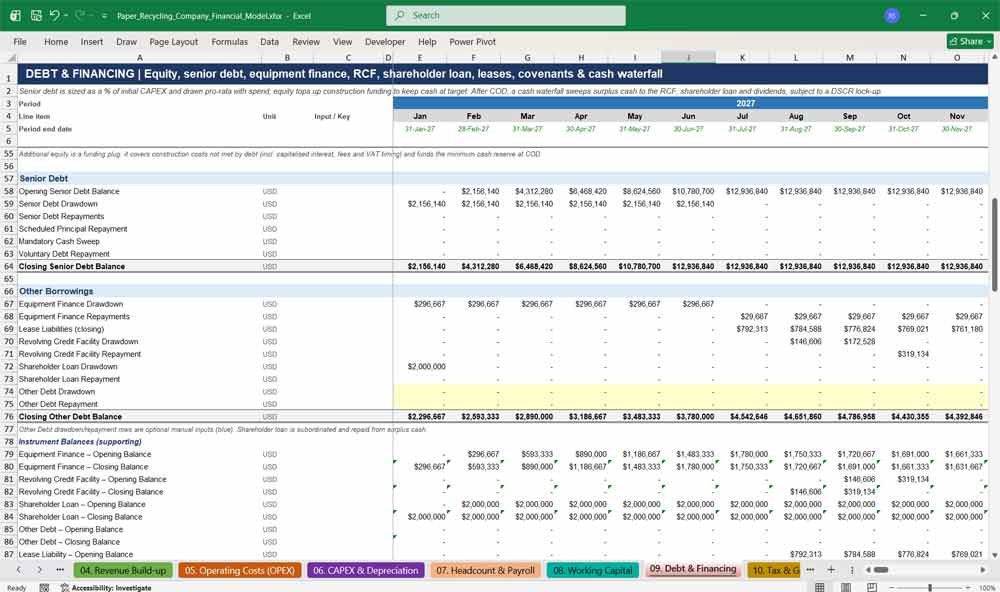
A project finance debt schedule with senior debt, equipment finance, revolving credit facility, shareholder loan and IFRS 16 leases. A cash waterfall applies minimum cash, a DSCR lock-up, cash sweep, shareholder loan repayment and dividends, with covenant testing.
- Senior debt sized on CAPEX with grace period and straight-line or annuity repayment
- Capitalised construction interest, arrangement, commitment and undrawn fees
- DSCR, LLCR, interest cover and net debt to EBITDA with breach flags
- Dividends limited to distributable reserves
- Sources and uses, peak debt and funding summary
10. Tax & Grants
Calculates corporation tax, tax losses and capital allowances for the paper recycling business, plus capital and operating grants. It includes an Annual Investment Allowance, capital allowance pools, an interest restriction, a tax payment lag and deferred tax, with every rate editable.
- Taxable profit reconciliation with interest deductibility cap
- Tax losses carried forward with an offset cap
- AIA, main pool and special rate pool writing down allowances
- Deferred tax and cash tax payments
- Circular economy capital grant and operating grant schedules
11. Income Statement
A fully linked monthly and annual profit and loss statement for the paper recycling company. It flows from revenue through gross profit, EBITDA and EBIT to net profit after tax, with margins, EBITDA per tonne and growth rates.
- Paper sales shown net of mill quality claims and broker commissions
- Direct costs and gross profit margin
- EBITDA, EBITDA margin and EBITDA per tonne
- Depreciation, amortisation, interest and non-operating items
- Revenue and EBITDA growth and earnings per share
12. Cash Flow Statement
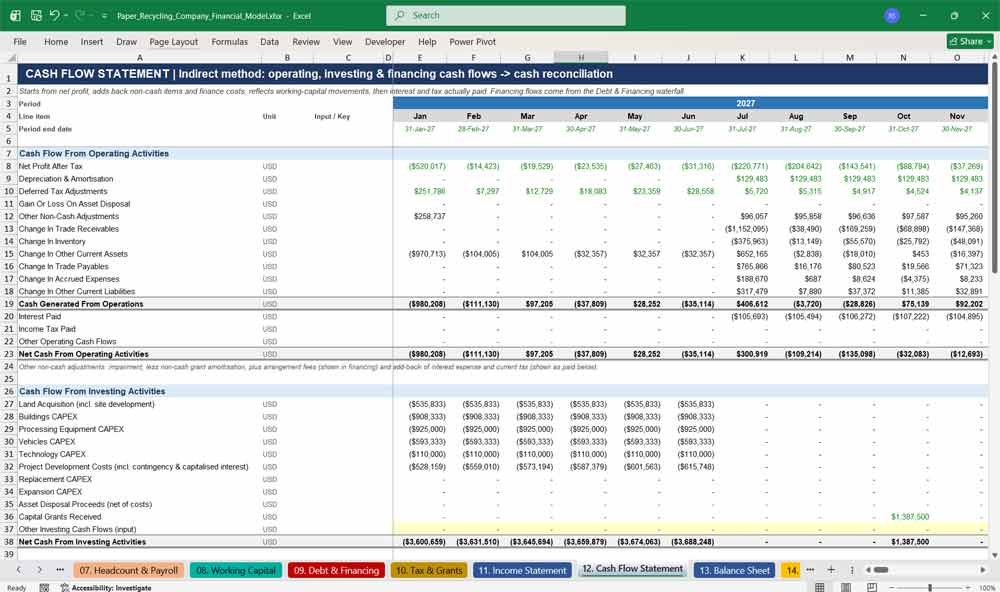
An indirect cash flow statement covering operating, investing and financing activities. It reconciles net profit to cash, shows CAPEX, grants and financing flows, and calculates CFADS, free cash flow and months of cash cover.
- Cash generated from operations with working capital movements
- Investing cash flows by asset class, grants and disposals
- Equity, debt drawdowns, repayments and dividends
- Cash reconciliation against the minimum cash balance
- CFADS, DSCR and free cash flow before and after debt service
13. Balance Sheet
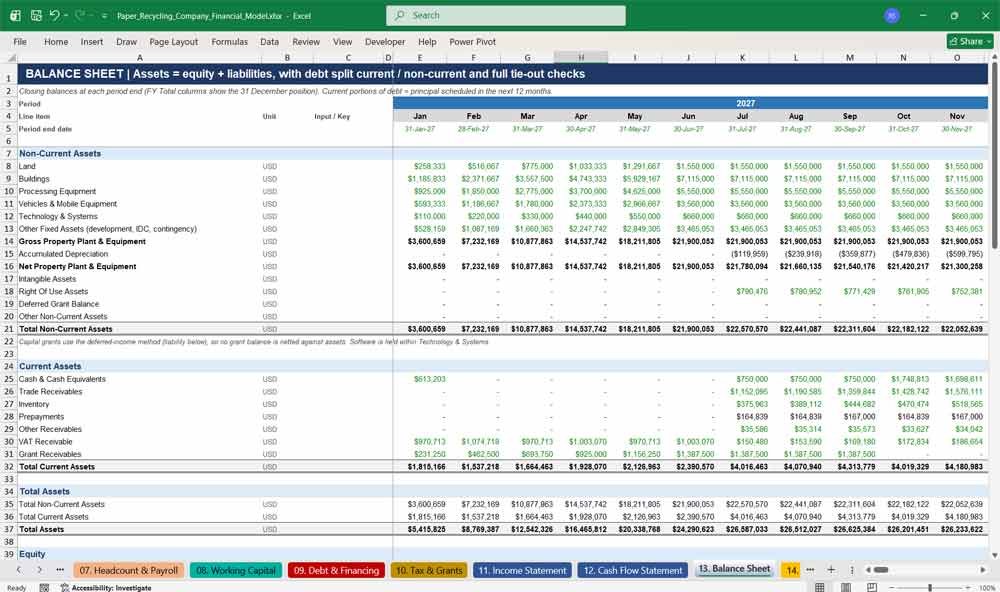
A balance sheet that balances in every period, covering assets, equity and liabilities. Debt is split between current and non-current portions from actual repayment schedules, and tie-out checks confirm cash, retained earnings, fixed assets and debt reconcile.
- Fixed assets by class, right-of-use assets, inventory and cash
- Share capital, share premium and retained earnings
- Senior debt, equipment finance, leases and shareholder loans
- Deferred tax, deferred capital grants and tax payables
- Balance sheet difference check plus four reconciliation checks
Key Assumptions and Drivers for Paper Recycling
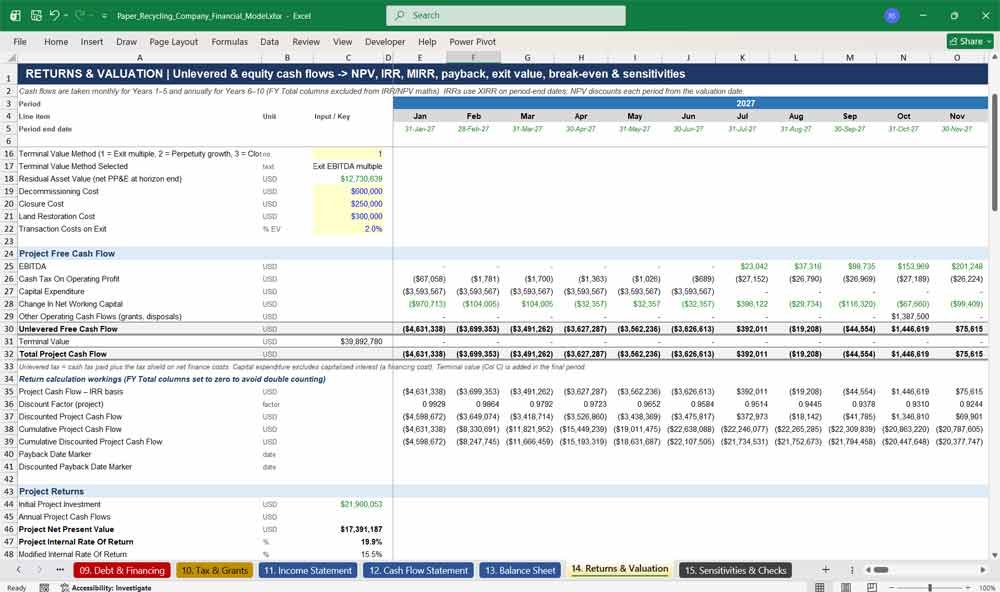
14. Returns & Valuation
Investment appraisal for a paper recycling company. Unlevered and equity cash flows produce NPV, IRR, MIRR, payback and profitability index. The tab includes three terminal value methods, exit valuation, break-even analysis and live sensitivities.
- Project and equity IRR using XIRR on period-end dates
- Terminal value: exit EBITDA multiple, perpetuity growth or closure value
- Enterprise value, net debt and equity exit proceeds
- Break-even tonnage, collection fee, paper price and recovery rate
- 11 sensitivities including paper prices, throughput, CAPEX overrun and interest rate
15. Sensitivities & Checks
The model integrity and scenario analysis tab. All 23 checks roll up to a single PASS/REVIEW flag, alongside the scenario comparison, a paper price vs throughput IRR grid, break-even tonnage, and capacity and cash warnings.
- 23 model checks, including mass balance, balance sheet, cash flow and IRR checks
- Base, Upside and Downside comparison with a live selected-scenario column
- 5 × 5 Project IRR grid: paper prices vs throughput
- Break-even throughput and headroom by year
- Warnings for capacity, minimum cash, RCF use, covenant headroom and dividend lock-up
Why Buy This Model
Paper recycling margins depend on volatile mill prices, collection density, supplier rebates and freight costs. Getting the numbers right before you invest is essential. This Paper Recycling Company Financial Model gives you a professional, fully formula-driven framework built specifically for a collection, sorting and baling business, so you don’t start from a blank spreadsheet. Every assumption is in a clearly marked input cell. There are no macros and no circular references. The model balances every period and checks itself with 23 integrity tests. It follows the layout and colour conventions lenders and investors expect. Replace the illustrative figures with your own tonnages, prices and quotes, and in hours you’ll have a bank-ready business plan with IRR, NPV, DSCR, break-even tonnage and scenario analysis. It suits raising finance, pitching investors, bidding for municipal paper contracts and testing paper price risk.
Paper Recycling Frequently Asked Questions
What type of paper recycling business is this model for?
It is designed for a waste paper collection, sorting and baling company. This type of business collects paper and cardboard from businesses, councils, retailers and shredding clients, grades and bales it, and sells the bales to paper mills or export markets. It is not a paper mill model.
Can I use it for a cardboard-only or OCC baling business?
Yes. Set the grade mix on Tab 03 to mostly OCC/cardboard and set unused grades or revenue lines to zero. All totals, checks and returns update automatically.
Does it include confidential shredding?
Yes. Confidential shredding clients are a separate supply channel, with their own per-tonne shredding fees, destruction contracts and certificate of destruction income. The model also covers shredder CAPEX, blade costs, a mobile shredding truck and secure shredding drivers.
How are paper prices handled, and can I test price falls?
Each grade has its own base price per tonne, escalated by a paper price index and a scenario multiplier. Feedstock rebates paid to suppliers move with paper prices too. Tab 14 tests price downside and upside cases, and Tab 15 shows a 5 × 5 IRR grid of paper prices against throughput.
Can I change the start date and construction period?
Yes. Change the start date on Tab 02 and every date, year heading, escalation index and debt schedule re-dates automatically. The construction period is a single input that moves the operations start date.
What currency is the model in?
The model is presented in USD, but every value is an input. You can enter figures in GBP, EUR or any currency and change the currency label – the calculations work the same way.
Which tax rules are used?
A UK-style corporation tax structure is included, with an Annual Investment Allowance, capital allowance pools, an interest restriction, losses carried forward and VAT. Rates and allowances are editable, so you can adapt it to other countries.
Do I need advanced Excel skills?
No. Inputs are blue text on yellow cells, and everything else calculates automatically. Most users only change the Assumptions & Controls tab and the input column on each tab.
Is it suitable for a bank loan or investor pitch?
Yes. It provides the outputs lenders and investors look for: CFADS, DSCR, LLCR, covenant testing, sources and uses, IRR, NPV, payback and a balanced three-statement forecast with integrity checks. You should still validate your assumptions with your own advisers.
Does it include collection vehicles and bins?
Yes. CAPEX covers rear-end loader collection vehicles, hook-lift and RoRo trucks, secure box vans, bale-clamp forklifts and customer bins, cages and containers. It also includes fleet replacement at end of life. Running costs cover fuel, vehicle maintenance, insurance and leasing.
Are there macros or circular references?
No. The model uses standard Excel formulas only, with no VBA and no circular references, so it is fast, transparent and safe to open in any recent version of Excel.
Can I add more paper grades, customers or equipment?
Yes. Each section has clear totals and “Other” lines ready for project-specific items, and new rows can be inserted within a section.
Are the figures real market data?
The figures are illustrative base-year assumptions that show how the model works and give a realistic example. Replace them with current mill prices, supplier rebates, contract terms and equipment quotes for your market.
Final Notes on the Financial Model
- Scenario Analysis: Create best-case, base-case, and worst-case projections.
- Break-even Analysis: Determine the sales volume required to cover fixed & variable costs.
- Sensitivity Analysis: Assess how changes in raw material costs, pricing, or demand impact profitability.
This Paper Recycling Company Financial Model structure will help any recycling company address a broad market spectrum, offering the right balance between cost, production capacity, and support.
Download Link On Next Page