
Medical Equipment Financial Model Template
A medical equipment manufacturer financial model gives founders, CFOs and investors a clear view of how a medical device business makes money, uses cash and funds its growth. This Excel template combines three years of monthly historical actuals with a five-year monthly forecast and annual roll-ups for 2027 to 2031. It links revenue, production, cost of goods sold, operating expenses, capital expenditure, debt, the income statement, the balance sheet and the cash flow statement in one integrated model. Every forecast figure traces back to a single assumptions tab, so you always know where each number comes from.
Financial Model for a Medical Equipment Manufacturer
The model is built specifically for medical device manufacturing, not adapted from a generic template. Revenue is built from units and average selling prices across ten product categories, including diagnostic, patient monitoring, surgical, respiratory, imaging and laboratory equipment, as well as consumables, spare parts and accessories. Recurring revenue from service contracts, maintenance, software licensing, calibration and extended warranties grows with an installed equipment base. On the operations side, factory capacity, production yield, scrap rates, labour hours, bill of materials costs, quality and sterilization costs, and warranty provisions all flow through to gross margin.
Use this medical device financial projection template for fundraising, bank loan applications, budgeting, capacity planning, investor due diligence or business valuation. A scenario selector lets you switch between Base, Upside, Downside, Management and Stress cases instantly. Twelve sensitivity inputs test the impact of changes in pricing, volumes, material costs, labour costs, working capital and interest rates. The cash runway tab shows monthly cash burn, months of runway and any funding requirement. A dedicated checks tab confirms that the balance sheet balances in every one of the 96 monthly periods.
What’s Inside: Tab-by-Tab Overview
01. Cover Model Guide
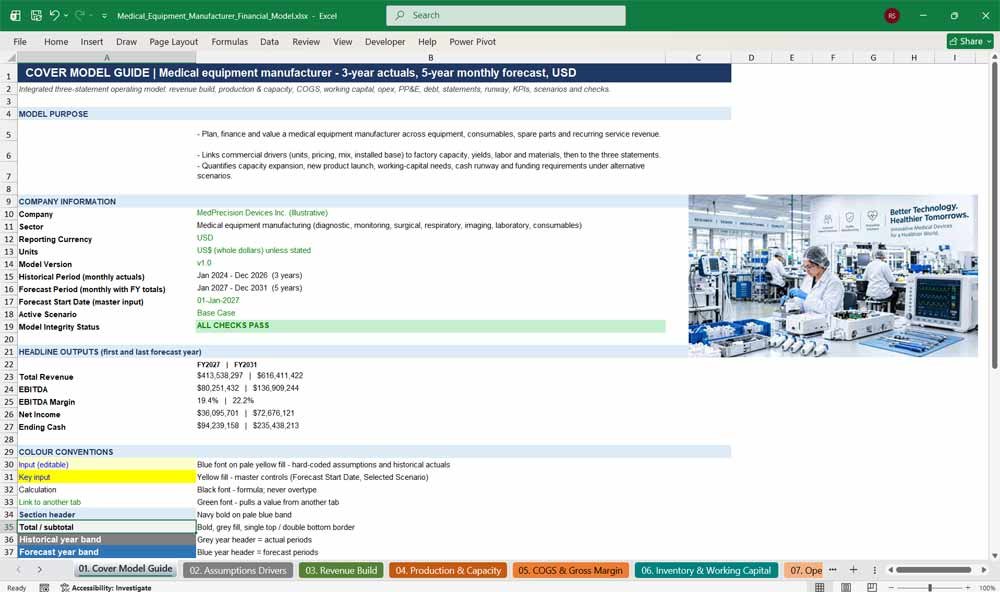
The cover tab introduces this medical equipment financial model with company details, reporting currency, model version, historical and forecast periods, and the active scenario. Headline revenue, EBITDA and cash outputs, a colour legend and clickable tab navigation help you move quickly around the workbook.
- Company information, version control and reporting units
- Live model integrity status (pass or review)
- Headline outputs for the first and last forecast years
- Colour-coding legend for inputs, formulas and links
- Hyperlinked navigation to all 15 tabs
02. Assumptions Drivers
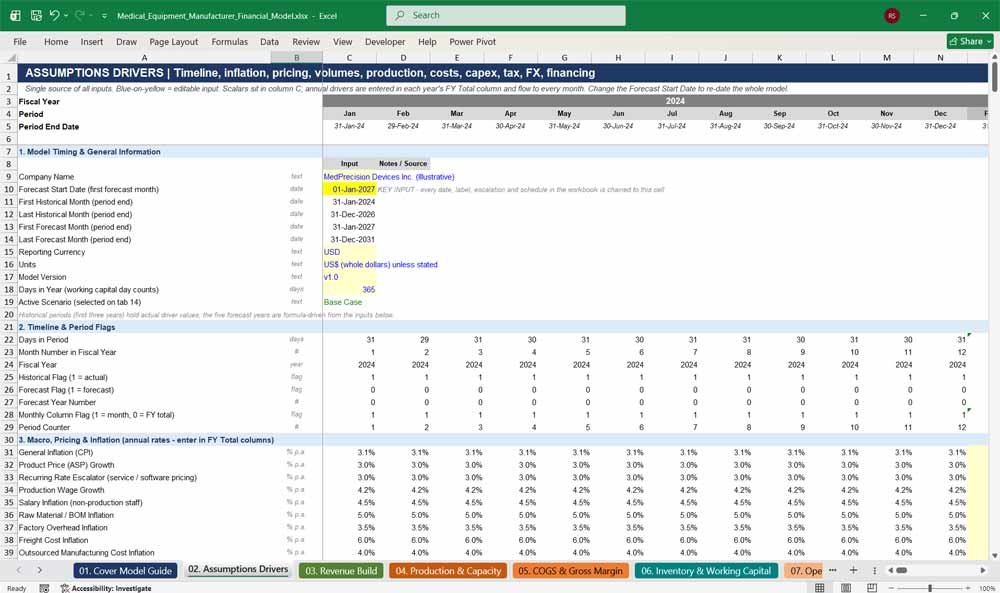
All model inputs sit on one assumptions tab, making this medical device Excel model easy to update. Enter inflation, pricing, volume growth, wage growth, production yields, scrap rates, tax rate, foreign exchange and financing assumptions. A single forecast start date automatically re-dates every period throughout the workbook.
- One master date input re-dates the entire model
- Annual drivers entered once and applied to every month
- Inflation indices for materials, wages, overhead, freight and salaries
- Capital project dates, budgets and capacity additions
- Opening balance sheet with an automatic balance check
Medical Equipment Manufacturer Revenues & Capital
03. Revenue Build
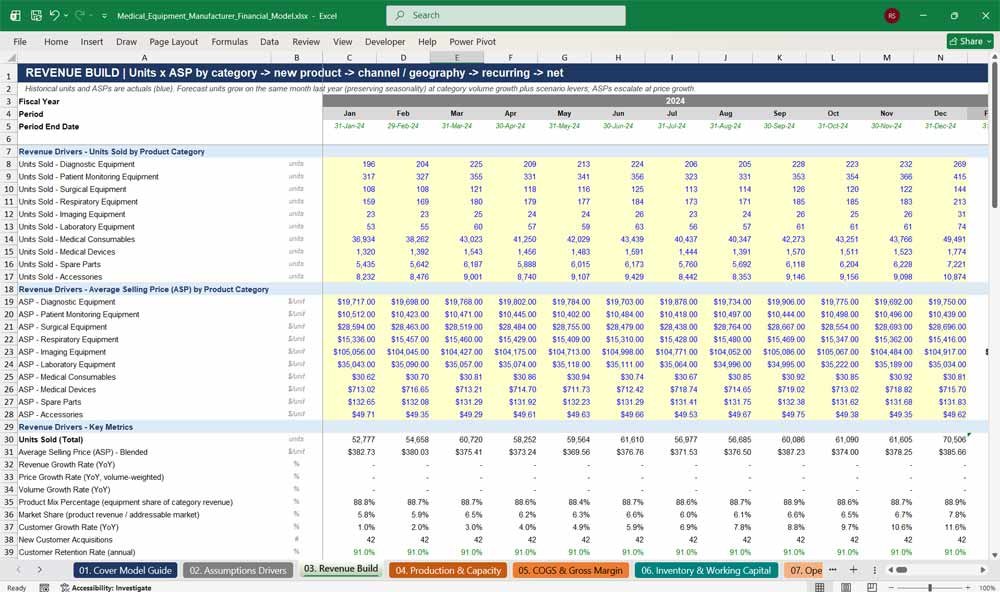
The revenue build forecasts medical equipment sales by units and average selling price across ten product categories, preserving monthly seasonality. Revenue is analysed by sales channel and geography, with recurring service revenue, new product launch revenue and revenue adjustments for discounts, rebates and returns.
- Units and ASP for ten medical equipment and consumables categories
- Eight sales channels and eight geographic regions
- Recurring revenue driven by the installed equipment base
- New product launch ramp-up and regulatory approval milestone
- Market share, customer growth and customer retention metrics
04. Production & Capacity
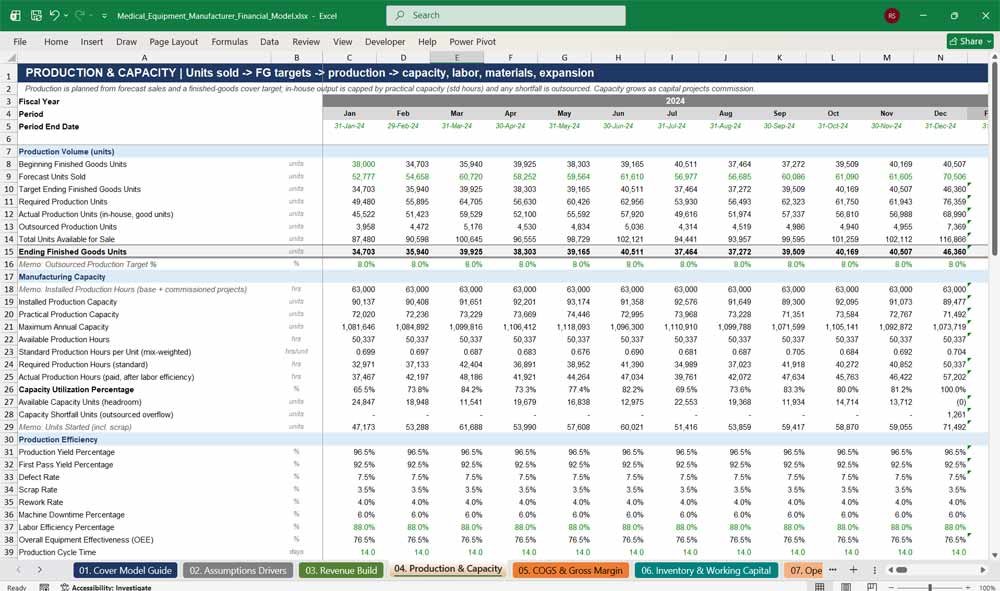
This production planning tab turns forecast sales into a manufacturing plan. It calculates required production, finished goods inventory, factory capacity utilization, labour requirements and raw material needs. Capacity shortfalls are covered by outsourced production, and new production lines add capacity as they are commissioned.
- Production volume plan with finished goods inventory targets
- Capacity utilization based on standard production hours
- Yield, first pass yield, scrap, rework, downtime and OEE
- Direct manufacturing headcount, hires and overtime
- Capacity expansion with commissioning dates and ramp-up
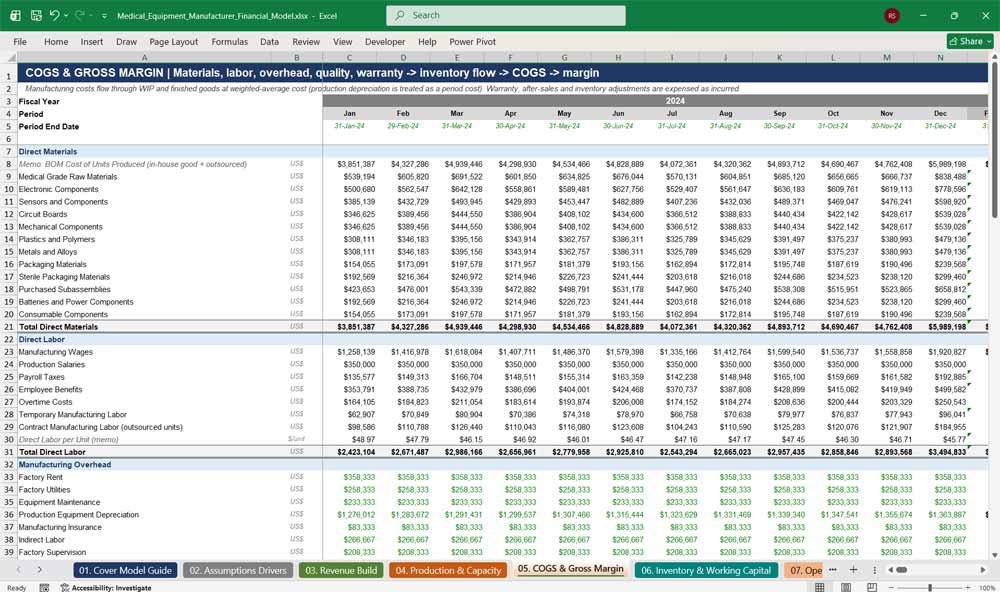
05. COGS & Gross Margin
The cost of goods sold schedule builds medical device manufacturing costs from direct materials, direct labour and manufacturing overhead. It also covers scrap, rework, quality testing, sterilization, warranty and after-sales costs. Inventory is valued at weighted-average cost, giving an accurate gross margin and cost per unit.
- Twelve direct material categories from a bill of materials mix
- Direct labour, overtime, temporary and contract manufacturing
- Quality, compliance, sterilization and lot release testing costs
- Warranty, recall, field service and product liability costs
- Gross margin by product, geography and sales channel
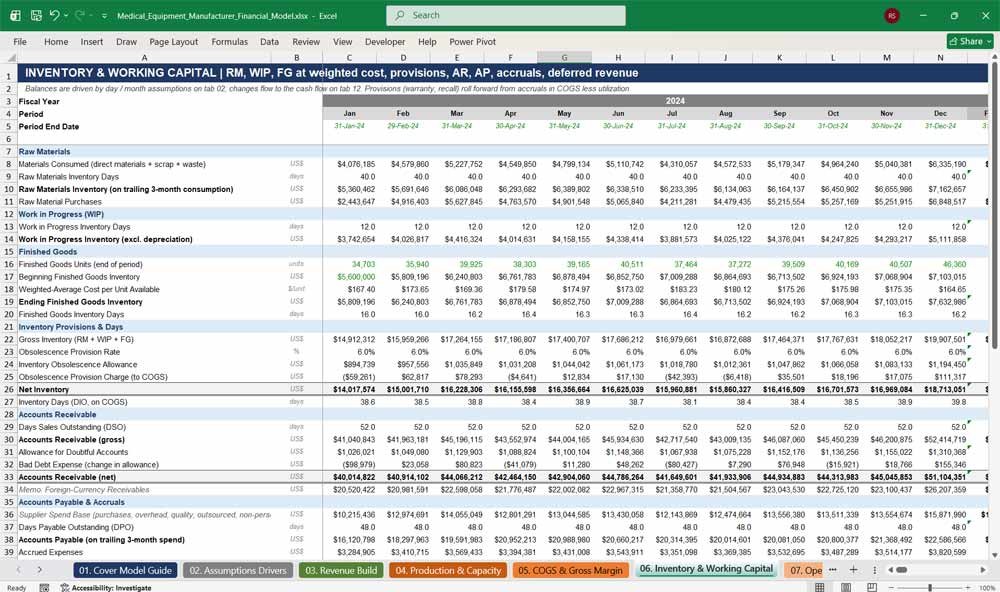
06. Inventory & Working Capital
This working capital tab forecasts raw materials, work in progress and finished goods inventory, alongside accounts receivable, accounts payable and accruals. Inventory obsolescence, doubtful debt allowances, warranty provisions and recall provisions are rolled forward monthly, showing the true cash tied up in operations.
- Raw materials, work in progress and finished goods balances
- Inventory days, receivable days and payable days
- Obsolescence and doubtful debt allowances
- Warranty and recall provision roll-forwards
- Cash conversion cycle and trade working capital
07. Operating Expenses
The operating expenses tab forecasts R&D, regulatory affairs, quality, clinical development, sales and marketing, and general and administrative costs. Headcount by department drives salaries, while payroll taxes, benefits, bonuses, pensions and share-based compensation are allocated to each function for accurate expense reporting.
- Departmental headcount with salary inflation
- R&D, regulatory, quality and clinical trial cost lines
- Sales commissions, customer acquisition and marketing costs
- Capitalized development costs
- Operating expenses as a percentage of revenue and per employee
Medical Equipment Manufacturer Financial Statements
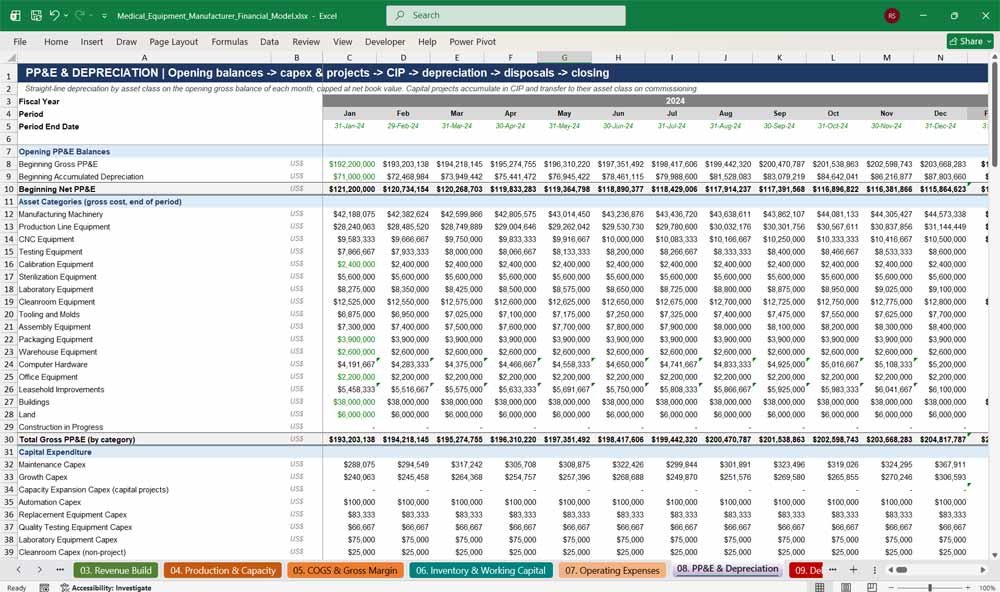
08. PP&E & Depreciation
This fixed asset schedule tracks 18 asset classes, from manufacturing machinery and cleanroom equipment to buildings and land. It forecasts maintenance and growth capital expenditure, capital projects, construction in progress, straight-line depreciation, asset disposals and intangible asset amortization for each month.
- Gross cost and depreciation for 18 asset classes
- Capital project tracker with budgets, dates and status
- Construction in progress transfers on commissioning
- Asset disposals with gain or loss on sale
- Capex to depreciation ratio and capex as a share of revenue
09. Debt & Interest
The debt schedule models a term loan, a new expansion loan tranche, a revolving credit facility and lease liabilities. The revolver draws automatically to protect the minimum cash balance and repays from surplus cash. Interest expense, commitment fees, arrangement fees and interest income are calculated monthly.
- Term loan drawdowns, amortization and interest
- Revolving credit facility with automatic cash sweep
- Lease liabilities and right-of-use assets
- Financing fees and interest income on cash
- Net debt and interest coverage ratio
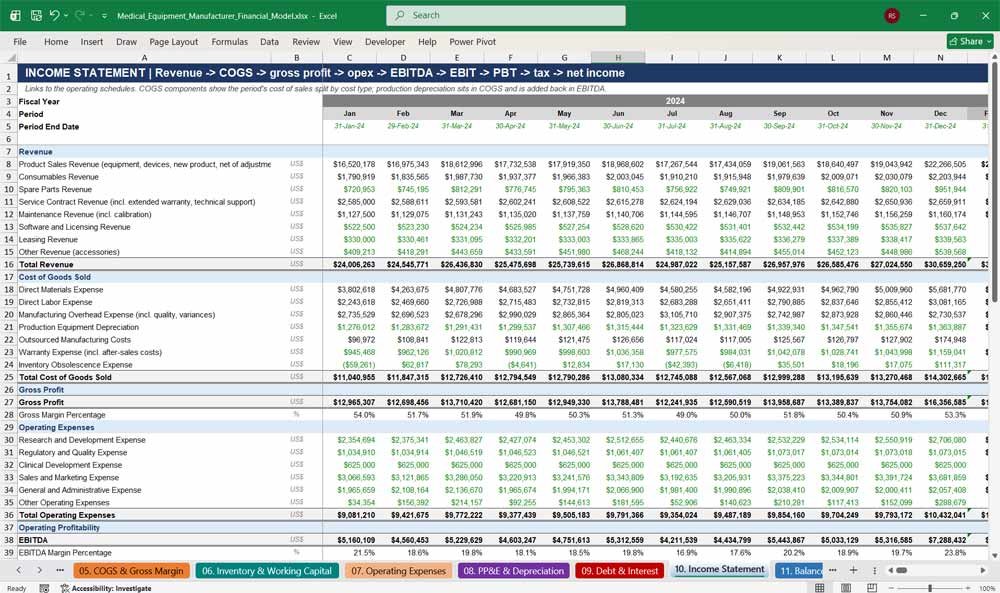
10. Income Statement
The income statement presents a full monthly and annual profit and loss for the medical equipment manufacturer. It runs from revenue through cost of goods sold, gross profit, operating expenses, EBITDA and EBIT to profit before tax and net income, including current tax, deferred tax and tax losses.
- Revenue by type, including product, consumables and services
- Cost of goods sold by cost category
- EBITDA, EBIT and net income with margins
- Current tax, deferred tax and tax loss carryforwards
- Adjusted EBITDA with non-recurring items
11. Balance Sheet
The balance sheet shows assets, liabilities and shareholders’ equity at every month end. Cash links from the cash flow statement, and all other balances link from the supporting schedules. A built-in balance check, liquidity ratios and leverage ratios support lender and investor review.
- Current and non-current assets, including inventory and PP&E
- Current and non-current liabilities, including debt and provisions
- Retained earnings and current year net income
- Balance sheet check for every period
- Current ratio, quick ratio and debt to equity ratio
12. Cash Flow Runway
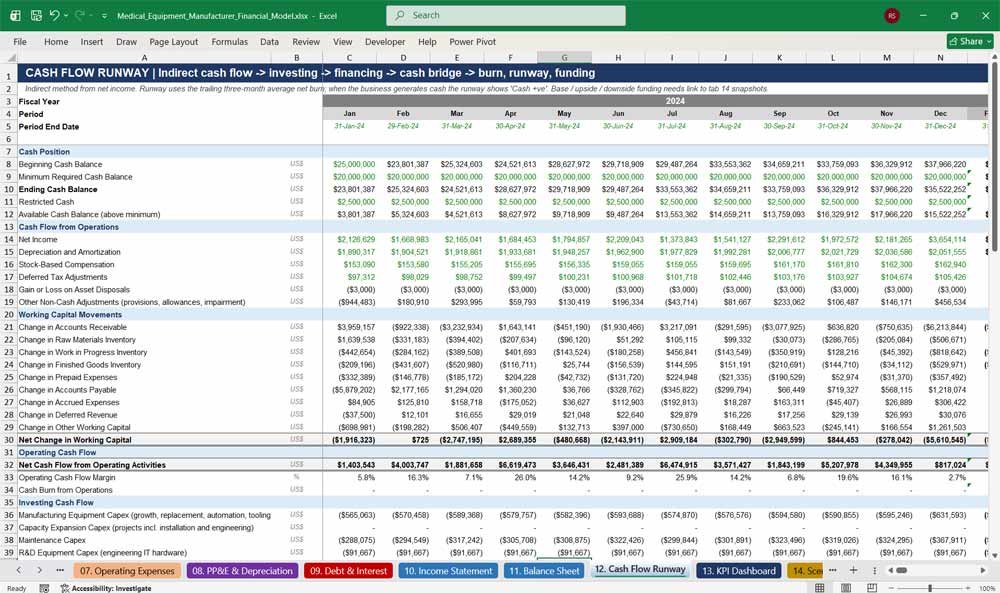
The cash flow runway tab produces an indirect cash flow statement covering operating, investing and financing activities. It measures monthly cash burn, months of runway, funding shortfalls and required additional funding, helping medical device companies plan fundraising and manage liquidity.
- Operating, investing and financing cash flows
- Free cash flow and free cash flow margin
- Monthly cash burn and cash runway in months and years
- Funding requirement, expected funding date and breakeven date
- Base, upside and downside funding requirements
Key Financial Metrics for a Medical Equipment Manufacturer
13. KPI Dashboard
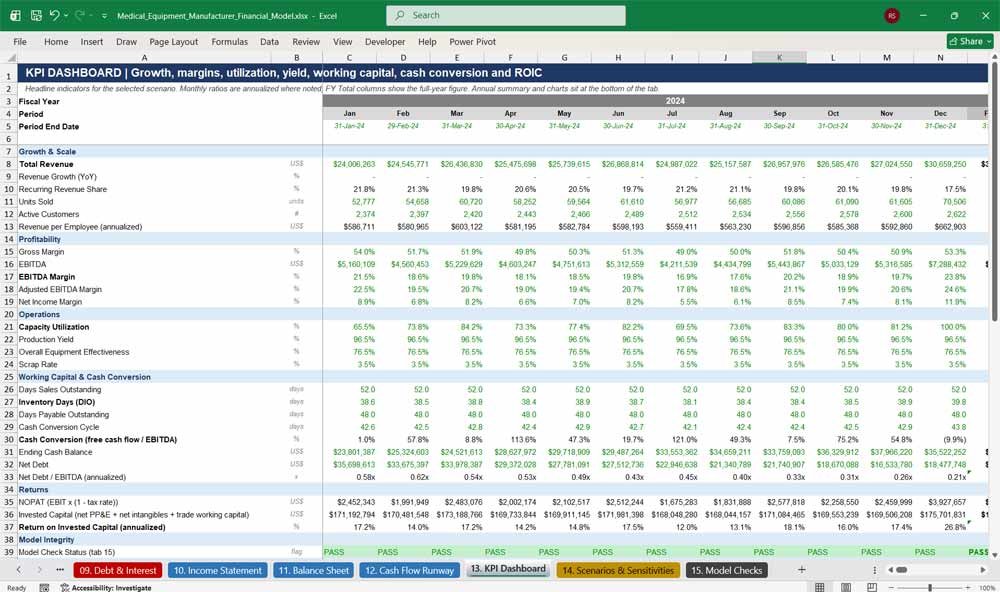
The KPI dashboard summarises the key performance indicators investors and management track for a medical equipment manufacturer. It covers revenue growth, gross margin, EBITDA margin, capacity utilization, production yield, inventory days, cash conversion and return on invested capital, with annual charts.
- Revenue growth, recurring revenue share and revenue per employee
- Gross margin, EBITDA margin and net margin
- Capacity utilization, yield, OEE and scrap rate
- Working capital days, cash conversion and net debt to EBITDA
- Return on invested capital and annual summary charts
14. Scenarios & Sensitivities
The scenarios tab lets you test the medical device financial model under five cases with one dropdown. Around 60 scenario levers cover revenue, production, costs, operating expenses, capital investment, working capital and financing, while twelve sensitivity inputs layer additional stress tests on top.
- Base, Upside, Downside, Management and Stress cases
- Around 60 scenario levers across seven assumption groups
- Twelve sensitivity flexes, including price, volume and interest rates
- Live output metrics for the selected scenario
- Side-by-side scenario comparison of revenue, EBITDA, cash and funding
15. Model Checks
The model checks tab confirms that the financial model is accurate and reliable. It tests balance sheet balancing, cash roll-forward, debt roll-forward, retained earnings, PP&E and cross-schedule reconciliations in every period, with a clear pass or review status.
- 19 integrity checks with a tolerance of $1
- Pass or review status for every monthly period
- Overall model status shown on the cover and KPI tabs
- Revenue, COGS, operating expense and EBITDA reconciliations
- Opening balance sheet and input mix checks
Why Buy This Model
Building a medical equipment manufacturer financial model from scratch can take weeks, and one broken link can undermine investor confidence. This template gives you a fully integrated, professionally formatted three-statement model designed specifically for medical device manufacturing. It is ready to use as soon as you enter your own figures. Every forecast is driven by clearly labelled assumptions. Scenarios and sensitivities show lenders and investors how the business performs under pressure. Built-in checks confirm the model balances in all 96 months. Whether you are raising capital, applying for a bank loan, planning a new production line or preparing a budget, you get a credible, transparent and lender-ready forecast in a fraction of the time.
Frequently Asked Questions
Is this model suitable for a medical device start-up, or only for established manufacturers?
It is set up for an established manufacturer with three years of historical data, but it works for earlier-stage companies too. Replace the historical actuals with your own figures, or with low starting values. The cash runway, funding requirement and equity financing inputs are designed to support fundraising.
Do I need advanced Excel skills to use it?
No. All inputs are on the Assumptions Drivers tab, marked in blue text on a yellow background. Everything else calculates automatically. The cover tab explains the colour coding and links to every tab, so you can find your way around quickly.
Can I change the start date and fiscal year?
Yes. Change the forecast start date on the Assumptions Drivers tab, and every date, month label, year heading and schedule updates automatically. If your financial year starts in April, set the start date to April and the fiscal years follow.
Does the model include historical data?
Yes. It includes three years of monthly historical periods followed by five years of monthly forecasts, each with an annual total column. The historical figures are illustrative placeholders, so replace them with your company’s actual results.
What products does the revenue build cover?
The revenue build covers ten categories: diagnostic, patient monitoring, surgical, respiratory, imaging and laboratory equipment, plus medical consumables, medical devices, spare parts and accessories. It also includes recurring service revenue and a new product launch with regulatory approval timing.
Can I model a new production line or factory expansion?
Yes. The model includes three capital projects with start, delivery, installation and commissioning dates, budgets and capacity additions. Spending builds up in construction in progress, transfers to fixed assets on commissioning, and adds production capacity with a ramp-up period.
How does the model handle inventory and working capital?
Raw materials, work in progress and finished goods are forecast separately, with finished goods valued at weighted-average cost. Receivables, payables, accruals, deferred revenue, obsolescence allowances, and warranty and recall provisions are all included. Changes flow through to the cash flow statement.
Can I run different scenarios?
Yes. Choose Base, Upside, Downside, Management or Stress from a dropdown on the Scenarios & Sensitivities tab, and the whole model recalculates instantly. You can also apply twelve sensitivity inputs, such as price, volume, material costs and interest rates, on top of any scenario.
Will the balance sheet balance?
Yes. The balance sheet balances in every one of the 96 monthly periods. The Model Checks tab runs 19 integrity tests, including the balance sheet, cash, debt and retained earnings roll-forwards, and shows a pass or review status for each period.
Is it suitable for presenting to banks and investors?
Yes. The model follows professional financial modelling conventions: colour-coded inputs, formulas and links, consistent formatting, section headers and a full set of reconciliation checks. It includes the income statement, balance sheet, cash flow, KPIs, debt schedules and scenario analysis that lenders and investors expect.
Does the model use macros?
No. The model uses standard Excel formulas only, with no macros or VBA, so it opens without security warnings. There are no circular references, because interest is calculated on opening balances.
What currency does the model use, and can I change it?
The model is presented in US dollars. The currency label is an input on the Assumptions Drivers tab, so you can enter your own currency and figures. Number formats display a dollar sign, which you can change using Excel’s formatting tools.
Can I add more products or cost lines?
Yes. The model is fully unlocked, so you can rename existing categories or insert new rows. The simplest approach is to rename the existing product categories and cost lines to match your business, which keeps all formulas and checks intact.
Further Reading
Medical Center: Managing a healthcare facility requires precise forecasting, and using a pre-built medical center financial model can streamline your budgeting and revenue projections.
Conclusion on the Financial Model
This financial model for a medical equipment manufacturer provides a detailed framework to forecast revenue, manage expenses, analyze cash flow, and assess financial stability. By incorporating key financial statements and performance metrics, companies can optimize operations, attract investors, and plan for long-term growth.
Download Link On Next Page