Medical Center DCF Financial Model (2026 Excel)
DCF Financial model for a medical center
Unlike a generic financial model template, this one is purpose-built for healthcare real estate and operations: patient volume ramp-ups, payer-mix-adjusted revenue, staffing ratios by department, construction-loan-to-permanent-loan conversion, and medical equipment depreciation schedules are all modeled explicitly. The workbook flows through a complete three-statement model — income statement, cash flow statement, and balance sheet — into a full DCF valuation with WACC, terminal value, and enterprise-to-equity bridge, so you get an investment-grade analysis, not just a budget spreadsheet.
Whether you’re pitching lenders on a construction loan, raising equity from healthcare-focused investors, or simply stress-testing your own development assumptions, this model gives you the numbers to back it up. Eighteen color-coded tabs, live sensitivity tables, scenario switching, and a one-page dashboard mean you can answer “what if volumes ramp slower” or “what if rates come in lower” in seconds — and walk into any investment committee, bank meeting, or board discussion with a defensible, auditable financial model.
Why Buy This Model
Building a bankable medical center financial model from scratch takes weeks of modeling work and a deep understanding of healthcare reimbursement, construction financing, and DCF valuation mechanics — mistakes that are easy to make and expensive to catch late. This model compresses that work into a ready-to-use template: every formula is pre-built and cross-checked (the balance sheet ties out to the penny in every period), every assumption is clearly labeled and editable, and the valuation, returns, and sensitivity analysis you need for a lender package or investor deck are already built in. Instead of paying a consultant or spending your own hours reinventing construction draw schedules and terminal value formulas, you get a professional-grade, audit-ready model you can customize with your own numbers in an afternoon — and reuse for every future healthcare real estate deal.
Medical Center Model Tab-by-Tab Breakdown
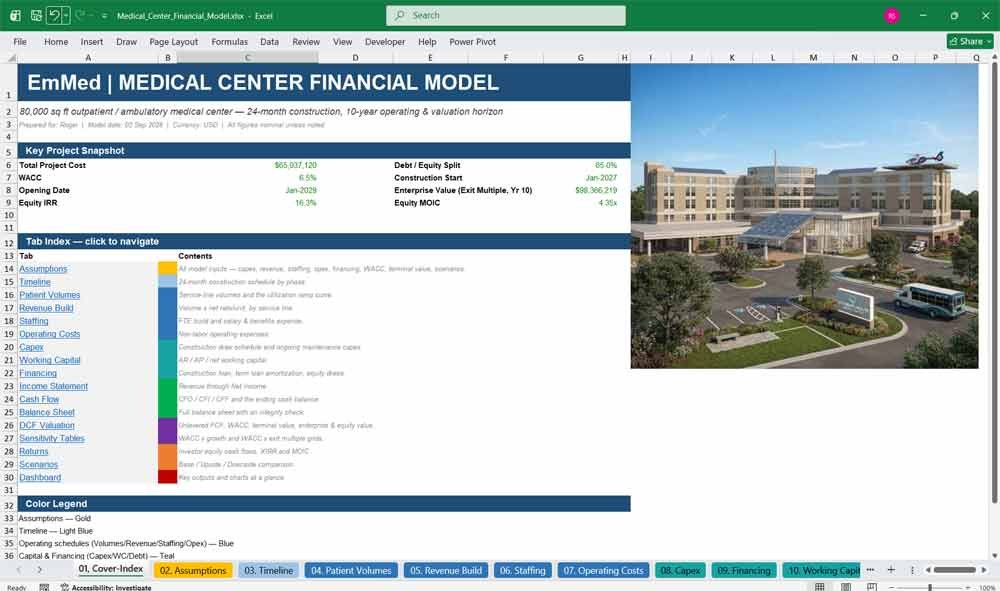
1. Cover / Index
A navigation hub with one-click hyperlinks to all eighteen tabs, a color-coded tab legend, and a live snapshot of total project cost, WACC, equity IRR, and MOIC — so lenders, partners, and investors can orient themselves in seconds without digging through formulas.
Highlights:
- Clickable index linking every tab in the workbook
- Live key-metrics snapshot (project cost, WACC, IRR, MOIC)
- Color-coded legend explaining the model’s tab groupings
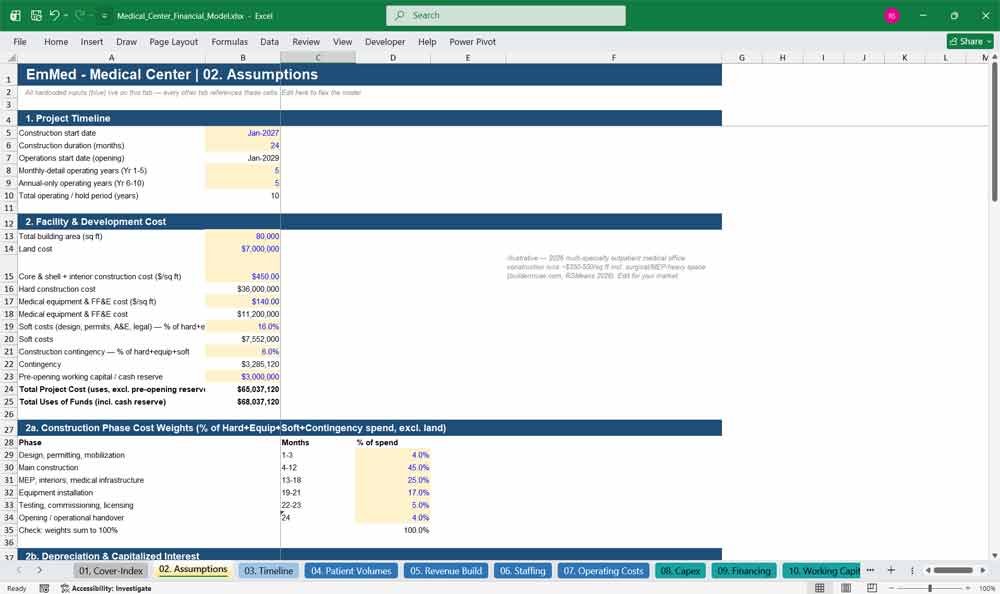
2. Assumptions
The control panel for the entire financial model: construction costs, service-line volumes and rates, staffing levels, operating expense ratios, financing terms, WACC inputs, and terminal value drivers all live here in clearly labeled, color-coded input cells that flow through every downstream tab automatically.
Highlights:
- Every hardcoded input centralized in one editable tab
- Built-in Base / Upside / Downside scenario switch
- Sourced, defensible benchmarks for construction cost and exit multiples
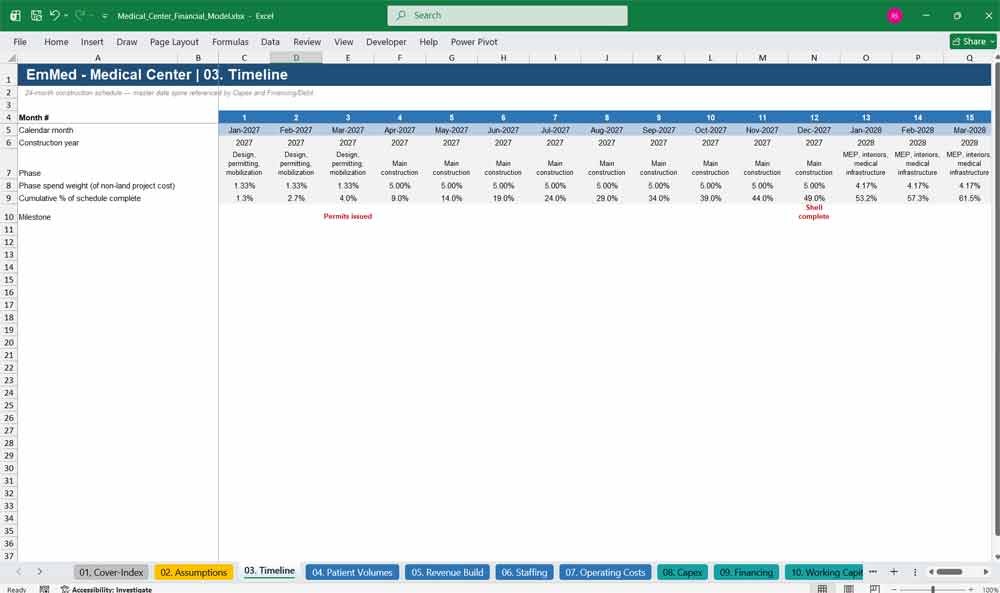
3. Timeline
A 24-month construction schedule broken into the six real-world phases of a medical center build — design and permitting, main construction, MEP and interiors, equipment installation, testing and commissioning, and opening — with spend weighting and milestones by month.
Highlights:
- Month-by-month construction phasing with milestone flags
- Automatic spend-weighting feeding the capex and financing tabs
- Cumulative percent-complete tracker for lender and investor reporting
Medical Center Costs
4. Patient Volumes
Models service-line patient volumes for imaging, ambulatory surgery, physician clinics, and urgent care, with a configurable utilization ramp curve that mirrors how a real outpatient facility fills up post-opening — a critical driver lenders and investors scrutinize in any healthcare pro forma.
Highlights:
- Volume ramp curve from opening-day utilization to full stabilization
- Separate tracking for imaging, surgery, clinic, and urgent care lines
- Monthly detail for five years, annual thereafter
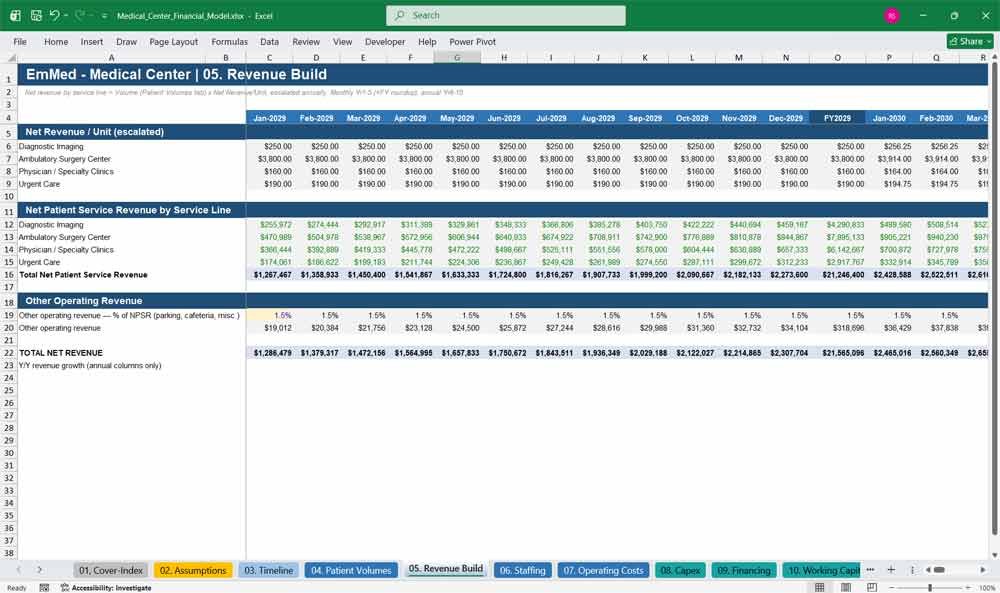
5. Revenue Build
Converts patient volumes into net revenue using service-line-specific rates that escalate annually, net of payer mix and contractual allowances — giving you a defensible, bottoms-up revenue forecast instead of a single top-line growth assumption that won’t survive investor diligence.
Highlights:
- Bottoms-up revenue: volume x net rate, by service line
- Annual rate escalation with payer-mix-adjusted realization
- Automatic roll-up to total net patient service revenue
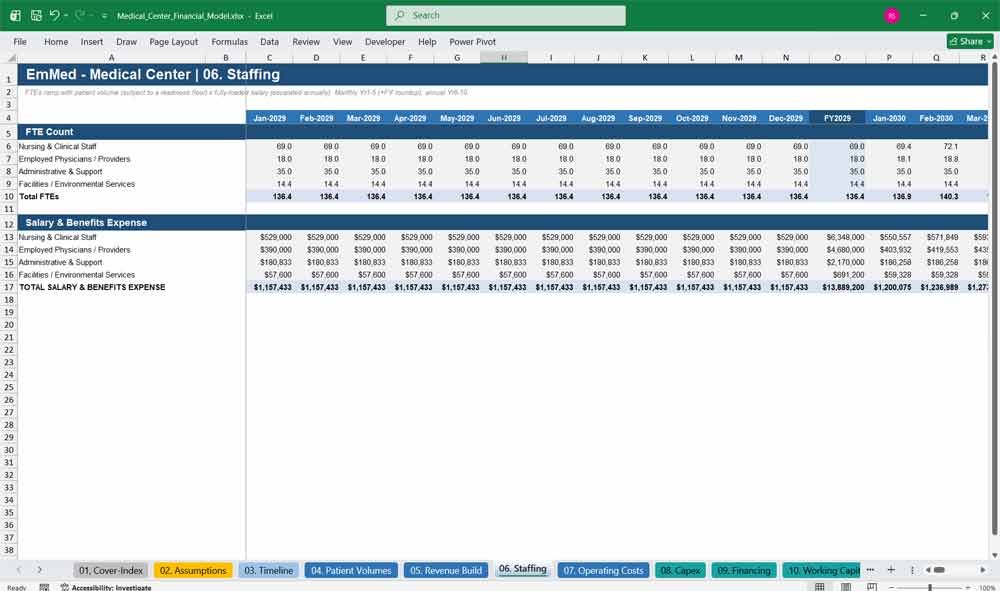
6. Staffing
Builds a department-level FTE and compensation schedule — nursing, physicians, administration, and facilities — that ramps with patient volume subject to a minimum staffing floor, so labor costs realistically track the same utilization curve driving your revenue forecast.
Highlights:
- FTE counts tied directly to the volume ramp curve
- Minimum staffing floor for pre-stabilization readiness costs
- Salary and benefits escalation by department, year over year
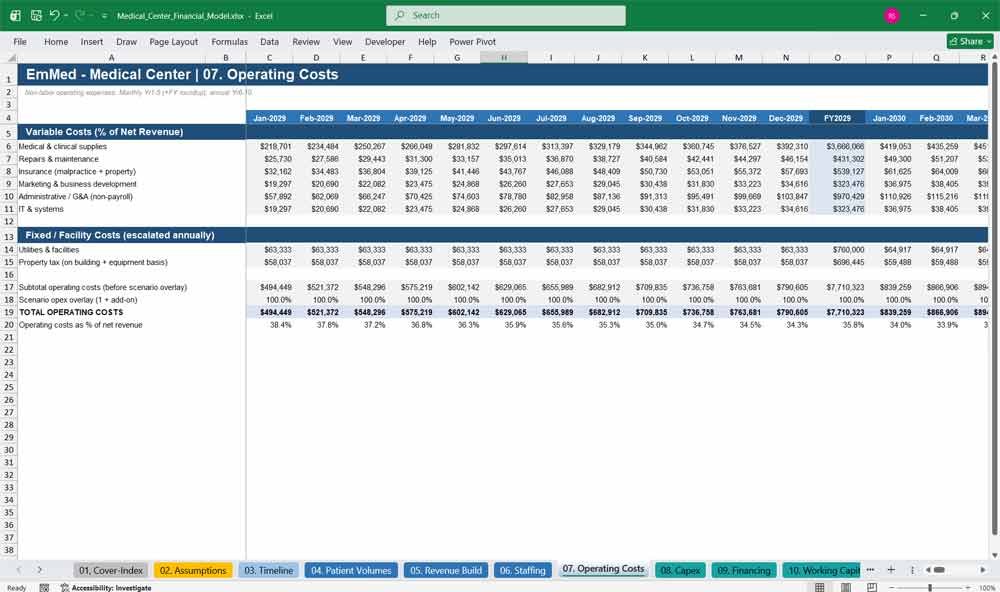
7. Operating Costs
Forecasts every non-labor operating expense — medical supplies, utilities, insurance, marketing, G&A, IT, and property tax — using a mix of percent-of-revenue and per-square-foot drivers, so your opex forecast scales realistically as the facility ramps toward stabilization.
Highlights:
- Eight expense categories with independently adjustable drivers
- Per-square-foot utilities and property tax calculations
- Scenario-linked inflation overlay for stress-testing cost growth
8. Capex
Tracks the full construction capital budget by phase and month, then transitions seamlessly into an ongoing maintenance capex schedule tied to a percentage of net revenue — connecting your development budget directly to long-term reinvestment needs.
Highlights:
- Month-by-month construction draw schedule by cost category
- Built-in check that cumulative capex ties to total project cost
- Ongoing maintenance capex modeled as a percent of revenue
9. Working Capital
Calculates accounts receivable and accounts payable using industry-standard DSO and DPO assumptions, then derives the net working capital swing that feeds directly into your cash flow statement and unlevered free cash flow build in the DCF tab.
Highlights:
- AR and AP driven by editable DSO / DPO inputs
- Net working capital balance tracked every period
- Feeds directly into cash flow and DCF free cash flow
Medical Center Model Cash Flows
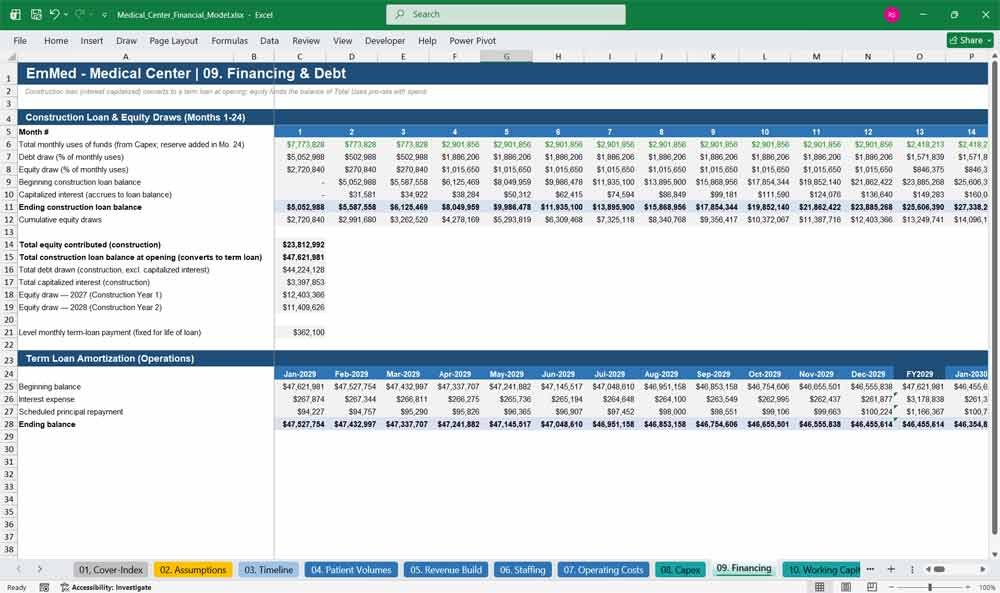
10. Financing
Models a construction loan with capitalized interest that converts into a fully amortizing term loan at opening, alongside the equity draws needed to fund the balance of the project — the exact structure lenders and equity partners expect to see.
Highlights:
- Construction-to-permanent loan structure with capitalized interest
- Automatic term loan amortization schedule through Year 10
- Debt and equity draw schedule by construction month
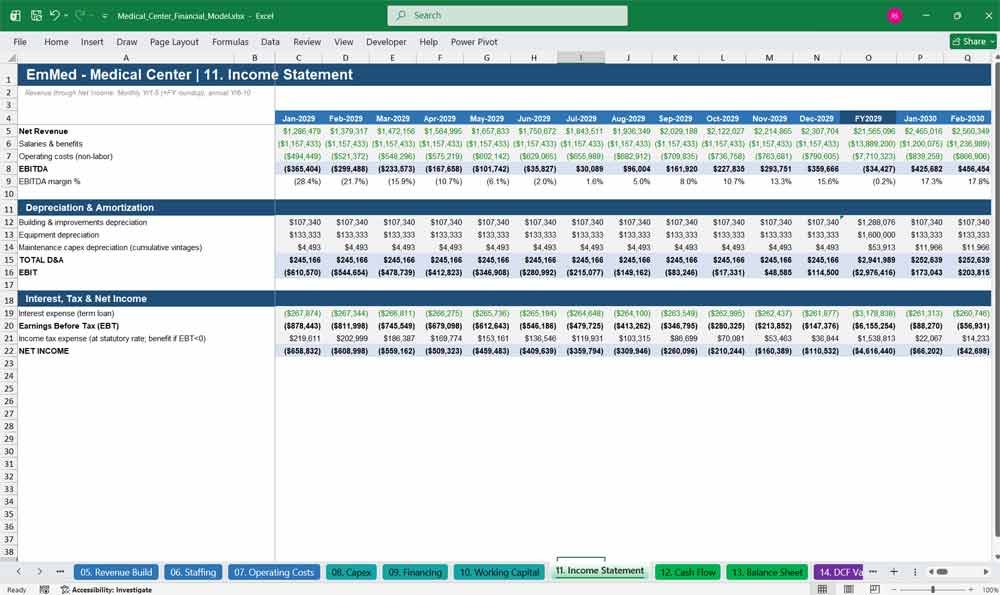
11. Income Statement
A complete monthly-to-annual income statement running from net revenue through EBITDA, depreciation and amortization, interest expense, taxes, and net income — giving you a GAAP-style profitability view for every period of the construction and operating horizon.
Highlights:
- Full P&L from revenue down to net income
- Separately tracked building, equipment, and maintenance-capex depreciation
- EBITDA margin trend visible across all ten operating years
12. Cash Flow
A three-part cash flow statement — operating, investing, and financing — that includes a built-in 100% free-cash-flow sweep to equity holders once debt service is covered, so you can see exactly when and how much cash investors actually receive.
Highlights:
- Operating, investing, and financing cash flow fully modeled
- Automatic equity distribution sweep after debt service
- Beginning and ending cash balance tracked every period
13. Balance Sheet
A complete balance sheet — cash, receivables, net property and equipment, debt, payables, and equity — with a built-in integrity check confirming assets equal liabilities plus equity in every single period, from opening day through Year 10.
Highlights:
- Full balance sheet linked to every upstream tab
- Automated balance check across all 71 modeled periods
- Retained earnings rolled forward net of distributions
Key Financial Metrics for a Medical Center
14. DCF Valuation
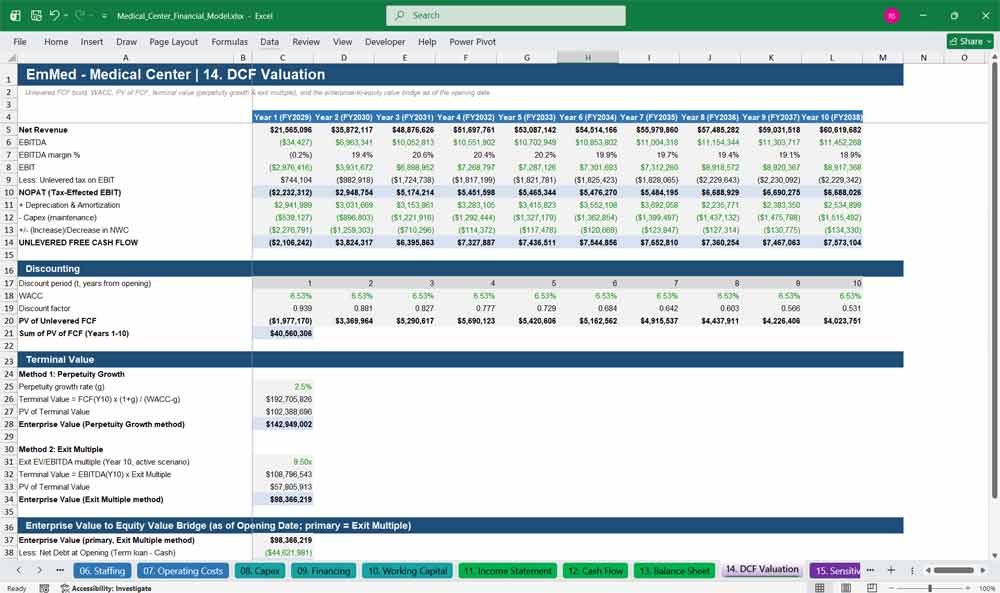
Builds unlevered free cash flow from revenue down through EBITDA, EBIT, NOPAT, D&A, capex, and working capital, then applies a CAPM-based WACC and both perpetuity growth and exit multiple terminal value methods to bridge to enterprise and equity value.
Highlights:
- Full unlevered FCF build following the standard DCF waterfall
- WACC calculated from CAPM cost of equity and after-tax cost of debt
- Perpetuity growth and exit multiple methods, side by side
15. Sensitivity Tables
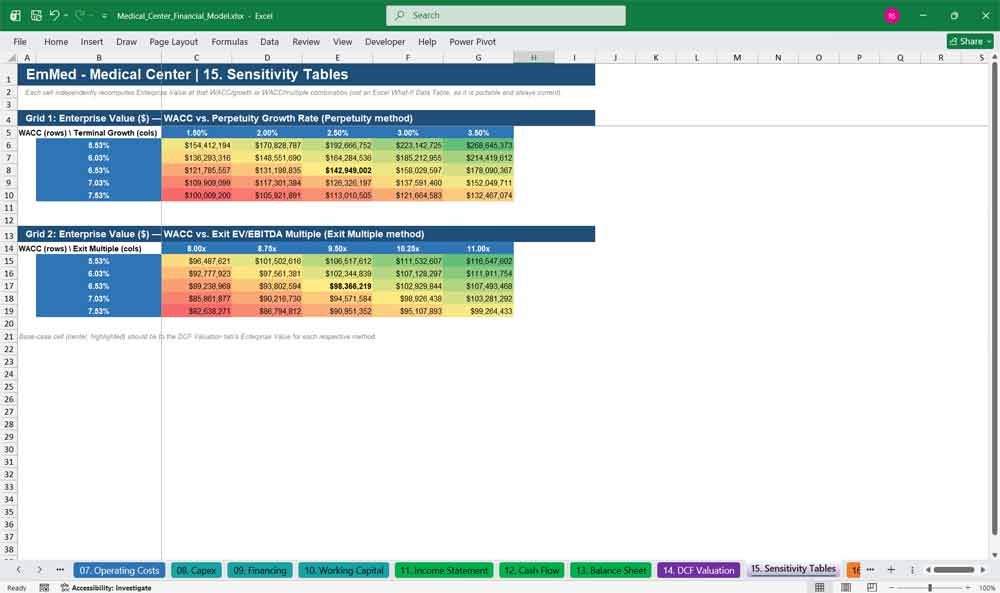
Two live sensitivity grids — WACC versus terminal growth rate, and WACC versus exit multiple — that independently recompute enterprise value at every combination, so you can instantly see how sensitive your valuation is to your two biggest assumptions.
Highlights:
- Five-by-five WACC vs. growth rate sensitivity grid
- Five-by-five WACC vs. exit multiple sensitivity grid
- Color-scaled heatmaps for instant visual read of valuation range
16. Returns
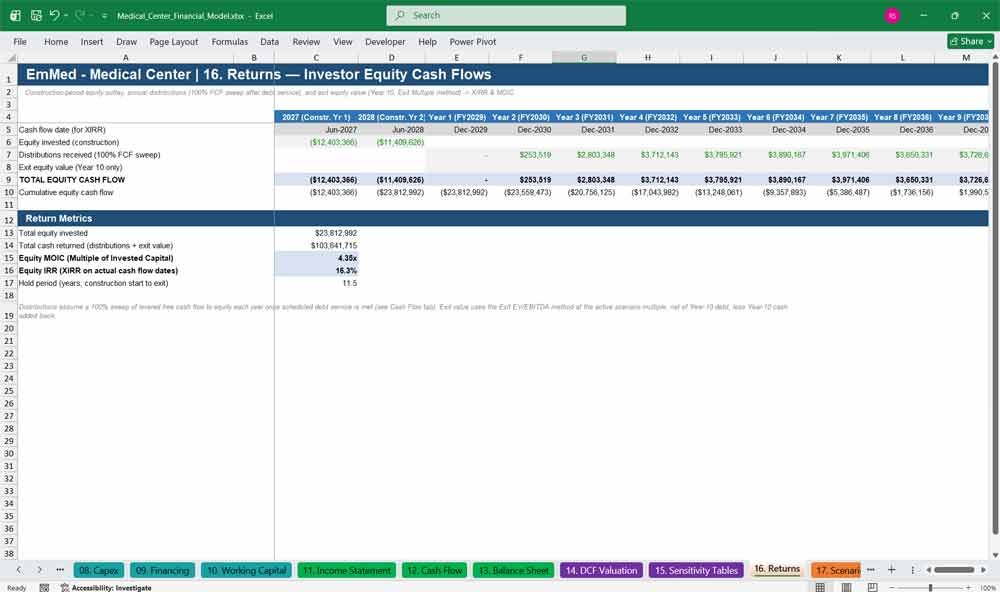
Tracks actual investor equity cash flows — construction-period capital calls, annual distributions, and exit proceeds — and calculates XIRR and MOIC on real dates, giving equity investors the exact return metrics they’ll want to see before committing capital.
Highlights:
- Real dated cash flows powering an accurate XIRR calculation
- Equity MOIC alongside IRR for a complete returns picture
- Exit value net of Year-10 debt and cash
17. Scenarios
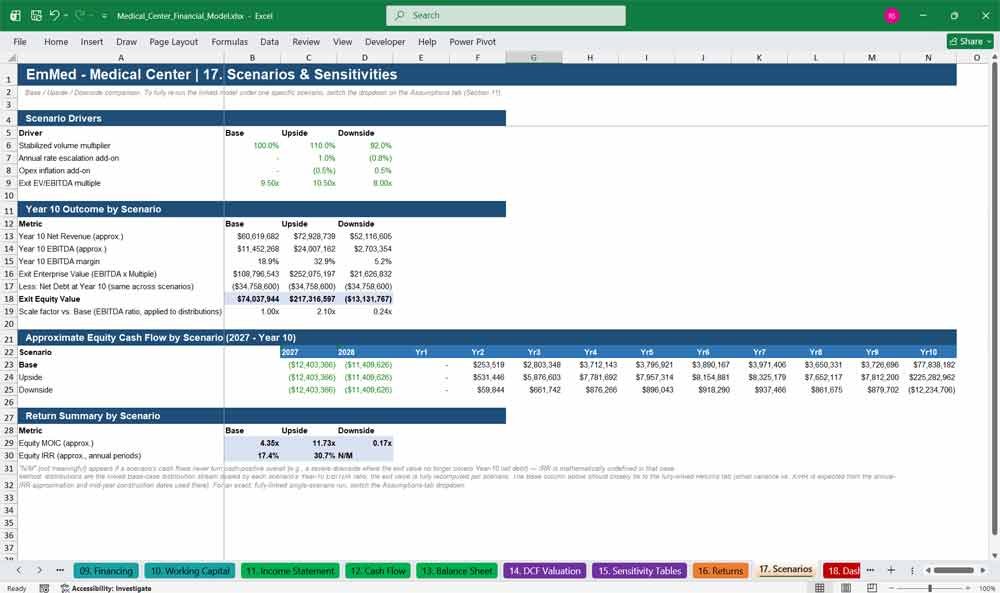
Compares Base, Upside, and Downside cases side by side across volume, pricing, cost, and exit multiple assumptions — while a live dropdown on the Assumptions tab lets you flip the entire model to any single scenario for a fully-linked recalculation.
Highlights:
- Base / Upside / Downside comparison in one view
- Live scenario selector that recalculates the entire linked model
- Approximate IRR and MOIC shown for every scenario
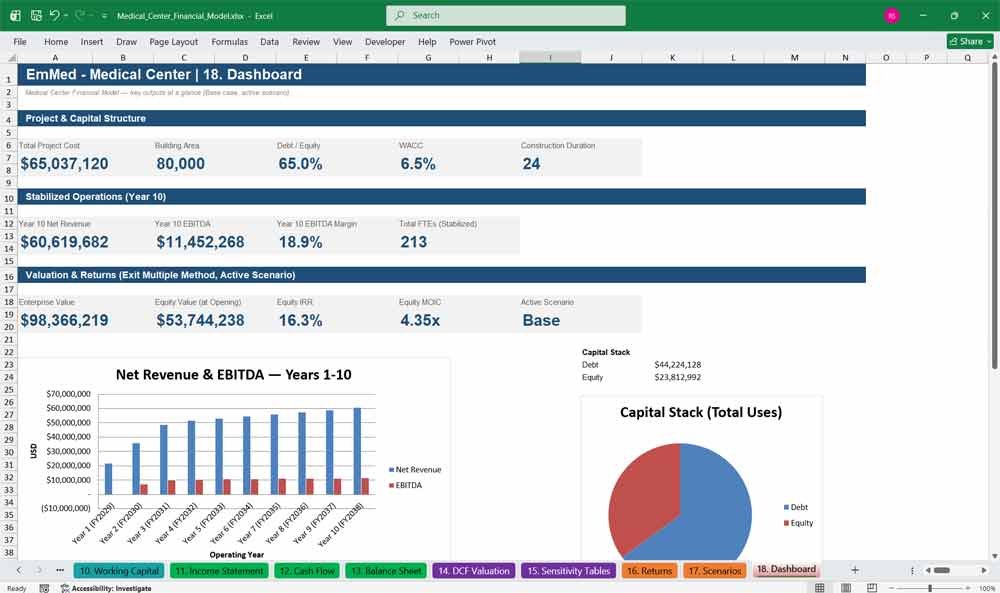
18. Dashboard
A one-page executive summary with KPI cards for project cost, WACC, stabilized EBITDA margin, enterprise value, equity IRR, and MOIC, plus charts for the revenue and EBITDA trend, capital stack, and patient volume ramp curve.
Highlights:
- KPI cards for every headline metric investors ask about first
- Revenue, EBITDA, capital stack, and utilization ramp charts
- Built for a one-screen investment committee or lender presentation
Medical Center Frequently Asked Questions
Can I use this model for a project that isn’t 80,000 square feet or isn’t an outpatient center?
Yes. The 80,000-square-foot outpatient/ambulatory footprint is the illustrative starting point, but every input that drives size, cost, and revenue — square footage, cost per square foot, service-line volumes, and rates — lives on the Assumptions tab. Change those inputs and the entire model, including the DCF and returns, recalculates automatically for a larger hospital, a smaller single-specialty clinic, or any facility mix in between.
Do I need to be an expert in financial modeling or healthcare finance to use this?
No. The model is fully built and fully linked — you don’t need to write a single formula. You’ll get the most value if you understand your own project’s numbers (construction cost, expected patient volumes, reimbursement rates), but the Assumptions tab is clearly labeled and color-coded so you know exactly which cells to edit and which are pre-built calculations.
What version of Excel do I need, and will it work in Google Sheets?
The model is built in standard, widely-supported Excel functions (SUMIFS, INDEX/MATCH, XIRR, PMT, and similar) and has been tested to recalculate cleanly with zero formula errors. It opens correctly in any modern version of Excel (2016 or later, including Microsoft 365) and works in Google Sheets as well, though we recommend Excel for the smoothest experience with the charts and conditional formatting.
Does the model actually balance, or is the balance sheet just for show?
It balances. Every one of the 71 periods modeled — from the opening balance sheet through ten years of operations — includes a live balance check confirming assets equal liabilities plus equity, and the entire workbook recalculates with zero formula errors. This isn’t a cosmetic balance sheet; it’s fully derived from the income statement, cash flow statement, debt schedule, and working capital tabs.
Can I use this to apply for a construction loan or raise equity from investors?
Yes — that’s exactly what it’s designed for. The construction loan draw schedule, capitalized interest, term loan conversion, and DSCR reference point give lenders the information they typically require, while the DCF valuation, sensitivity tables, and investor returns tab (XIRR and MOIC) give equity investors the analysis they’ll expect to see in a raise. Many buyers use this model as the financial backbone of a lender package or investment memorandum.
How is this different from a generic three-statement financial model template?
Generic templates aren’t built for the specific mechanics of a healthcare facility development: a multi-phase construction timeline, a patient-volume ramp curve, payer-mix-adjusted reimbursement, department-level clinical staffing ratios, construction-to-permanent loan conversion, and medical equipment depreciation. This model bakes all of that in from the start, so you’re customizing a healthcare-specific model rather than retrofitting a generic one.
What’s the difference between the monthly and annual sections of the model?
Construction is modeled monthly over 24 months. Operations are modeled monthly for Years 1 through 5 (with an annual roll-up column for each year) to capture the ramp-up period in detail, then annually for Years 6 through 10 once the facility is fully stabilized. The DCF valuation, sensitivity tables, returns, and scenario tabs all work off a consistent 10-year annual view.
Can I change the exit assumptions, hold period, or terminal value method?
Yes. The DCF Valuation tab calculates enterprise value using both the perpetuity growth method and the exit multiple method side by side, and both are driven by editable Assumptions-tab inputs (perpetuity growth rate, exit EV/EBITDA multiple). The Sensitivity Tables tab also lets you see how enterprise value moves across a range of WACC, growth, and multiple combinations without changing a single input permanently.
Is there a scenario or stress-test function built in?
Yes. The Assumptions tab includes a Base / Upside / Downside dropdown that flips the volume, rate, opex inflation, and exit multiple drivers for the entire linked model in one click, and the Scenarios tab shows all three cases side by side, including an approximate IRR and MOIC for each — so you can immediately see how much downside protection or upside potential your assumptions imply.
Will I need to hire a modeler to customize this for my deal?
Most buyers won’t. Every assumption is isolated in labeled, color-coded cells with source notes where relevant, and the model’s formulas are consistent across every time period, so updating an assumption (say, your actual construction cost per square foot or your local reimbursement rates) flows through the entire model automatically. If your project has a materially different structure — for example, no construction phase, or a different financing waterfall — you may want a modeler’s help adapting the structure itself.