
Infrastructure Project Financial Model Template
Project Aurora is a fully-linked infrastructure project finance model template in Excel built for large-scale infrastructure — the kind of asset that takes years to build and decades to operate, like a toll road or energy facility. Rather than modelling construction and operations as separate exercises, the entire asset life is run through a single engine with 360 consecutive monthly periods, covering a 5-year construction phase followed by 25 years of operations. Every formula in the workbook is driven off this one timeline, so a change to a single assumption — a delayed construction schedule, a tariff shock, a change in interest rates — flows automatically through revenue, debt, tax, and the three financial statements, all the way to the investment returns.
30-Year Infrastructure Project financial model
One monthly engine, multiple views
All economics are calculated at the monthly level, which is the only way to properly capture things like interest-during-construction, seasonal drawdowns, or a debt reserve account that has to be funded a fixed number of months ahead. Quarterly and annual tabs then roll this detail up into the views that lenders, investors, and management actually want to read.
Debt is split into a senior tranche and a subordinated mezzanine tranche, each with its own pricing, amortisation logic, and payment priority — sculpted to a target debt service coverage ratio rather than a fixed repayment schedule, the way real infrastructure debt is usually structured.
Full project circularity handled correctly, without breaking Excel.
Interest expense, tax, and cash sweep mechanics all interact with each other in a real capital structure. The model resolves this through careful sequencing (using opening, not closing, balances for interest) rather than relying on iterative calculation switches, so it opens and recalculates cleanly.
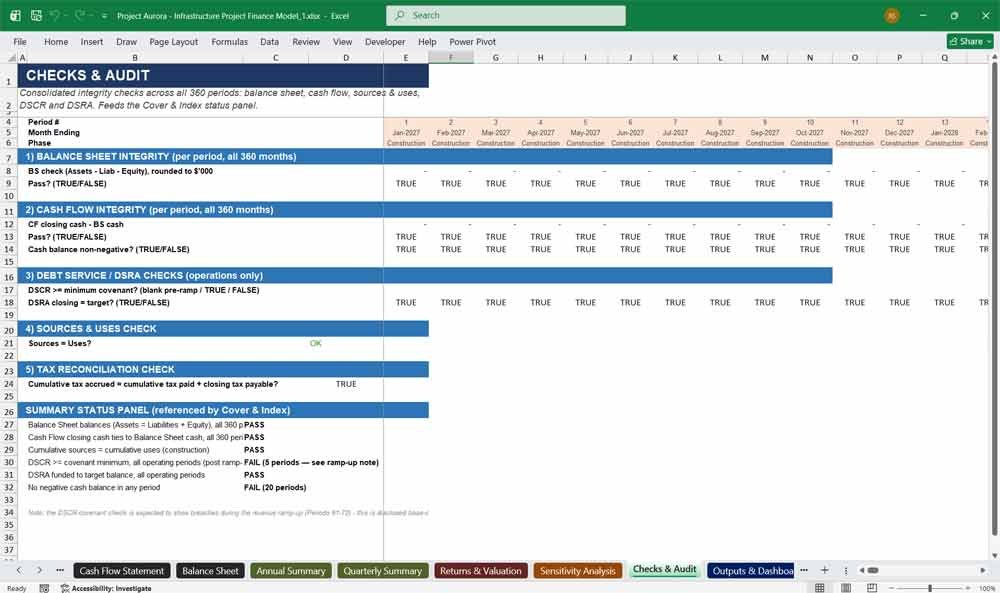
A dedicated audit tab tests the balance sheet, cash flow, sources and uses, and debt covenants across all 360 periods, and surfaces the results as a simple pass/fail panel on the cover page.
The workbook is colour-coded throughout (blue text on yellow fill for hard-coded inputs, black for formulas, green for links to other tabs) so that anyone opening it for the first time can immediately tell what’s safe to edit and what isn’t.
Infrastructure Project Tab By Tab Guide
Cover & Index
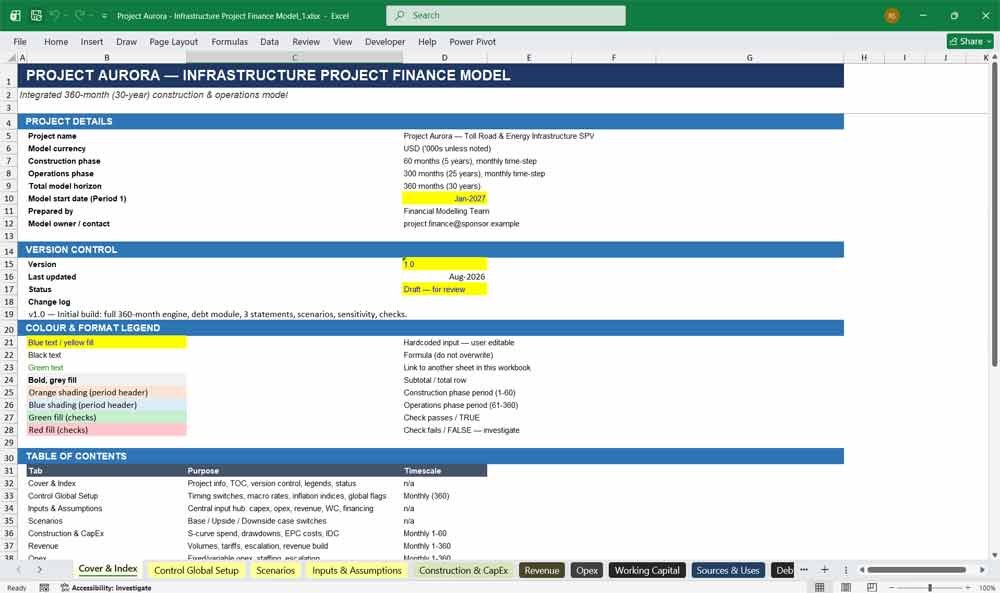
The front door to the model. This tab holds the project summary, a version log, a colour-coding legend, and a full table of contents linking out to every other tab.
Project details: name, currency, phase lengths, model start date.
Version control block for tracking revisions over the model’s life
A colour/formatting legend explaining the blue-input / black-formula / green-link convention
A live status panel that pulls pass/fail results straight from the Checks & Audit tab, so model health is visible without opening a single formula
Control Global Setup
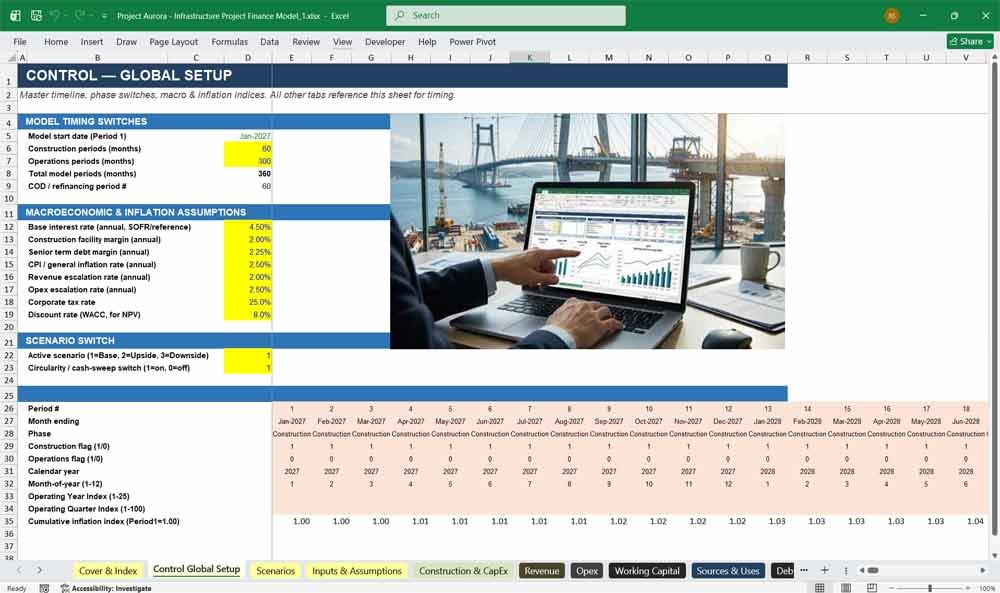
The master clock for the entire model. Every other tab reads its timing from here, which is what keeps 360 months of formulas in perfect sync.
A single timeline row marking Period 1 through 360, with construction (1–60) and operations (61–360) flagged automatically
Calendar dates, calendar year, and month-of-year for every period, generated from one start-date input
Operating year (1–25) and operating quarter (1–100) indices, used by the annual and quarterly roll-up tabs
Macro assumptions in one place: base interest rate, inflation, tax rate, and discount rate
A cumulative inflation index and a scenario switch (Base / Upside / Downside) that cascades through the rest of the model
Project Scenarios
The control panel for stress-testing the whole project without touching a single downstream formula.
Base, Upside, and Downside columns for the key swing factors: CapEx overrun, construction delay, price/volume shocks, opex movement, interest rate shock, and inflation shock
An “Active” column, driven by the Control tab’s scenario switch, that every other tab reads from automatically
- Designed so Sensitivity Analysis shocks stack on top of the active scenario, rather than requiring a separate set of assumptions
- Opex drivers: staffing, insurance, maintenance, and variable costs as a percentage of revenue
- Working capital terms: debtor days, creditor days, minimum cash balance
- Full capital structure terms: construction gearing, the senior/mezzanine split, margins, tenors, target and covenant DSCRs for each tranche, DSRA sizing, and the mezzanine PIK toggle
Construction & CapEx
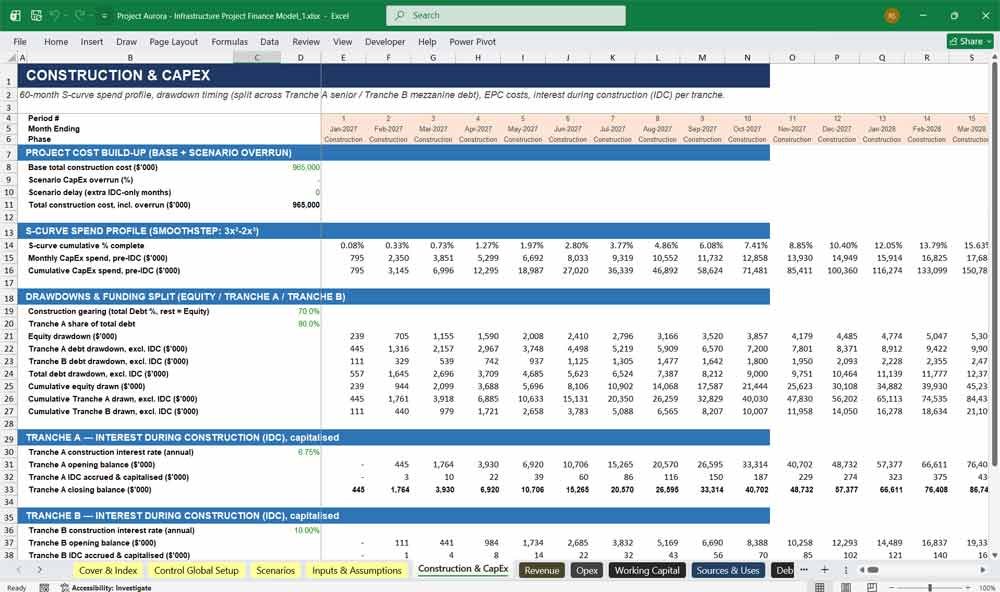
Models the five-year build: how money is spent, month by month, and how it’s funded.
- A smoothstep S-curve spend profile (with an adjustable shape parameter) spreading the total budget realistically across 60 months, rather than a flat straight-line draw
- Monthly and cumulative spend, both before and after interest capitalisation
- Drawdowns split three ways — sponsor equity, Tranche A debt, and Tranche B debt — according to the target gearing and tranche mix
- Separate interest-during-construction (IDC) calculations for each debt tranche, capitalised monthly onto both the debt balance and the asset cost
- Scenario-linked overrun and delay inputs feed straight into the total cost and IDC calculations
Infrastructure Project Inputs
Inputs & Assumptions
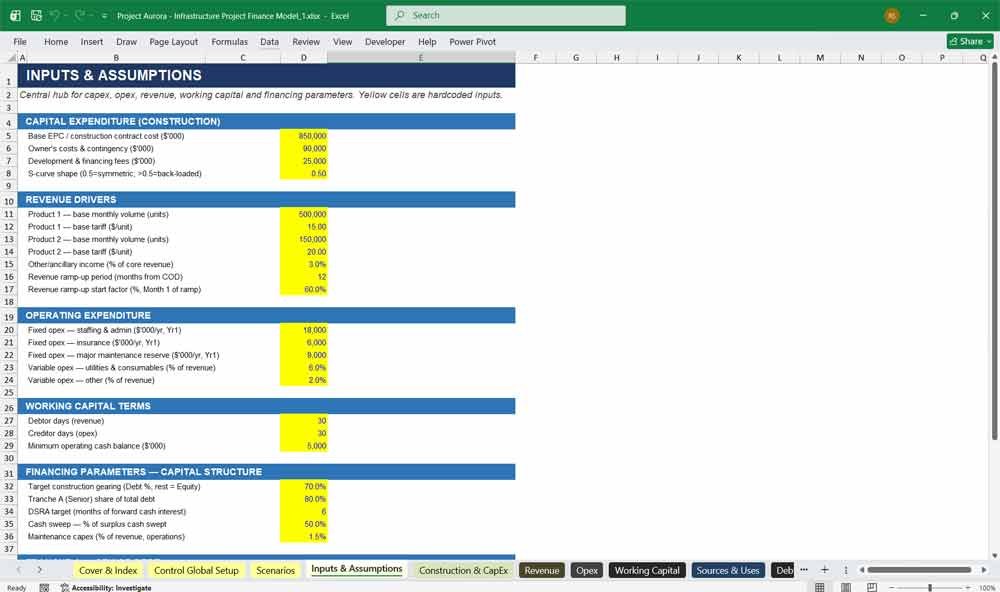
The single source of truth for every hard-coded number in the model — deliberately centralised so nothing is buried inside a formula on some other tab.
Construction costs: base EPC contract value, owner’s costs, contingency, and financing fees
Revenue drivers: volumes and tariffs for two products, plus ancillary income and a ramp-up profile
- Opex drivers: staffing, insurance, maintenance, and variable costs as a percentage of revenue
Revenue
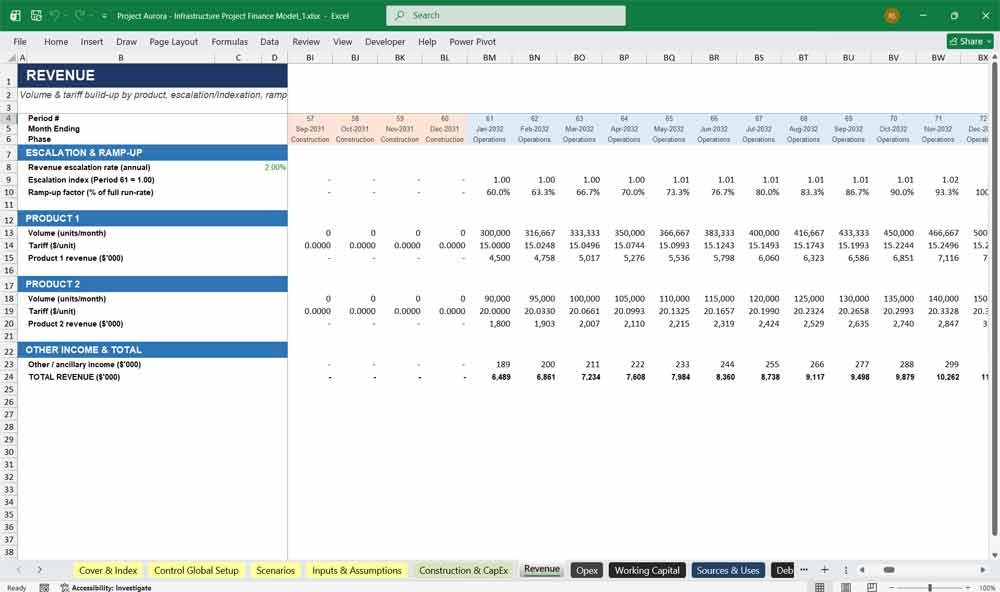
Builds monthly revenue from the ground up for the 25-year operating period, rather than assuming a flat run rate.
- Two products, each with its own volume and tariff, escalated monthly off the Control tab’s inflation index
- A ramp-up curve so revenue starts below full run-rate in the first year of operations and builds up gradually — a standard feature of newly-opened infrastructure assets
- Ancillary/other income calculated as a percentage of core revenue
- Scenario-driven price and volume adjustments layered on top of the base assumptions
Opex
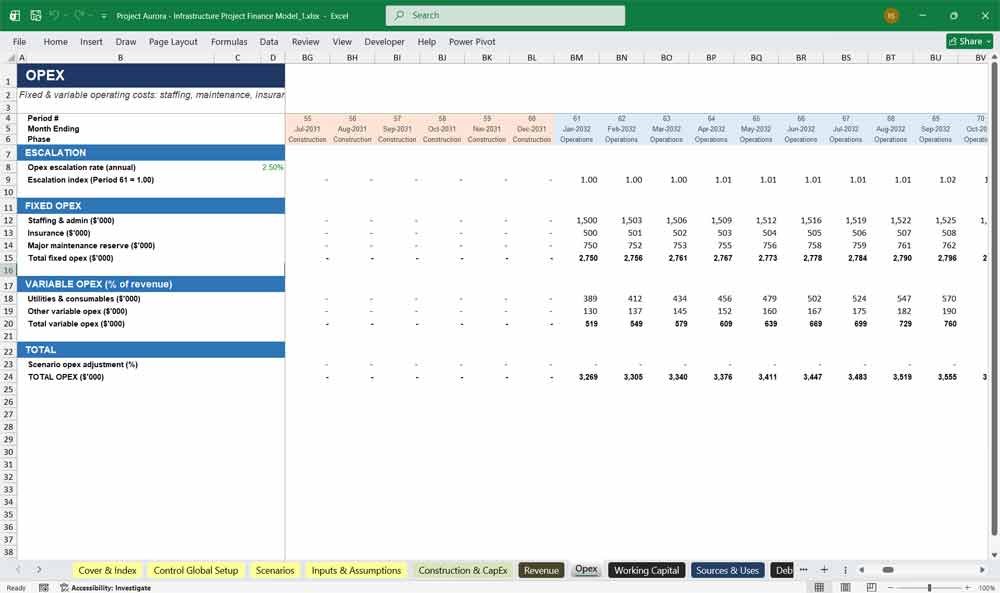
The mirror image of the Revenue tab: fixed and variable operating costs, fully escalated.
- Fixed costs — staffing, insurance, major maintenance reserve — escalated monthly
- Variable costs — utilities, consumables, and other — calculated as a percentage of revenue, so they scale automatically with the ramp-up
- A scenario adjustment layer, consistent with the mechanism used on the Revenue tab
Working Capital
A dedicated schedule for trade receivables and payables, so the model reflects the timing gap between accrual accounting and actual cash collection.
- Trade receivables sized off monthly revenue and the debtor-days assumption
- Trade payables sized off monthly opex and the creditor-days assumption
- A net working capital movement line — the actual cash impact of that timing gap — which feeds directly into both the debt module’s cash available for debt service and the Cash Flow Statement
Sources & Uses
The financing summary at financial close: how much the project costs to build, and where that money comes from.
- Uses: total construction cost including capitalised interest, plus an estimated initial funding requirement for the debt reserve account
- Sources: Tranche A senior debt, Tranche B mezzanine debt, and sponsor equity (split between construction funding and reserve-account funding)
- A live sources-equals-uses check, plus the resulting implied gearing and tranche split, so the capital structure can be sanity-checked in one place
Infrastructure Project Model Cash Debt Tranche
Debt & Financing
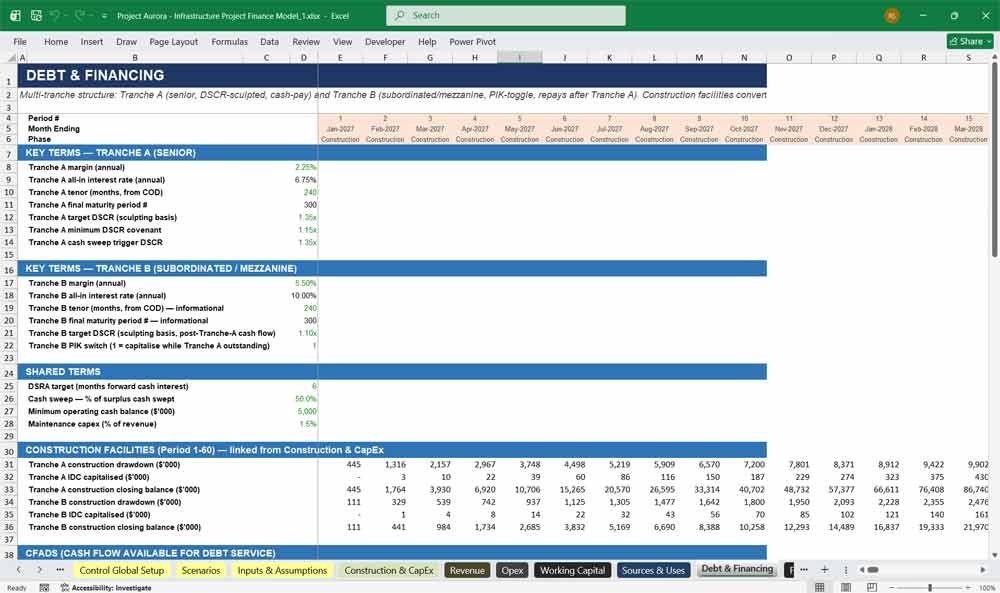
The largest and most detailed module in the model — a full multi-tranche debt waterfall running across all 360 periods.
Tranche A (senior): first-priority, cash-pay, amortised on a debt-service-coverage “sculpted” basis — principal is set each month to hit a target DSCR, rather than following a fixed schedule
Tranche B (mezzanine): second-priority, with a toggle for interest to either accrue in cash or capitalise (PIK) while Tranche A is still outstanding; automatically converts to cash-pay and begins amortising once Tranche A is fully repaid to bridge Enterprise Value (EV) to Equity Value (Purchase Price for equity).
A full CFADS (cash flow available for debt service) build: EBITDA less cash tax, maintenance capex, and the working-capital movement
- A debt service reserve account (DSRA) that sizes itself to forward cash interest requirements and funds or releases automatically
- A cash sweep mechanism that can accelerate repayment of either tranche when cash flow outperforms target
- Both a Tranche A (covenant) DSCR and a blended, all-tranche DSCR, reported monthly
- Explicit “residual balance at maturity” checks for each tranche, so any refinancing risk at legal maturity is visible rather than assumed away
Fixed Assets
The infrastructure project asset register: what the project owns, and how it depreciates over its operating life.
Construction costs capitalised into work-in-progress month by month as they’re incurred, not held back to a single COD entry
Maintenance capex during operations also capitalised, rather than expensed
Straight-line depreciation over the 25-year operating life, with opening/closing gross value, accumulated depreciation, and net book value tracked monthly
Tax & Depreciation
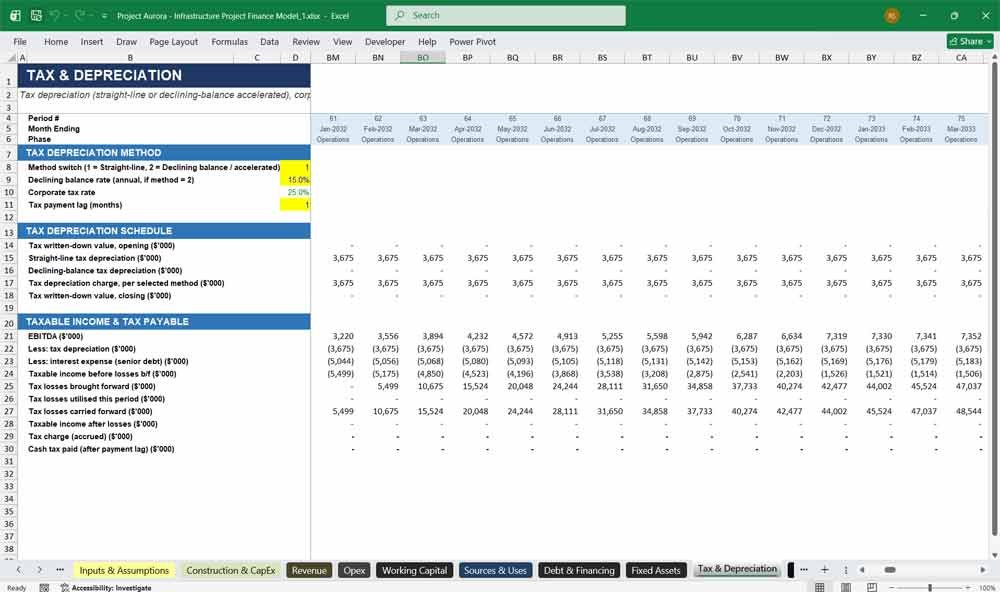
Corporate tax, calculated properly rather than as a flat percentage of profit.
A tax depreciation schedule with a switch between straight-line and declining-balance (accelerated) methods
Tax losses carried forward and automatically utilised against future taxable income
A cash tax payment schedule with an adjustable payment lag, so the timing difference between accrued and paid tax flows correctly into the balance sheet and cash flow
Income Statement
A conventional monthly P&L, built entirely from links to the operating and financing tabs..
Revenue through to EBITDA, depreciation, EBIT, interest expense (split by tranche), tax, and net income
Zero activity during construction, with interest during that phase capitalised rather than expensed — consistent with the Construction & CapEx and Fixed Assets tabs
Balance Sheet
A full monthly balance sheet that is verified, not assumed, to balance.
Assets: cash, the restricted DSRA balance, trade receivables, and net fixed assets
Liabilities: construction-phase debt, Tranche A and Tranche B balances during operations, trade payables, and accrued tax payable
Equity: cumulative share capital and retained earnings.
- A live balance check on every single period — confirmed to hold to the cent across all 360 months
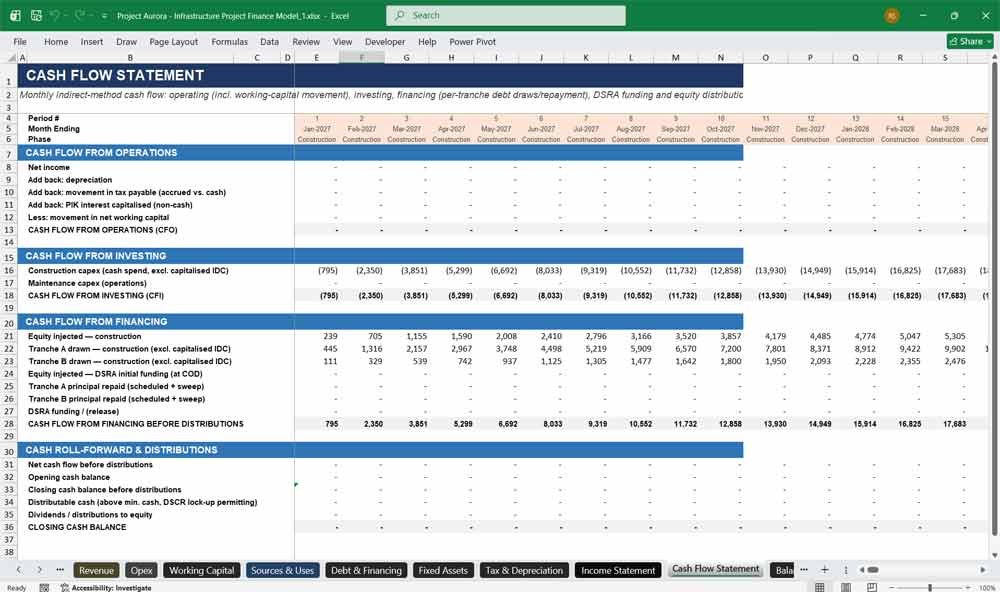
Cash Flow Statement
An indirect-method cash flow statement connecting the P&L to the balance sheet.
Operating cash flow, including add-backs for depreciation, non-cash PIK interest, and the working-capital movement
Investing cash flow: construction capex and operating-phase maintenance capex
Financing cash flow: equity injections, per-tranche debt drawdowns and repayments, and DSRA funding movements
- A distribution mechanism that only pays dividends when cash is above the minimum threshold and the senior DSCR covenant is met — modelling a realistic lender lock-up
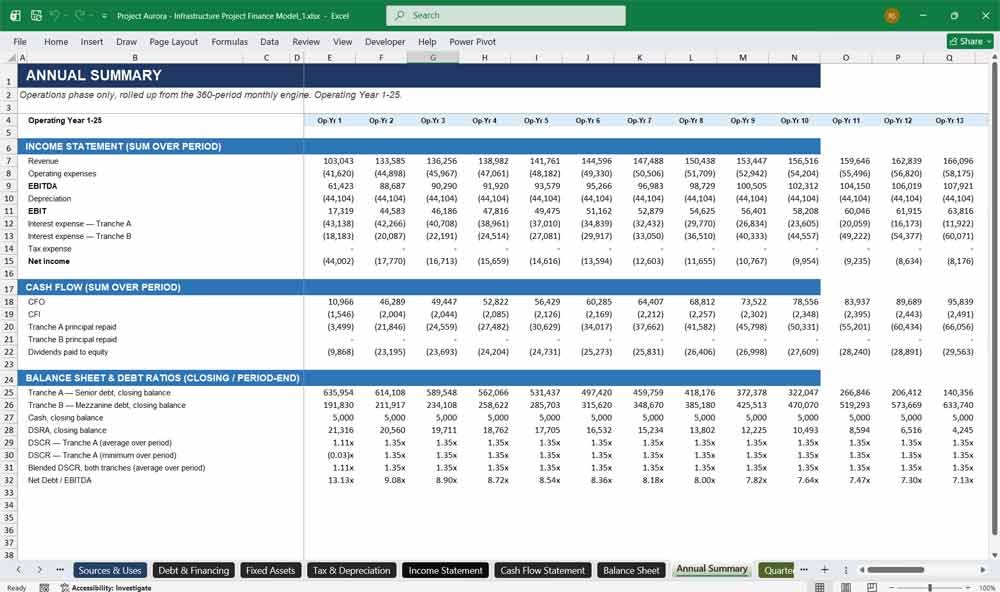
Annual Summary
The operating phase (Periods 61–360) rolled up into 25 annual columns — the view most people actually want to read.
Full income statement and cash flow summaries by operating year
Year-end debt balances for each tranche, cash, and DSRA
Average and minimum DSCR by year, for both the senior covenant basis and the blended, all-tranche basis
- Net Debt / EBITDA by year
Quarterly Summary
The same rollup logic as the Annual Summary, but at quarterly granularity (100 quarters across the 25-year operating life) — a middle ground between the monthly engine and the annual view.
Returns & Valuation Refinancing
The tab where the model answers the question every investor and lender actually asks: is this worth doing?
Project and equity cash flows built from the underlying monthly engine, using actual calendar dates
Project IRR and Equity IRR, calculated with XIRR so they reflect true dated cash flows rather than an assumed even period length
- Project and Equity NPV at the model’s discount rate
- Equity payback period, peak debt (combined and Tranche A only), and minimum/average DSCR over the operating life
Sensitivity Analysis
A live stress-testing panel, not a static table of pre-computed scenarios.
Adjustable shocks for CapEx overrun, price, volume, opex, and interest rates, which feed directly into the Scenario mechanism and recalculate the entire model in real time
A results panel showing the resulting IRR, NPV, and minimum DSCR immediately after any shock is applied
A suggested set of one-at-a-time stress tests for a structured downside/upside review
Infrastructure Project Model Final Valuation Checks
Outputs & Dashboard
A one-page summary for anyone who doesn’t want to dig through the model — investors, lenders, or a steering committee.
Headline KPI tiles: Project and Equity IRR, NPV, payback, peak debt, gearing, and DSCR
An overall model-status indicator pulling from Checks & Audit
Charts showing annual revenue versus EBITDA, DSCR against covenant over time, and the debt/cash/DSRA balances across the operating life
Checks & Audit
Quantifies the financial reward generated for the private equity sponsor and management team over the investment lifecycle.
Balance sheet balance-check across all 360 periods
Cash flow-to-balance-sheet cash reconciliation
Sources-equals-uses confirmation
DSCR covenant compliance testing
SRA funding-to-target verification
A tax reconciliation between accrued and cash tax
- A summary pass/fail panel, feeding directly into the Cover & Index status display, so model integrity is one glance away at all times
Why Buy This Model
Most project finance templates on the market give you a rough shell: a few tabs, a single flat interest rate, and a debt schedule that assumes the world never gets complicated. Project Aurora is built the way an actual lender or infrastructure investor would expect to see a model, because it’s built to survive the questions they’ll ask. The construction and operating phases run on one continuous 360-month engine rather than two disconnected sketches stitched together, so a change to the construction timeline or a tariff assumption flows automatically through revenue, debt, tax, and all three financial statements — you’re never left manually patching formulas after every input change.
The debt module is a genuine two-tranche structure with sculpted senior amortisation and a PIK-toggle mezzanine tranche, not a single placeholder loan, so it’s ready to represent how these deals are actually financed. Every number that matters — the balance sheet, the cash flow, the sources and uses, the debt covenants — is tested against itself automatically across all 360 periods and reported on a pass/fail dashboard, so you’re not left hunting for the one broken formula three tabs deep. And because it’s fully unlocked and colour-coded, you can see exactly how every output is built and adapt it to your own deal without reverse-engineering a black box.
Whether you’re prepping a lender package, underwriting an acquisition, or teaching project finance mechanics, this model saves the weeks of build time it would take to get a template this complete right, and gives you a structure that already thinks the way the industry does.
Major Infrastructure Project Frequently Asked Questions
Is this a “black box” model, or can I actually see and change the formulas?
Every cell is fully unlocked and visible — there’s no hidden VBA, no protected sheets, and no compiled logic. Inputs are colour-coded blue-on-yellow, formulas are black, and cross-tab links are green, so you can trace any number back to its source in seconds and change any assumption directly.
Do I need to be an experienced financial modeller to use this?
No. The Inputs & Assumptions and Scenarios tabs are designed as the only place most users need to touch — change a tariff, a construction cost, or an interest rate there and the rest of the model updates itself. That said, if you do want to dig into the mechanics, everything is documented and structured logically enough to follow.
Can I change the capital structure — different gearing, a single lender instead of two tranches, different tenors?
Yes. Gearing, the senior/mezzanine split, margins, tenors, target DSCRs, and the mezzanine PIK toggle are all input cells. If you only need a single-tranche structure, you can set Tranche B’s share to zero and it drops out of the waterfall cleanly.
What happens if I change the construction period or operating life?
The model is currently built for a 5-year construction phase and a 25-year operating life (360 months total). Because the entire engine is timeline-driven from one Control tab, resizing it is a structural change rather than a single input tweak — but the architecture (S-curve construction spend, sculpted debt, monthly-to-annual rollups) is designed to be re-pointed at a different horizon by someone comfortable extending the column ranges, or as a scoped customisation.
How do I know the model isn’t broken somewhere in 360 months of formulas?
The Checks & Audit tab exists for exactly this reason. It independently re-tests the balance sheet, the cash flow, sources vs. uses, DSCR covenants, and the debt reserve account across every single period, and rolls the results into a pass/fail summary on the cover page. You don’t have to take the model’s outputs on faith — you can verify them.
Can this be adapted to a different asset type, like real estate, renewables, or data centers?
Yes — the underlying engine (timeline, multi-tranche debt, tax, three statements, checks) is generic project-finance architecture. The revenue and cost tabs are the parts that would be rebuilt for a different asset class, since a toll road, a solar farm, and a data center all earn revenue in fundamentally different ways.
Does it include scenario and sensitivity analysis, or just a single base case?
Both. The Scenarios tab has Base/Upside/Downside cases built in, and the Sensitivity Analysis tab lets you apply live, one-at-a-time stress shocks (CapEx overrun, price, volume, opex, rates) that flow straight through the real engine — not an approximated tornado chart.
Is this “lender-ready,” or just an internal planning tool?
It’s built to the structure lenders expect: a standalone debt module with covenant testing and a debt reserve account, sculpted (not flat) amortisation, and an audit trail across every period. It won’t replace your lender’s own model, but it’s built in the same language theirs will be.
Does it use circular references or need iterative calculation turned on?
No. Interest is calculated off each period’s opening (prior period’s closing) balance rather than its own closing balance, which avoids the classic interest/tax circularity without needing Excel’s iterative calculation setting — so the file opens and recalculates cleanly every time.
Final Notes on the 30 Year Financial Model
This infrastructure project model helps investors have a broad market spectrum, offering the right balance between cost, and investment support.
Further Reading
Construction Company: Easily track Deposits and Milestone Payments in color-coded tabs and cells on multiple projects.
- Heavy Equipment Manufacturer Financial Model: Up to 80 product lines, and a 6 tier subscription “Equipment as a Service” (EaaS) Model add-on.