
Ag & Forestry Equipment Manufacturing Model Template
Plan, finance and value an agricultural and forestry equipment manufacturer with a fully integrated Excel financial model built specifically for heavy machinery OEMs. This agricultural equipment financial model covers tractors, combine harvesters, sprayers, planters, tillage equipment, skidders, forwarders, feller bunchers, harvesting heads, implements and attachments, replacement parts and service revenue. Every forecast is driven by units, selling prices and production capacity, giving you an investor-ready, bank-ready model in minutes.
Financial Model for an Ag & Forestry Equipment Manufacturer
The model combines 3 years of monthly historical financials with a 5-year monthly forecast and annual roll-up columns, linked across a full three-statement structure: income statement, balance sheet and cash flow statement. Production planning, bill-of-materials costing, headcount, working capital, capex, debt schedules and covenant testing all flow automatically. Change one start date on the Control Panel and every date, year header and timeline across the workbook updates instantly.
Built for founders, CFOs, private equity investors, lenders, M&A advisors and consultants, this machinery manufacturing financial model includes a DCF valuation, trading comparables, scenario analysis (Base, Upside, Downside), eight sensitivity tables and a KPI dashboard with charts. With around 59,000 live formulas, colour-coded inputs and built-in integrity checks, it is a professional Excel template for budgeting, fundraising, debt financing and acquisitions.
What’s Inside: Tab-by-Tab Overview
01. Cover & Index
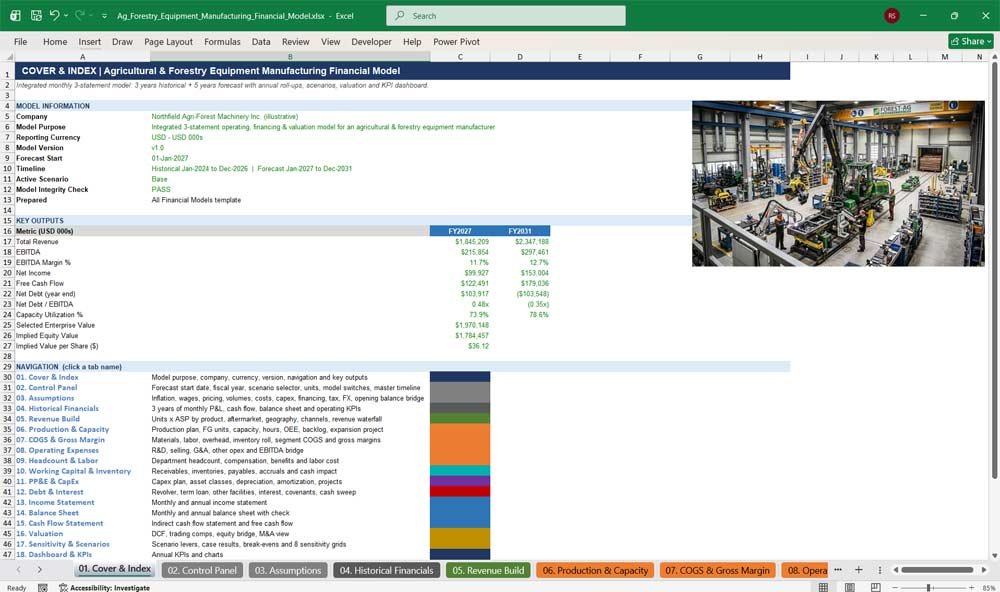
The Cover & Index tab gives an instant executive summary of your agricultural equipment business plan. It shows the company name, model purpose, reporting currency, version, timeline and active scenario, alongside headline outputs for the first and final forecast years. One-click navigation links take users straight to every tab.
- Key outputs: revenue, EBITDA, margin, net income, free cash flow and net debt
- Selected enterprise value, equity value and value per share
- Clickable navigation to all tabs, with descriptions
- Live model integrity status (PASS / REVIEW)
- Colour legend explaining inputs, formulas and links
02. Control Panel
The Control Panel is the command centre of this financial model template. Set the forecast start date once and every date in the workbook re-dates automatically. Choose your scenario, toggle key model switches and select dashboard display units, all from one clean input sheet designed for fast “what-if” analysis.
- Single forecast start date drives the entire model timeline
- Scenario selector: Base, Upside or Downside
- On/off switches: capacity expansion, revolver, cash sweep, dividends
- Fiscal year end, reporting currency and units
- Master timeline that feeds every tab
Ag & Forestry Equipment Manufacturing Revenues & Production
03. Assumptions
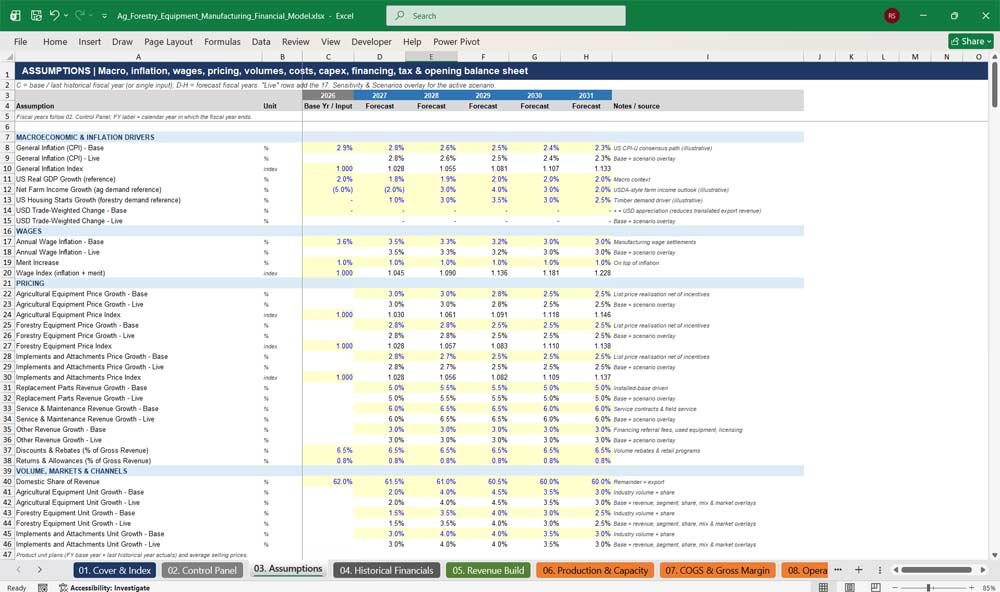
The Assumptions tab holds every forecast driver in one place, organised by forecast year. It covers inflation, wage growth, pricing, volumes, raw material and steel costs, FX, interest rates and tax, plus capex, working capital and headcount drivers. Live rows automatically apply the selected scenario overlay to base assumptions.
- Macro drivers: CPI inflation, GDP, farm income, housing starts, USD/FX
- Price growth and unit growth by segment, with product ASPs
- Steel, component, raw material and freight cost indices
- Financing terms, interest rate curve, covenants and tax rate
- Opening balance sheet bridge and monthly seasonality profile
04. Historical Financials
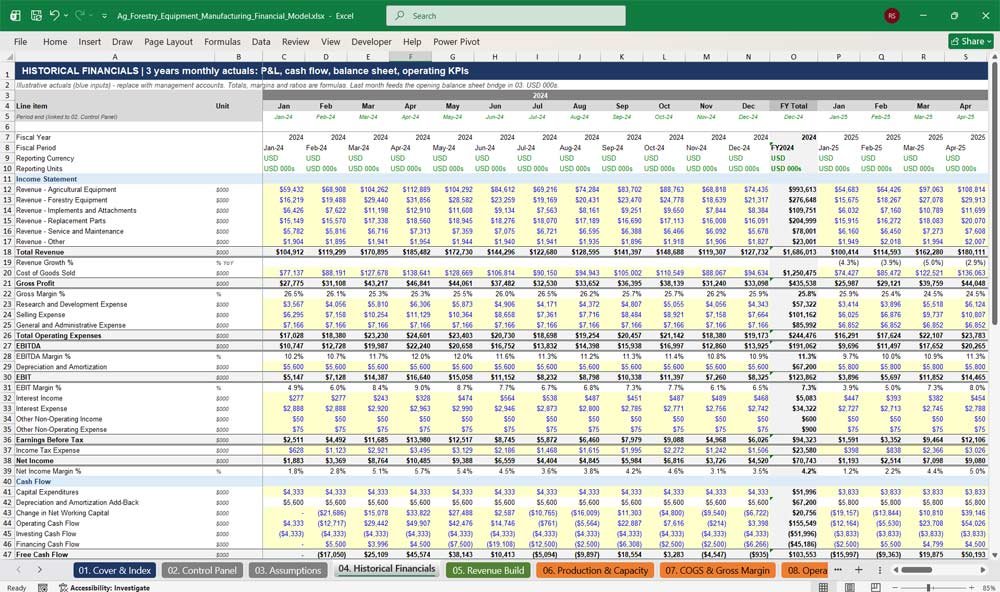
The Historical Financials tab captures three years of monthly actuals for your farm machinery business. It records revenue by segment, profit and loss, cash flow, balance sheet and operating KPIs, with totals, margins and ratios calculated by formula. The final historical month automatically becomes the opening balance sheet for the forecast.
- 36 months of P&L, cash flow and balance sheet data
- Revenue split across six product and aftermarket lines
- Gross margin, EBITDA margin and net margin
- Inventory turns, DIO, DSO, DPO, ROIC, ROA and ROE
- Built-in historical balance sheet check
05. Revenue Build
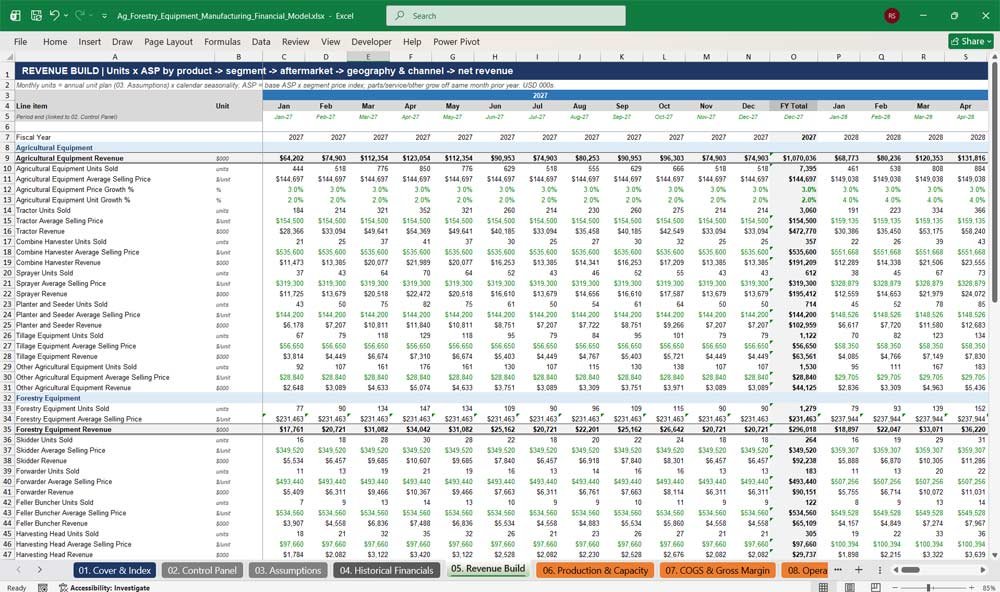
The Revenue Build tab forecasts sales from the ground up using units sold multiplied by average selling price for each of 12 equipment products. It adds replacement parts, service and maintenance revenue, then analyses geography, sales channels and the gross-to-net revenue waterfall for a complete equipment revenue model.
- Unit and ASP forecasts for tractors, combines, sprayers, skidders, forwarders and more
- Monthly seasonality reflecting agricultural buying cycles
- Domestic versus export revenue and growth
- Dealer, OEM, direct and e-commerce channel sales
- Discounts, rebates, returns and net revenue
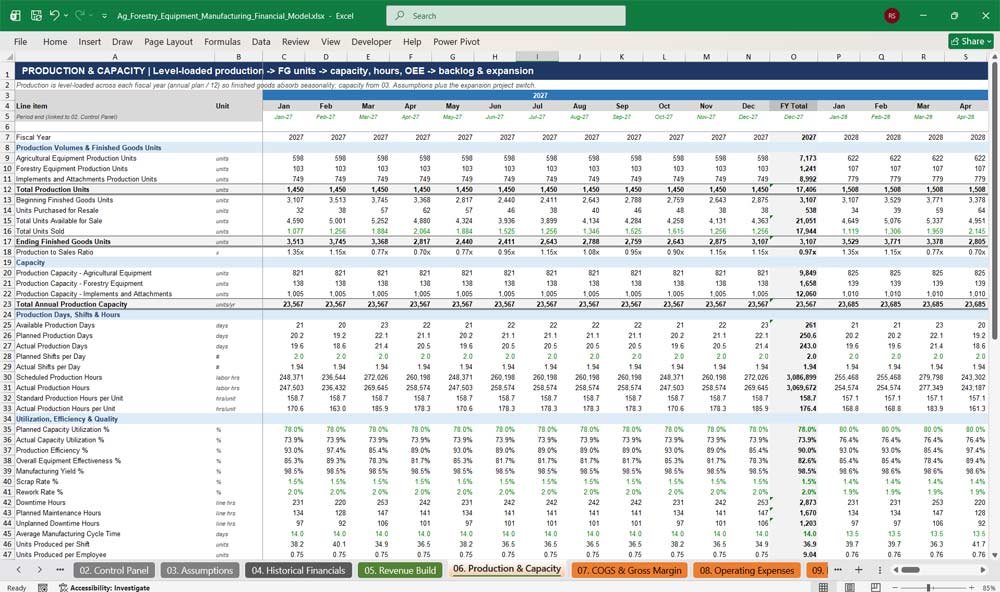
06. Production & Capacity
The Production & Capacity tab models manufacturing operations in detail. Level-loaded production builds finished goods inventory ahead of peak season, while capacity, shifts, labour hours, OEE and bottleneck analysis show how hard the factory is working. A switchable capacity expansion project models new plant investment and commissioning.
- Production units by segment and finished goods unit roll-forward
- Capacity utilisation, production efficiency and OEE
- Downtime, scrap, rework and cycle time
- Order backlog, book-to-bill and outsourcing to subcontractors
- Capacity expansion investment and commissioning timeline
07. COGS & Gross Margin
The COGS & Gross Margin tab builds manufacturing cost from bill-of-materials ratios, direct labour and factory overhead. Costs flow through work-in-process and finished goods inventory before reaching cost of goods sold, giving accurate gross margins by segment for agricultural equipment, forestry equipment, implements and aftermarket, updated every month.
- Steel, aluminium, engines, hydraulics, electronics, tyres and cab components
- Direct labour, overtime and temporary labour
- Factory overhead, utilities, maintenance and quality control
- Warranty, freight, tariffs, scrap and manufacturing variances
- Gross profit and gross margin by segment
08. Operating Expenses
The Operating Expenses tab forecasts research and development, selling, and general and administrative costs. Labour costs link from headcount, while other costs follow revenue-based drivers or inflation-adjusted budgets. A full EBITDA bridge, planned cost-savings programme and opex ratios make this an ideal SG&A budgeting tool for equipment manufacturers.
- R&D, engineering, prototyping, testing and certification
- Sales commissions, dealer incentives, marketing and trade shows
- Finance, HR, IT, legal, audit, insurance and corporate overhead
- Restructuring, warranty administration and environmental compliance
- EBITDA, EBITDA margin and planned cost savings
09. Headcount & Labor
The Headcount & Labor tab plans your workforce by department. Direct production headcount is sized automatically from standard labour hours and target efficiency, while indirect and support teams scale with growth. Salaries, bonuses, payroll taxes, benefits, overtime and severance combine into a complete manufacturing labour cost forecast.
- Headcount across 22 departments, from assembly and welding to executive management
- New hires, departures, attrition and forced reductions
- Average salaries, wage inflation, merit increases and bonuses
- Health insurance, retirement, pension and workers’ compensation
- Revenue per employee and labour cost as % of revenue
10. Working Capital & Inventory
The Working Capital & Inventory tab manages the cash tied up in receivables, inventories and payables. It tracks raw materials, work-in-process, finished goods and replacement parts inventory, plus accruals, customer deposits and warranty provisions, calculating the monthly cash impact of every working capital movement across the seasonal cycle.
- Days sales outstanding, days inventory outstanding and days payable outstanding
- Inventory turns, obsolescence reserve and write-downs
- Cash conversion cycle and seasonal inventory build
- Dealer inventory and dealer receivable exposure
- Change in net working capital for the cash flow statement
Ag & Forestry Equipment Manufacturing Financial Statements
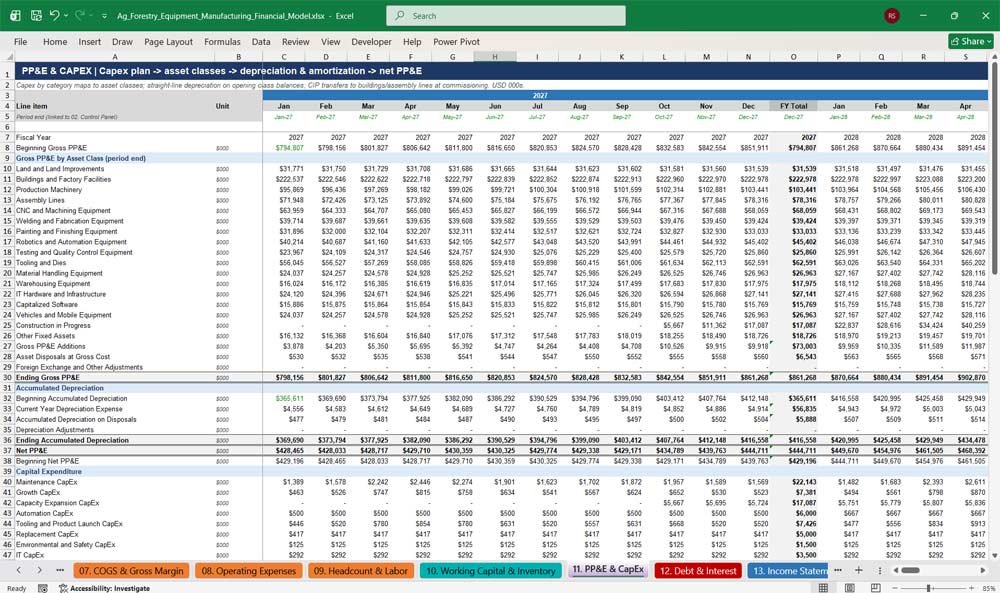
11. PP&E & CapEx
The PP&E & CapEx tab plans capital investment across 17 fixed asset classes, from buildings and assembly lines to robotics, tooling and IT. Straight-line depreciation, intangible amortisation, asset disposals and construction-in-progress transfers are calculated automatically, giving a reliable fixed asset register and capex budget for your manufacturing plant.
- Maintenance, growth, automation, tooling and capacity expansion capex
- Gross PP&E, accumulated depreciation and net PP&E roll-forward
- Depreciation by asset group with editable useful lives
- Capitalised interest and capitalised development costs
- Disposal gains and net PP&E integrity check
12. Debt & Interest
The Debt & Interest tab models a full capital structure: revolving credit facility, term loan, equipment financing, finance leases and other debt. A revolver automatically draws and repays to maintain minimum cash, an optional cash sweep accelerates repayment, and covenant tests monitor leverage, interest coverage and liquidity every month.
- Five debt facilities with full roll-forwards
- Floating and fixed rates with floors, caps and credit spreads
- Commitment fees, issuance fees and fee amortisation
- Leverage, interest coverage and fixed charge coverage ratios
- Covenant headroom and cash sweep logic, with no circular references
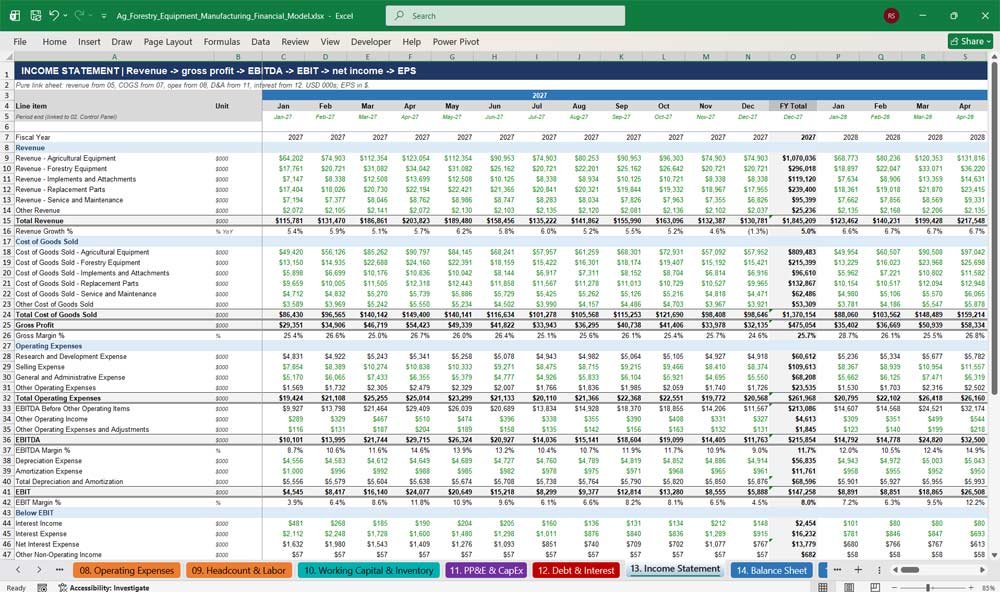
13. Income Statement
The Income Statement tab presents a monthly and annual profit and loss statement, from revenue by segment through gross profit, EBITDA and EBIT to net income. Earnings per share, adjusted EBITDA and cash conversion metrics make it ready for board packs, investor presentations and lender reporting.
- Revenue and cost of goods sold by segment
- Gross profit, EBITDA, EBIT and net income with margins
- Interest, other income and tax expense
- Basic and diluted EPS
- Adjusted EBITDA and income statement check
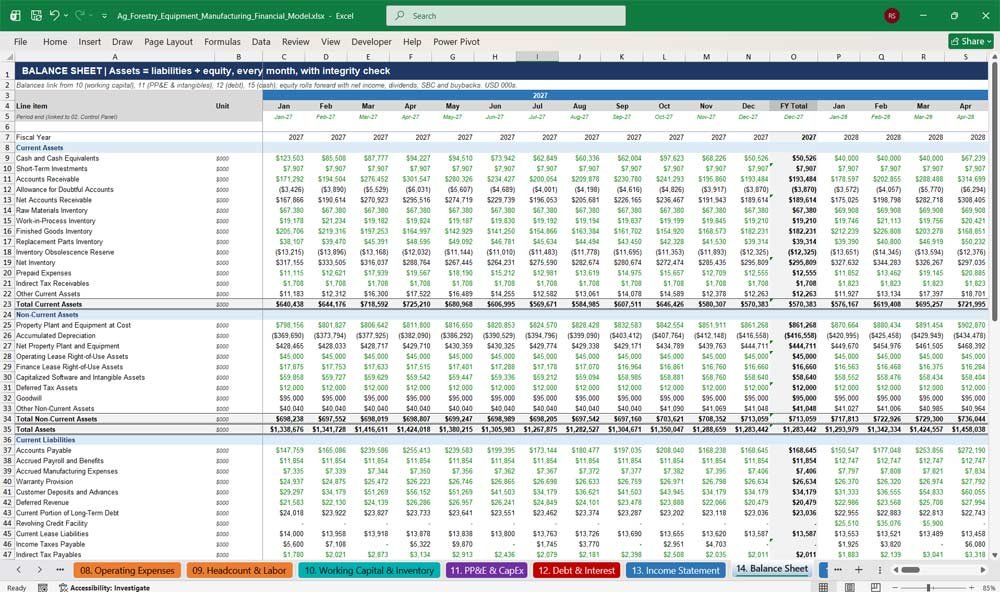
14. Balance Sheet
The Balance Sheet tab delivers a fully integrated monthly balance sheet that balances in every period. Assets, liabilities and equity link directly from the supporting schedules, while retained earnings, dividends, share buybacks and stock-based compensation roll forward automatically, with a visible balance check on every column.
- Detailed current and non-current assets
- Debt, leases, warranty, pension and tax liabilities
- Equity roll-forward including retained earnings and treasury stock
- Balance sheet check on every month
- Current ratio, quick ratio, debt-to-equity and net debt/EBITDA
15. Cash Flow Statement
The Cash Flow Statement tab uses the indirect method to reconcile net income to cash. Operating, investing and financing cash flows are captured in full, and free cash flow, unlevered free cash flow and levered free cash flow are calculated for valuation and debt capacity analysis.
- Operating cash flow with full working capital detail
- Capex, disposals, acquisitions and intangible investment
- Debt drawdowns, repayments, dividends and share buybacks
- Free cash flow, unlevered FCF and levered FCF
- Cash flow check against the debt schedule
Key Financial Metrics for an Ag & Forestry Equipment Manufacturer
16. Valuation
The Valuation tab values the business using a discounted cash flow (DCF) and trading comparables. A CAPM-based WACC, mid-year discounting and Gordon growth terminal value produce the DCF, which is blended with EV/EBITDA, EV/Revenue and EV/EBIT multiples to reach an enterprise value, equity value and implied share price.
- DCF with WACC build-up and terminal value
- Trading comparables table with mean, median, high and low
- Weighted selected enterprise value and equity bridge
- Implied value per share and upside to current price
- Acquisition analysis and valuation range
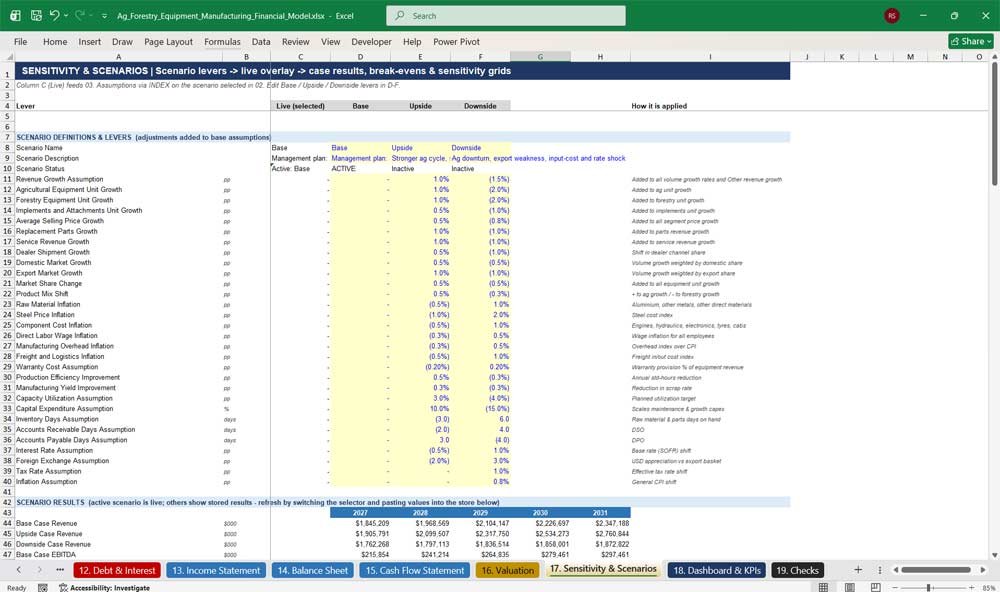
17. Sensitivity & Scenarios
The Sensitivity & Scenarios tab stress-tests the business with 30 adjustable levers across Base, Upside and Downside cases. Compare scenario results, review break-even metrics and explore eight sensitivity tables covering pricing, volume, costs, capacity, working capital, WACC, multiples and interest rates, so you can see which assumptions matter most.
- 30 scenario levers, from steel inflation to dealer shipments
- Revenue, EBITDA, free cash flow, net debt and valuation by scenario
- Break-even revenue growth, EBITDA margin and capacity utilisation
- Eight two-way sensitivity tables
- No macros or data tables required
18. Dashboard & KPIs
The Dashboard & KPIs tab summarises performance on one page for management and investors. Headline KPI cards, an annual KPI table covering actuals and forecast, and eight charts track revenue, EBITDA, margins, ROIC, cash conversion, leverage, capacity utilisation and inventory turns, ready to drop into board and investor presentations.
- Headline KPI cards for quick decision-making
- 8-year table of actual and forecast KPIs
- Eight charts, including revenue, EBITDA, margins and leverage
- Switch between USD thousands and millions
- Live model integrity indicator
19. Checks
The Checks tab gives buyers confidence that the model works. Eleven integrity tests run every month, covering balance sheet balancing, cash reconciliation, debt and PP&E roll-forwards and labour cost reconciliation. Separate business risk flags highlight negative cash, covenant breaches and liquidity shortfalls, so issues are spotted before you share the model.
- 11 automated integrity checks per period
- PASS / REVIEW status for every month
- Business risk flags for cash, covenants and liquidity
- Overall model status linked to the Cover and Dashboard
- Opening balance sheet and historical balance checks
Why Buy This Model?
Building a credible agricultural and forestry equipment manufacturing financial model from scratch can take weeks, and generic templates don’t capture the realities of machinery manufacturing: seasonal demand, dealer channels, bill-of-materials costing, capacity limits, warranty provisions and heavy capital investment. This model handles all of it in one integrated, fully linked Excel workbook. It is driven by units, prices and production rather than simple growth percentages, so your forecasts stay explainable to investors, lenders and acquirers. The balance sheet balances every month, the cash flow reconciles, and built-in checks prove it. You get monthly detail for operational planning, annual roll-ups for board reporting, a DCF and comparables valuation for fundraising or M&A, and scenario and sensitivity tools for stress testing. With professional formatting, colour-coded inputs and a single start date that re-dates the whole model, you can update it in minutes rather than days.
Ag & Forestry Equipment Frequently Asked Questions
Q: Who is this financial model designed for?
A: It is built for owners, CFOs and finance teams of agricultural, forestry and heavy equipment manufacturers, as well as private equity investors, lenders, M&A advisors, consultants and business students who need a detailed, industry-specific machinery manufacturing model.
Q: Can I use my own company’s data?
A: Yes. The historical data and assumptions are illustrative placeholders. Replace the blue input cells on the Historical Financials and Assumptions tabs with your own figures and the whole model updates automatically.
Q: How do I change the forecast start date?
A: Enter a new date in the Forecast Start Date cell on the Control Panel. Every date, month label, year header and fiscal-year roll-up across all tabs updates automatically.
Q: How long is the forecast period?
A: The model includes 3 years of monthly historical data and a 5-year monthly forecast, with annual roll-up columns for each year.
Q: Does the balance sheet balance?
A: Yes. The balance sheet balances in every month, and the Checks tab runs 11 integrity tests per period to confirm the balance sheet, cash flow and supporting schedules all reconcile.
Q: Does the model contain macros or circular references?
A: No. It uses standard Excel formulas only. Interest is calculated on opening balances, so there are no circular references and no macros to enable.
Q: Which version of Excel do I need?
A: The model is built for Microsoft Excel 2010 or later on Windows or Mac. It has not been tested in Google Sheets or Apple Numbers, so some formatting or charts may display differently there.
Q: Can I model products other than tractors and combines?
A: Yes. The Revenue Build includes 12 equipment products across agricultural equipment, forestry equipment and implements and attachments, plus replacement parts, service and other revenue. You can rename products and change unit volumes and prices to fit your own range.
Q: Does the model include a valuation?
A: Yes. The Valuation tab includes a DCF with a WACC build-up and terminal value, a trading comparables table, a weighted enterprise value, an equity bridge, implied value per share and an acquisition analysis.
Q: Can I run different scenarios?
A: Yes. Choose Base, Upside or Downside on the Control Panel. The Sensitivity & Scenarios tab lets you adjust 30 levers, including volumes, prices, steel and component inflation, wages, interest rates and working capital days.
Q: Can I use this model to raise finance or apply for a bank loan?
A: Yes. The integrated three-statement structure, debt schedule, covenant tests and cash flow forecasts are the outputs lenders and investors typically expect to see. It works as a strong starting point for funding applications and investor pitches.
Q: Can I switch off the capacity expansion project?
A: Yes. The Control Panel has on/off switches for the capacity expansion project, the revolving credit facility, the cash sweep and dividend payments.
Q: Is the model easy to understand if I’m not a financial modelling expert?
A: Yes. Inputs are colour-coded blue on yellow, formulas are black and cross-tab links are green. Every tab has a summary header and clear section labels, and the Cover tab includes clickable navigation.
Q: Can I edit the formulas and customise the layout?
A: Yes. The workbook is fully unlocked, so you can add products, change the structure or adapt it to your business.
Conclusion On The Financial Model
This Agricultural Farming Forestry Machinery Financial Model must focus on balancing capital expenditures with steady revenue growth from diversified product line sales, and subscription-based services. By optimizing operational costs, power efficiency, and maximizing high-margin services the model ensures sustainable profitability and cash flow stability.