
Electronics Manufacturer Financial Model Template
This Electronics Manufacturer Financial Model is a fully integrated Excel financial model built for electronics manufacturing businesses, contract manufacturers (EMS) and hardware companies. It combines three years of monthly historical financials with a five-year monthly forecast and annual roll-ups. It connects revenue, production, bill of materials (BOM), procurement, inventory, headcount, capex, working capital and debt into a linked three-statement model: income statement, balance sheet and cash flow statement. Whether you are raising capital, applying for bank finance, planning capacity or valuing an electronics business, the model gives you a professional, lender-ready forecast in a format investors recognise.
Financial Model for an Electronics Manufacturer
Unlike generic manufacturing templates, this electronics manufacturing financial model keeps the BOM and production schedule separate. You can model changes in component prices, semiconductor and PCB cost inflation, manufacturing yields, scrap rates and production volumes independently. Product-level bills of materials cover PCBs, microcontrollers, semiconductors, capacitors, resistors, connectors, displays, batteries, wiring, enclosures and packaging. Inventory flows from raw materials to work in progress to finished goods at weighted average cost. Capacity utilisation, downtime, planned maintenance and overtime drive realistic factory output, so your gross margin reflects how an electronics factory actually works.
The model is fully formula-driven and controlled from a single start date, so the entire timeline re-dates automatically. It includes a DCF valuation with WACC, live WACC and terminal growth sensitivity grids, operating sensitivities, base, upside and downside scenarios, debt covenants, an automatic revolving credit facility and a management dashboard with charts. Built-in integrity checks confirm the balance sheet balances and cash reconciles in every month. It uses a bank-standard colour code: blue inputs, black formulas and green links. This makes the model easy to audit, easy to adapt and ready to present to investors, lenders and acquirers.
What’s Inside: Tab-by-Tab Guide
01. Cover & Index
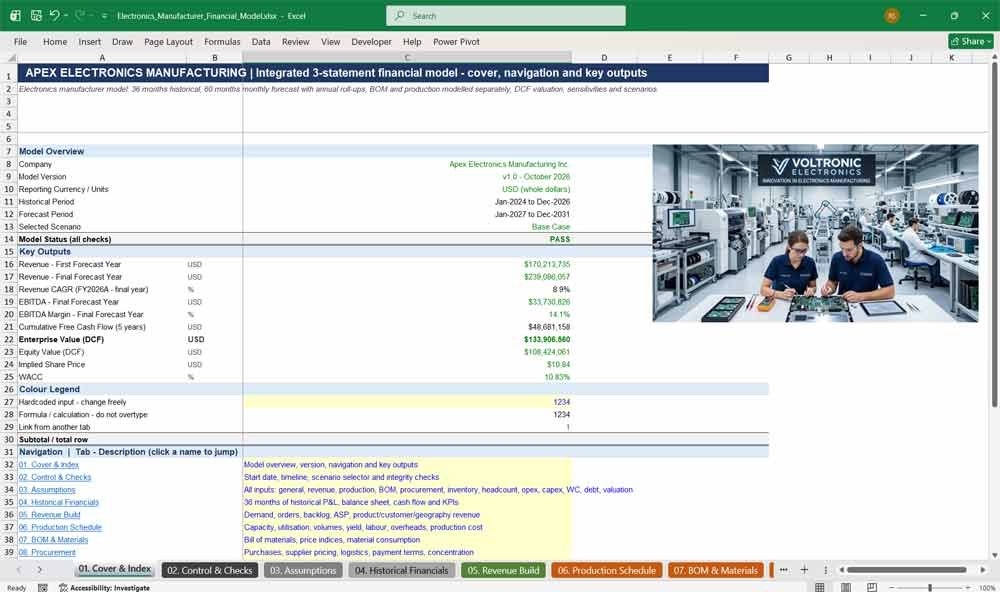
The Cover & Index tab is the front page of your electronics manufacturing financial model. It shows the company name, model version, forecast period, selected scenario and overall check status. It also summarises the key outputs: revenue, EBITDA, free cash flow and enterprise value. One-click navigation links take you to every tab.
- Model overview, version and reporting period
- Key financial and valuation outputs at a glance
- Clickable index of all 21 tabs
- Colour legend for inputs, formulas and links
02. Control & Checks
The Control & Checks tab is the model’s command centre. Change one start date and every date, header and calculation updates automatically across all tabs. Select base, upside or downside scenarios from a dropdown. Over twenty integrity checks confirm the balance sheet balances, cash reconciles and revenue ties out every month.
- Single model start date drives the whole timeline
- Scenario selector (Base / Upside / Downside)
- 20+ automated integrity checks with PASS / REVIEW flags
- Monthly timeline helpers for the forecast years
Electronics manufacturer Revenues
03. Assumptions
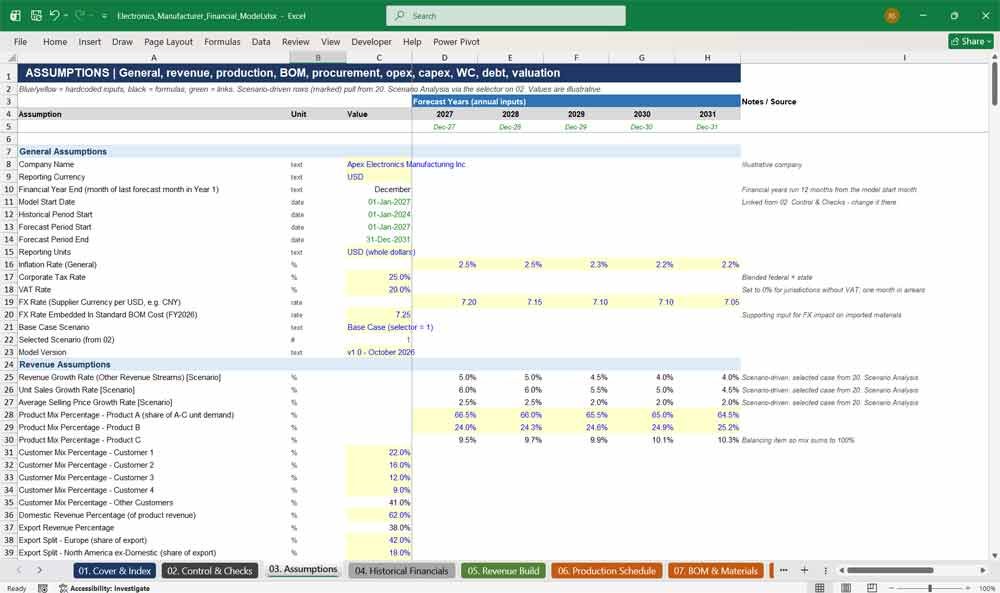
The Assumptions tab holds every input for the electronics manufacturer financial model in one organised place. Sections cover general, revenue, production, BOM and materials, procurement, inventory, headcount, operating expenses, capex, working capital, debt and valuation. Annual inputs vary by year, and scenario-driven assumptions update instantly from the scenario selector.
- 300+ clearly labelled inputs in blue on yellow
- Base bill of materials for three products
- Department headcount, salaries and opex bases
- Debt, WACC, terminal growth and exit multiple inputs
04. Historical Financials
The Historical Financials tab records 36 months of monthly actuals. It includes revenue by product, sales volumes, cost of goods sold, operating expenses, EBITDA, a full balance sheet, the cash flow statement and operational metrics. Closing December balances seed the forecast opening position, so history and projections connect seamlessly.
- 3 years of monthly P&L, balance sheet and cash flow
- Balance sheet and cash reconciliation checks
- Historical KPIs: yield, scrap, utilisation, inventory days
- Opening balances feed directly into the forecast
05. Revenue Build
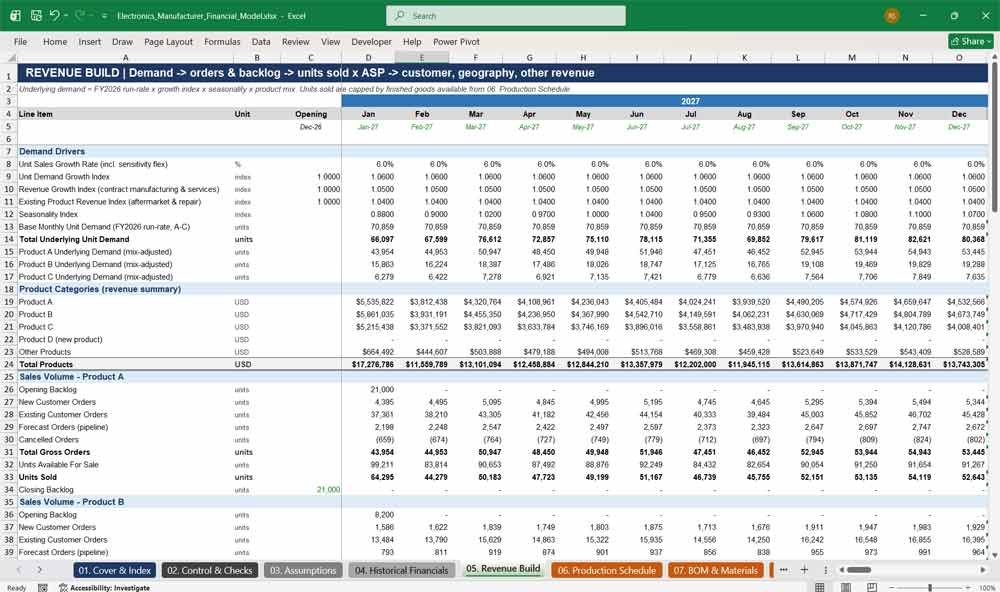
The Revenue Build tab forecasts sales bottom-up. Underlying demand flows into new, existing and pipeline orders, then cancellations, backlog and units sold, constrained by finished goods available. Average selling price escalation, product mix and a new product launch drive product revenue. This is supported by customer, geographic and service revenue analysis.
- Order book and backlog modelling for Products A, B and C
- ASP inflation applied each financial year
- Revenue by customer and by geography
- Contract manufacturing, engineering, aftermarket, repair and tooling revenue
06. Production Schedule
The Production Schedule tab models factory output. Capacity grows organically and through expansion capex. Achievable output reflects utilisation, downtime, planned maintenance and efficiency. Units required are matched to orders and finished goods targets, while yield, scrap and rework determine good units. Direct labour hours, overtime and manufacturing overheads produce a full production cost.
- Capacity, utilisation and production hours
- Product-level yield, scrap and rework units
- Direct labour hours, wage rates and overtime
- Manufacturing overheads and cost per good unit
07. BOM & Materials
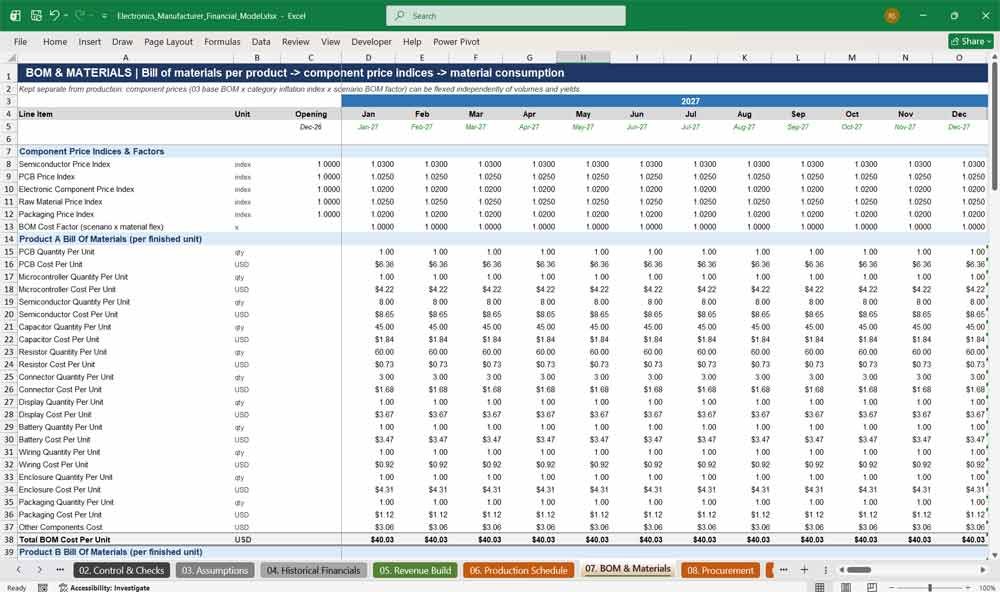
The BOM & Materials tab contains a detailed bill of materials for each product, kept separate from production. Component prices escalate using semiconductor, PCB, electronic component, raw material and packaging inflation indices. Material consumption is calculated on gross production, including waste, with a full material cost adjustment analysis.
- Per-unit BOM for PCB, MCU, semiconductors, passives, display, battery and more
- Five component price indices with scenario BOM factor
- Material consumption by product and by component
- Purchase price, usage, waste, scrap and substitution analysis
08. Procurement
The Procurement tab converts material requirements into purchase orders. It applies raw material inventory targets, safety stock and minimum order quantities. Supplier pricing walks standard cost to actual cost through inflation, FX, volume discounts, rebates and purchase price variance. Inbound logistics, payment terms and supplier concentration complete the picture.
- Purchase volumes with safety stock and MOQ
- Supplier pricing walk, including FX impact
- Freight, import duties, customs and warehousing
- Supplier payment terms and concentration risk
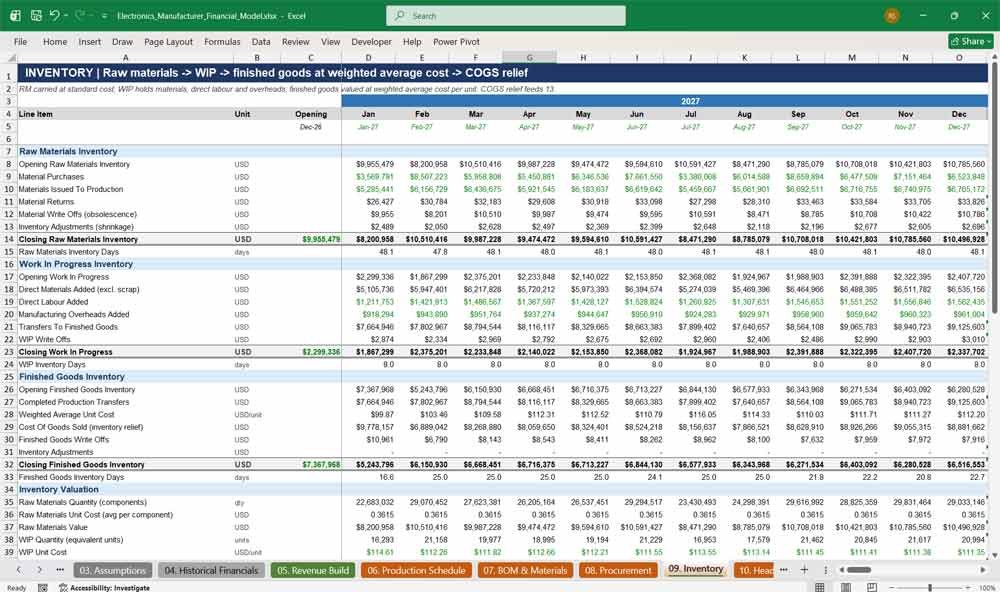
09. Inventory
The Inventory tab tracks raw materials, work in progress and finished goods every month. Finished goods are valued at weighted average cost, and inventory relief drives cost of goods sold. Obsolescence, shrinkage and write-offs flow to the income statement, while inventory days, turnover and valuation summaries support working capital analysis.
- Raw materials, WIP and finished goods roll-forwards
- Weighted average cost valuation
- Obsolescence, shrinkage and write-off modelling
- Inventory days, turnover and reconciliation checks
10. Headcount & Opex
The Headcount & Opex tab builds staff numbers for fifteen departments. Direct labour headcount is driven by production hours. Total compensation covers salaries, inflation, bonuses, payroll taxes, pensions, benefits, medical insurance, recruitment and training. Non-factory operating expenses are forecast line by line and allocated to departments for clear cost control.
- Headcount by department with hires and turnover
- Full employee compensation build
- 23 operating expense lines with individual inflation rates
- Departmental expense allocation and opex KPIs
11. Capex & Depreciation
The Capex & Depreciation tab forecasts maintenance and expansion capital expenditure across eleven asset classes. These include SMT lines, PCB equipment, testing, tooling, buildings, IT and software. Straight-line depreciation by useful life, asset disposals with gains or losses, and a full fixed asset roll-forward keep the balance sheet accurate.
- Maintenance capex as a percentage of gross assets
- Expansion capex plan linked to production capacity
- Depreciation and amortisation by asset class
- Fixed asset roll-forward and capex KPIs
Electronics Manufacturer Financial Statements
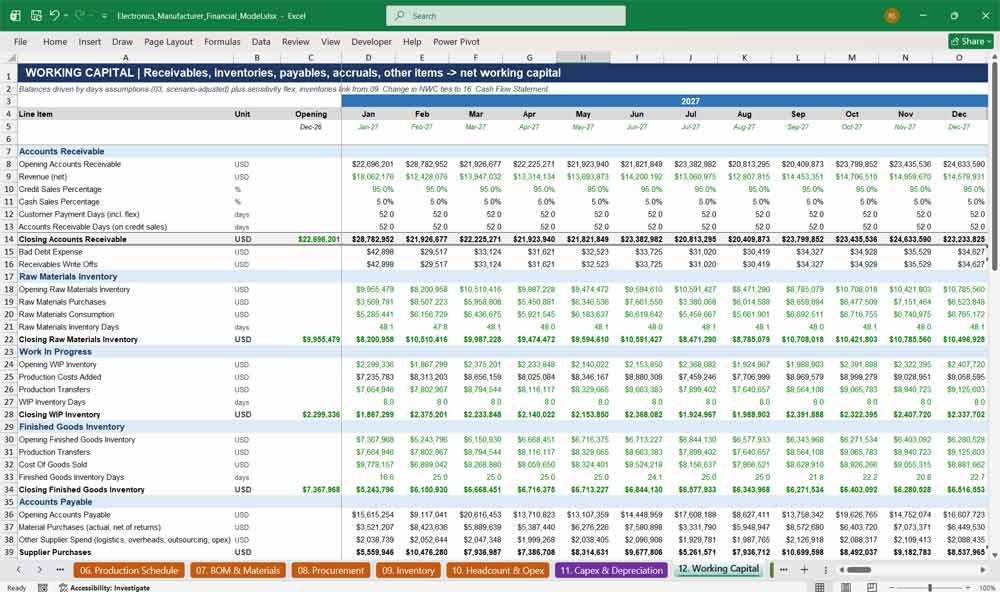
12. Working Capital
The Working Capital tab models receivables, inventories, payables, accruals and other current items. It includes customer deposits, supplier advances, prepayments and VAT. Days-based assumptions drive closing balances and net working capital, while the cash conversion cycle and working capital ratios highlight the cash tied up in operations.
- Accounts receivable with bad debt
- Material and trade payables with separate payment days
- Net working capital and monthly movement
- Cash conversion cycle and working capital KPIs
13. Revenue & COGS
The Revenue & COGS tab bridges gross revenue to net revenue after discounts, rebates, returns and warranty credits. Cost of goods sold is analysed by direct materials, direct labour, manufacturing overheads and other costs of sales. These include freight, duties, scrap, rework and warranty. Unit economics show margin per unit sold.
- Gross-to-net revenue bridge
- COGS by component, labour and overhead type
- Scrap, rework, warranty and logistics costs
- Unit economics and gross margin per unit
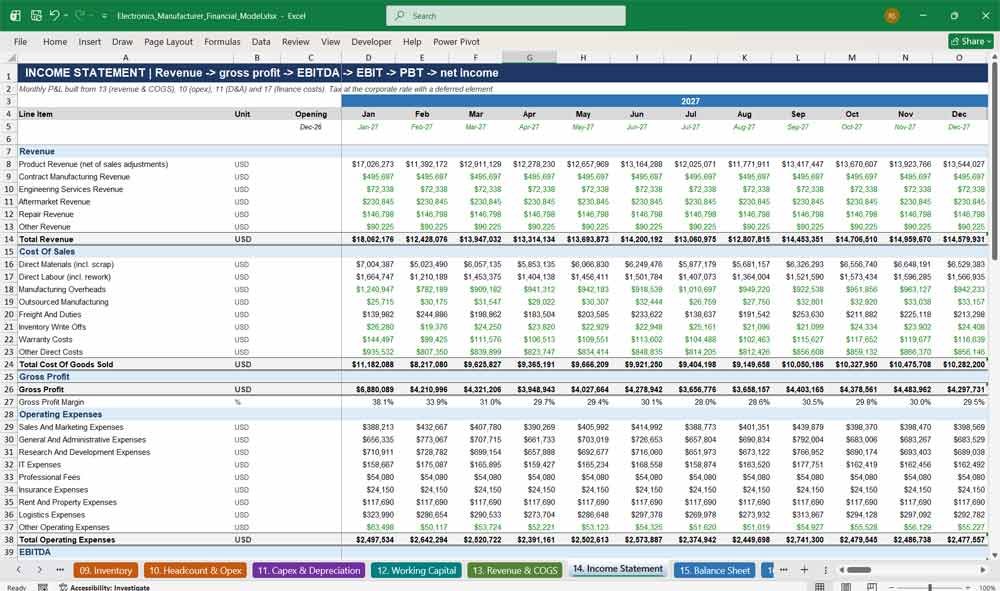
14. Income Statement
The Income Statement tab presents a monthly profit and loss account with annual totals. It runs from revenue and gross profit through operating expenses, EBITDA, depreciation, EBIT, finance costs and tax to net income. Growth rates, margins and EBITDA per employee provide a complete view of profitability for electronics manufacturers.
- Monthly P&L with FY roll-ups
- EBITDA, EBIT and net income margins
- Current and deferred tax
- Year-on-year growth metrics
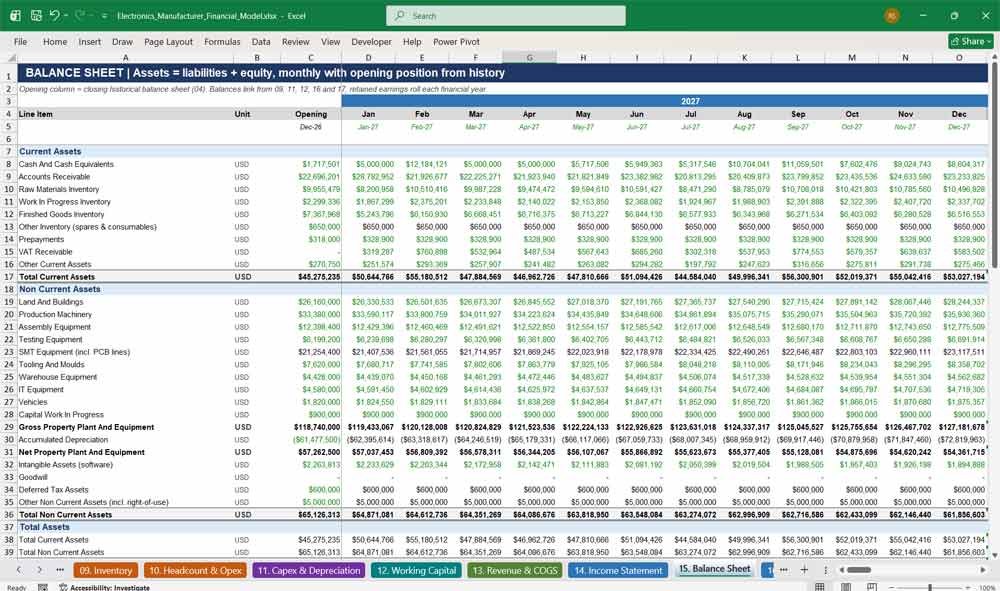
15. Balance Sheet
The Balance Sheet tab is a fully balancing monthly balance sheet, opening from the historical closing position. Assets, liabilities and equity link from the supporting schedules, and retained earnings roll forward each financial year. Net debt, liquidity ratios, gearing, return on assets and return on equity are calculated automatically.
- Balances every month with a visible check
- PP&E by asset class
- Equity roll-forward, including dividends
- Liquidity, leverage and return ratios
16. Cash Flow Statement
The Cash Flow Statement tab uses the indirect method. It runs from net income through working capital movements, interest and tax paid, then investing and financing cash flows. Closing cash reconciles to the balance sheet every month. Free cash flow, cash conversion and capex coverage metrics show how much cash the business generates.
- Operating, investing and financing cash flows
- Detailed capex cash outflows by asset type
- Dividends, equity and debt flows
- Free cash flow and cash conversion metrics
17. Debt Schedule
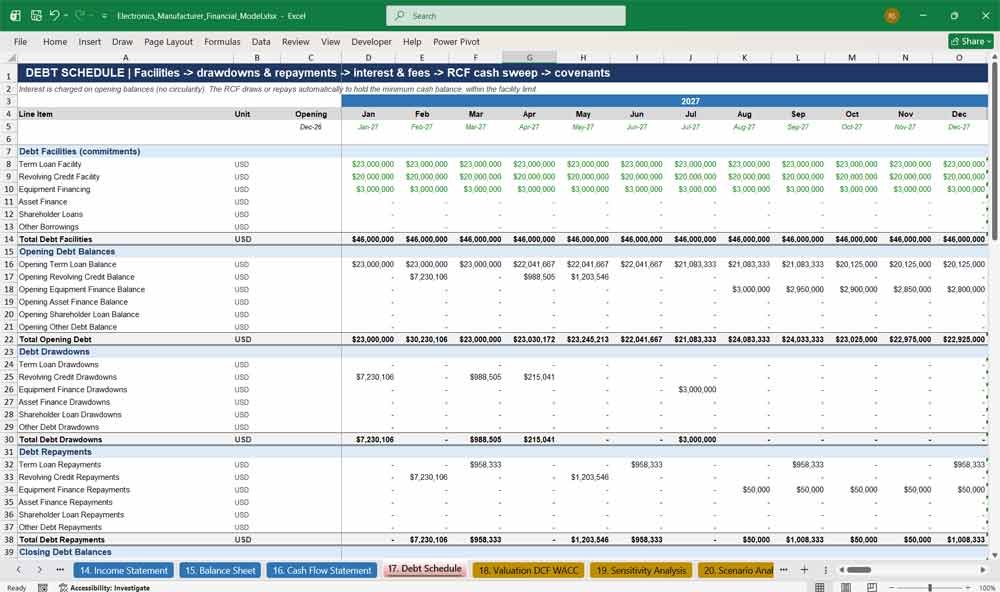
The Debt Schedule tab models a term loan, revolving credit facility, equipment finance, asset finance, shareholder loans and other borrowings. Interest, arrangement fees, commitment fees and facility fees are calculated monthly. An automatic RCF cash sweep maintains minimum cash. Leverage, interest cover and DSCR covenants are tested on a last-twelve-months basis.
- Six debt facilities with drawdowns and repayments
- Automatic revolving credit facility, with no circularity
- Interest and financing fees
- Covenant tests and headroom
Key Financial Metrics
18. Valuation DCF WACC
The Valuation DCF WACC tab values the business using unlevered free cash flow, mid-year or end-year discounting, and Gordon Growth or exit multiple terminal values. A full WACC build uses CAPM, levered beta, size premium and target capital structure. An equity bridge produces equity value and an implied share price.
- Unlevered free cash flow and discount factors
- Gordon Growth and EBITDA exit multiple terminal values
- WACC build: cost of equity and after-tax cost of debt
- Enterprise value, equity value and price per share
19. Sensitivity Analysis
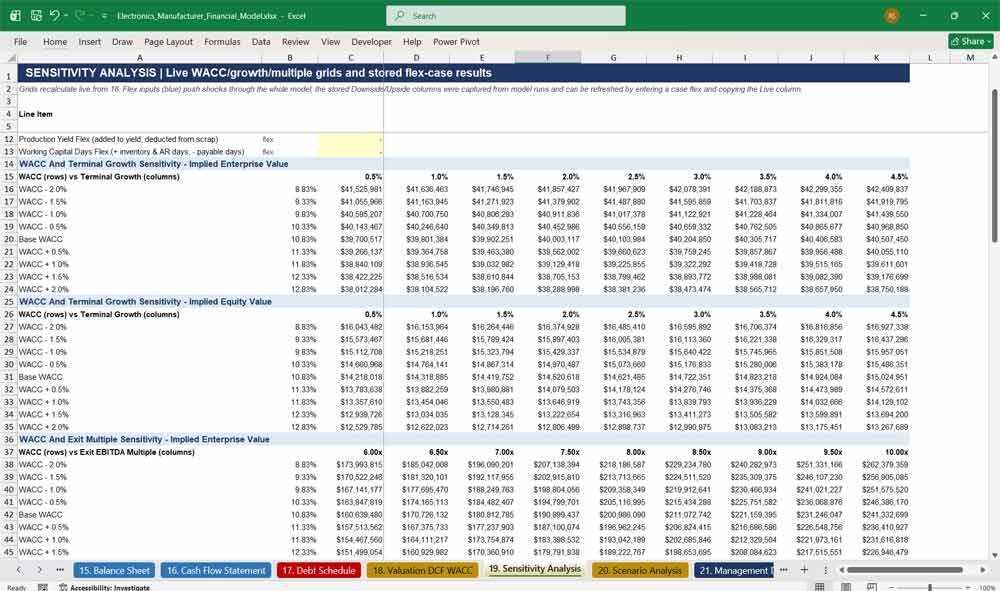
The Sensitivity Analysis tab tests valuation and performance against key risks. Live grids show enterprise and equity value across WACC, terminal growth and exit multiples. Operating sensitivities flex revenue growth, material costs, component inflation, production capacity, yield and working capital days through the entire model.
- Live 9×9 WACC vs terminal growth grids
- Live WACC vs exit multiple grids
- Revenue, margin, production, component cost and working capital sensitivities
- Six flex inputs that push shocks through the full model
20. Scenario Analysis
The Scenario Analysis tab defines base, upside and downside cases year by year. Drivers include revenue growth, ASP, unit sales, utilisation, yield, scrap, component and semiconductor inflation, labour and energy costs, working capital days and capex. Stored outputs compare revenue, EBITDA, free cash flow and enterprise value across scenarios, with probability weighting.
- Year-by-year assumptions for three scenarios
- Scenario selector feeds the whole model
- Revenue, EBITDA, net income and FCF by scenario
- Probability-weighted valuation and comparison table
21. Management Dashboard
The Management Dashboard tab presents key performance indicators in a board-ready format. It shows the latest historical year alongside five forecast years. Financial performance, cash and balance sheet, operational metrics, valuation and model checks appear on one page. Charts display revenue and EBITDA, margins, cash and net debt, and production versus capacity.
- Financial, cash and operational KPIs
- Valuation summary and model status
- Four dynamic charts
- Ready for board packs and investor presentations
Why Buy This Model?
Building an electronics manufacturing financial model from scratch can take weeks, and getting the inventory, production and three-statement links right is where most spreadsheets break. This model gives you a complete, tested framework from day one. Every tab is formula-linked, the balance sheet balances every month, cash reconciles and over twenty checks confirm integrity. The BOM and production schedule are deliberately separate, so you can answer the questions that matter most in electronics manufacturing. What happens if semiconductor prices rise 5%? What if yields slip or volumes outgrow capacity? It is formatted to bank and private equity standards and suits fundraising, lending applications, budgeting, capacity planning and M&A valuation. You simply replace the illustrative inputs with your own numbers and the model does the rest.
Electronics Manufacturing Frequently Asked Questions
What type of business is this model designed for?
It is designed for electronics manufacturers, EMS and contract manufacturers, PCB assemblers, and hardware or IoT device companies that build products from a bill of materials. It also suits any discrete manufacturer with component-based products, inventory and production capacity constraints.
Which version of Excel do I need?
The model works in Microsoft Excel 2010 and later, including Excel for Microsoft 365 on Windows and Mac. It uses standard Excel functions only, with no macros, add-ins or VBA, so it opens without security warnings.
Can I change the start date of the model?
Yes. Enter a new start date on the 02. Control & Checks tab and every date, year label, header and time-based calculation updates automatically across all 21 tabs.
How long is the forecast period?
The model includes three years of monthly historical data and a five-year monthly forecast. Each forecast year has an annual total column, so you get monthly detail and annual summaries together.
Can I add my own historical data?
Yes. Replace the blue input cells on the 04. Historical Financials tab with your actual monthly figures. The closing balance sheet automatically becomes the opening position for the forecast.
How many products can I model?
The model includes detailed bills of materials and order books for three core products. It also covers a new product launch, other product revenue and service revenue streams such as contract manufacturing, engineering services, aftermarket and repairs.
Can I model changes in semiconductor or component prices?
Yes. Separate inflation indices for semiconductors, PCBs, electronic components, raw materials and packaging drive BOM costs. The sensitivity tab lets you flex component inflation and material costs through the whole model.
Does the model handle production capacity constraints?
Yes. If demand exceeds achievable capacity, production is scaled back and unfilled orders stay in backlog. Capacity grows through organic improvements and expansion capex, and utilisation, downtime, maintenance days and efficiency are all adjustable.
How is inventory valued?
Raw materials are carried at standard cost, and finished goods use weighted average cost. Work in progress includes materials, direct labour and manufacturing overheads. Obsolescence, shrinkage and write-offs flow through to the income statement.
Does the balance sheet balance?
Yes. The balance sheet balances in every historical and forecast month, and closing cash reconciles to the cash flow statement. The 02. Control & Checks tab displays PASS or REVIEW so you can confirm integrity instantly.
Is there a valuation included?
Yes. The model includes a full DCF valuation with a WACC build, Gordon Growth and exit multiple terminal values, an equity bridge and an implied share price. Live sensitivity grids show valuation across WACC, terminal growth and exit multiples.
Can I run different scenarios?
Yes. Base, upside and downside scenarios are defined year by year for revenue growth, pricing, volumes, yields, component costs, labour and energy inflation, working capital and capex. Switch between them with a single dropdown.
Does it include debt financing?
Yes. The debt schedule covers a term loan, revolving credit facility, equipment finance, asset finance, shareholder loans and other borrowings. The revolving credit facility draws and repays automatically to maintain your minimum cash balance, and covenants are tested monthly.
Is the model suitable for bank loans and investor presentations?
Yes. It follows professional modelling standards used by lenders and private equity: colour-coded inputs, formulas and links, a single timeline, clear section headers, tie-out checks and a management dashboard with charts for presentations.
Can I change the currency?
Yes. The model is set up in US dollars, but you can type your own currency label in the assumptions. Because all values are inputs or formulas, the model works in any currency.
Is the data in the model real?
No. The model contains illustrative but internally consistent data for a sample electronics manufacturer, so you can see how everything works. Replace the inputs with your own figures to create your forecast.
Do I need advanced Excel skills to use it?
No. All inputs are clearly marked in blue on yellow cells and grouped on the assumptions tab, and calculations are fully automated. Basic Excel knowledge is enough, while experienced analysts can still trace and audit every formula.
Can I customise or extend the model?
Yes. The model is fully unlocked, so you can add products, cost lines, departments or asset classes, rename items and adjust the layout to suit your business.
Final Notes On The Financial Model
This 5-Year Electronics Manufacturer Financial Model must focus on balancing capital expenditures with steady revenue growth from diversified product lines. Be sure to optimise operational costs, power efficiency, and maximise high-margin products, this model ensures sustainable profitability and cash flow stability.