
Electrical Equipment Manufacturer Financial Model (Excel)
The Electrical Equipment Manufacturer Financial Model is a fully integrated Excel financial model built for companies that manufacture smart grid infrastructure and renewable energy integration equipment. It covers transformers, switchgear, grid automation and smart meters, power electronics and inverters, renewable integration equipment, energy storage integration (BESS) and aftermarket services. With 3 years of monthly historical financials and a 10-year forecast (Years 1–5 monthly with annual totals, Years 6–10 annual), this manufacturing financial model gives founders, CFOs, investors and lenders a complete, bankable view of the business.
Financial Model for an Electrical Equipment Manufacturer
Smart Grid Infrastructure & Renewable Energy Integration Equipment
Unlike generic three-statement templates, this electrical equipment financial model is driven by real manufacturing economics. Revenue is built from units sold, SKU mix, list prices, escalation and discounts. Production is sized from sales, finished-goods stock targets and production yield. Costs come from a detailed bill of materials covering copper, aluminium, steel, semiconductors and electronic components, plus labour hours, factory overheads and depreciation. Capacity utilisation, expansion projects, order intake, backlog and the sales pipeline are all modelled, so every forecast number can be traced back to an operational driver.
The model produces a fully linked Income Statement, Balance Sheet and Cash Flow Statement. It also includes a DCF valuation, comparable company and precedent transaction multiples, investor IRR and MOIC, a KPI dashboard with 11 charts, and 54 automated model checks. Change one start date and the entire timeline re-dates automatically. Switch between five scenarios (Base, Upside, Downside, Management and Investor) in one click. Use it for fundraising, bank debt applications, capacity investment decisions, budgeting or company valuation in the grid and energy transition sector.
What’s Inside: Tab-by-Tab Guide
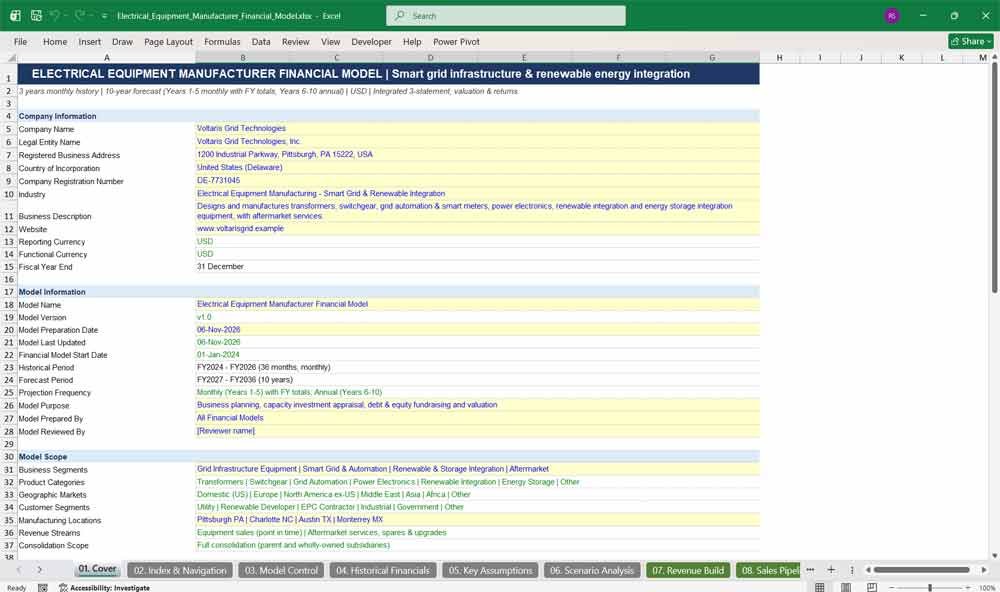
01. Cover
The Cover tab presents company information, model details, scope, financial periods and model conventions in one professional summary page. Period labels and the model status update automatically, so the cover always reflects the current timeline, selected scenario and check results. It is ideal for investor packs and lender submissions.
- Company, legal entity and registration details
- Model version, preparation date, purpose and reviewer
- Model scope: segments, products, markets, locations, revenue streams
- Automatic labels for 3 historical and 10 forecast years
- Confidentiality, forecast, assumptions and valuation disclaimers
- Colour legend for inputs, formulas and links
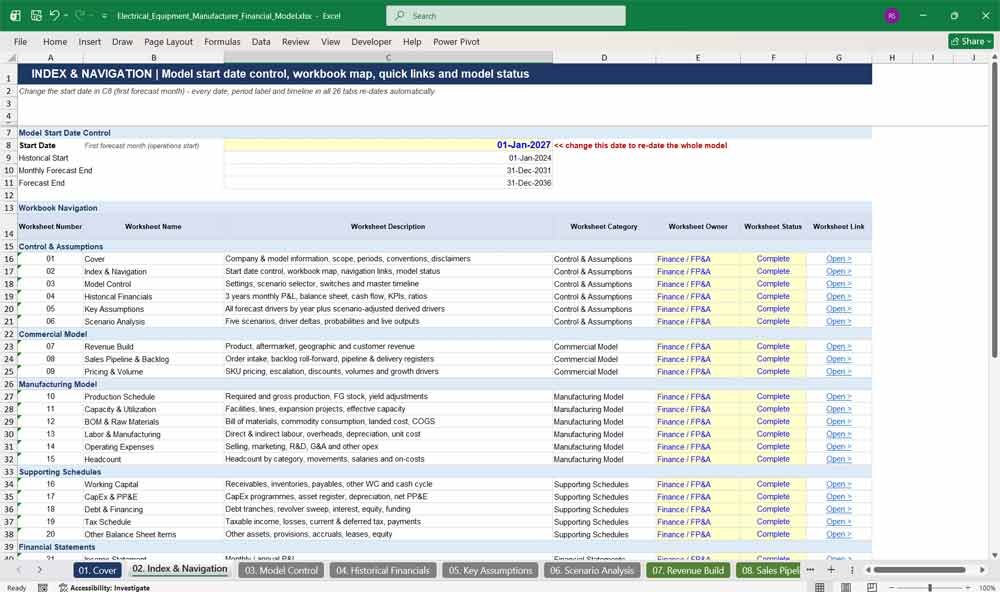
02. Index & Navigation
The Index & Navigation tab is the control centre of the financial model. Enter one start date and every date across all 26 tabs updates automatically. A full workbook map with descriptions, owners, status and hyperlinks makes navigating this Excel manufacturing model fast for analysts, investors and reviewers.
- Single start-date input that re-dates the entire model
- Clickable links to every worksheet
- Worksheet number, name, description, category, owner and status
- Quick-jump links to key sections
- Live model status: version, review status, open issues, completed tabs
03. Model Control
The Model Control tab holds all global settings, switches and the master monthly/annual timeline. It sets currency, fiscal year, scenario selection, terminal value method and operational selectors. Every tab reads its dates from this single timeline, giving the electrical equipment model consistent, error-free period logic.
- Model, financial and forecast settings
- Scenario selector with dropdown and override switch
- Terminal value method: perpetuity, exit multiple or average
- Selectors for manufacturing location, product, market and customer segment
- Valuation and model-check activation switches
- Master timeline with period flags and seasonality
Electrical Equipment Manufacturer Revenue & Sales
04. Historical Financials
The Historical Financials tab captures 36 months of actual results: income statement, balance sheet, cash flow, operating KPIs and financial ratios. Revenue is split across all product lines and costs by commodity and manufacturing category. Built-in balance and cash checks confirm the historical data is complete and consistent.
- Monthly P&L, balance sheet and cash flow for 3 years
- Revenue by transformers, switchgear, grid automation, smart meters, power electronics, ESS and aftermarket
- Cost of sales by copper, aluminium, steel, semiconductors and labour
- Operating KPIs: units, capacity, yield, backlog, book-to-bill, headcount
- Ratios: margins, liquidity, leverage, ROA, ROE, ROIC
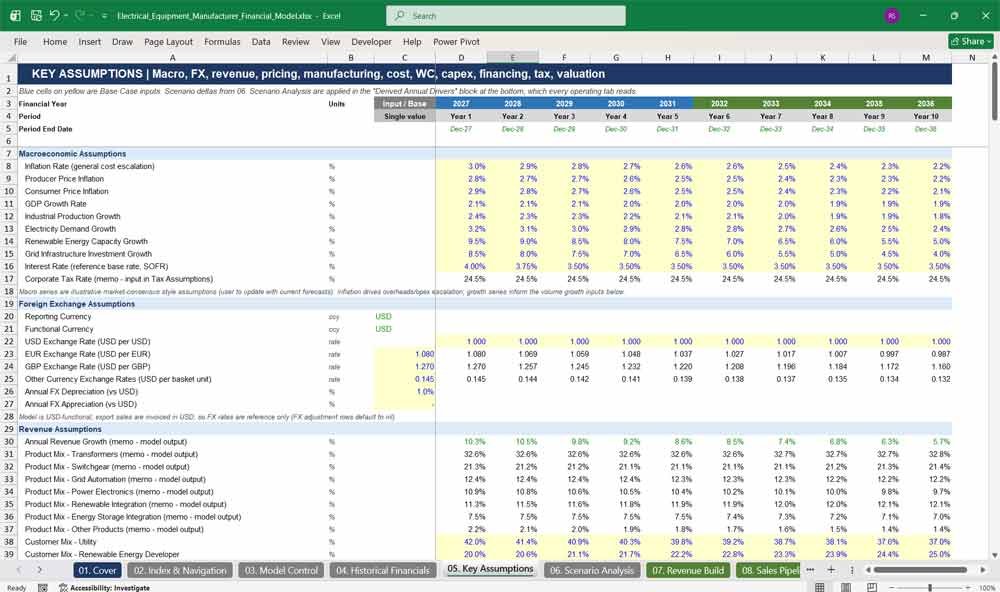
05. Key Assumptions
The Key Assumptions tab contains every forecast driver by year in one place. It covers macroeconomics, FX, revenue, pricing, commodity prices, labour, opex, working capital, capex, depreciation, financing, tax and valuation. Scenario-adjusted derived drivers feed the whole model automatically, making sensitivity testing quick and transparent.
- Annual drivers for all 10 forecast years
- Copper, aluminium, steel, semiconductor and component price decks
- Customer and geographic mix with 100% checks
- Working capital days, capex budgets and asset useful lives
- Debt terms, equity raise, dividend policy and tax rates
- CAPM, WACC, terminal growth and exit multiple inputs
06. Scenario Analysis
The Scenario Analysis tab lets you compare Base, Upside, Downside, Management and Investor cases. More than 50 scenario drivers flex revenue, manufacturing, raw materials, labour, opex, working capital, capex, financing and valuation. Live outputs show revenue, EBITDA, cash, net debt, enterprise value, IRR and MOIC for the selected case.
- Five fully defined scenarios with probabilities
- Revenue, pricing, volume and order intake deltas
- Commodity price, labour and opex inflation flexes
- Capacity, yield, ramp-up and expansion timing levers
- Financing and valuation scenario drivers
- 10-year scenario output summary
07. Revenue Build
The Revenue Build tab calculates revenue from units, SKU mix, list prices and discounts for every product category. It includes aftermarket revenue from the installed base, plus revenue by geography and customer segment. This bottom-up revenue model gives investors clear visibility of growth drivers in smart grid and renewable equipment.
- Power, distribution and specialty transformer revenue
- LV, MV and HV switchgear revenue
- Smart meters, relays, grid controllers and automation systems
- Converters, inverters, power control, solar, wind and BESS revenue
- Aftermarket: service contracts, spare parts and upgrades
- Revenue by region and customer type
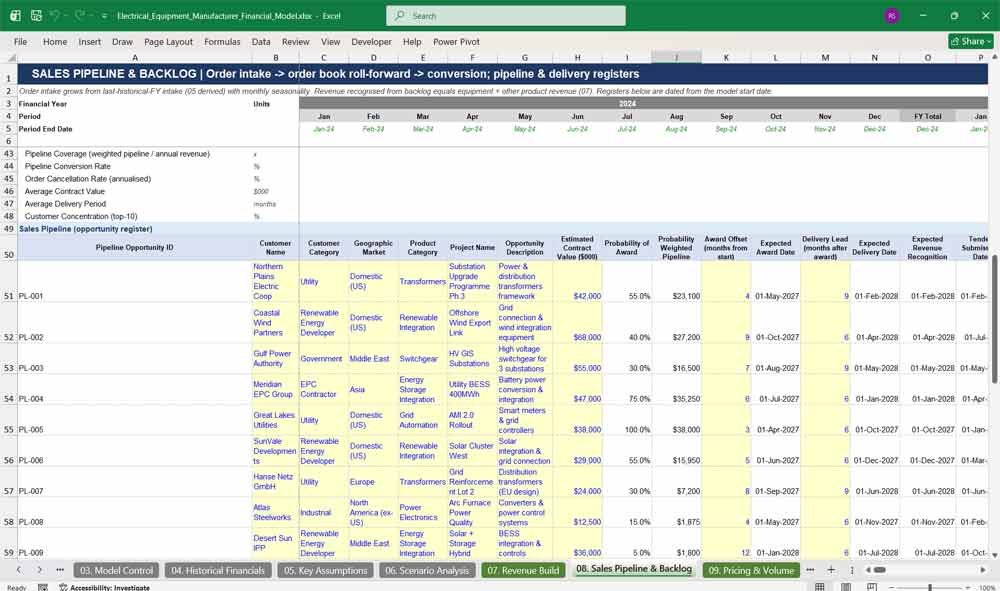
08. Sales Pipeline & Backlog
The Sales Pipeline & Backlog tab models order intake, the order book roll-forward and backlog conversion. A 20-opportunity pipeline register with probabilities, stages and dates sits alongside an open order delivery register. Commercial KPIs such as book-to-bill, backlog coverage and pipeline coverage show revenue visibility.
- New orders by customer type and domestic vs international
- Backlog roll-forward with amendments, price escalation and cancellations
- Short, medium and long-term backlog analysis
- Probability-weighted sales pipeline by stage
- Order delivery and revenue recognition tracker
- Book-to-bill, backlog coverage and conversion KPIs
09. Pricing & Volume
The Pricing & Volume tab holds the SKU price master, annual price escalation and discount structure for 20 products. Sales volumes are built from new customers, existing customer growth, replacement demand, exports and market expansion. Pricing KPIs separate price, volume and mix effects for clear revenue analysis.
- SKU list with base, customer, distributor and contract prices
- Price escalation by product category
- Customer, volume, contract, distributor and promotional discounts
- Units sold by product with monthly seasonality
- Volume growth drivers by source
- ASP growth, price realisation and mix impact KPIs
10. Production Schedule
The Production Schedule tab converts sales into a manufacturing plan for every product line. Required output equals units sold plus target finished-goods stock, then grossed up for production yield. Scrap, rework and field quality failures are tracked, giving a realistic production forecast for an electrical equipment factory.
- Production planning by product, facility and line
- Opening stock, target closing stock and required production
- Gross production after yield losses
- Scrap, rework, rejected and warranty failure units
- Production shortfall against effective capacity
- Units per employee, per line and on-time completion KPIs
11. Capacity & Utilization
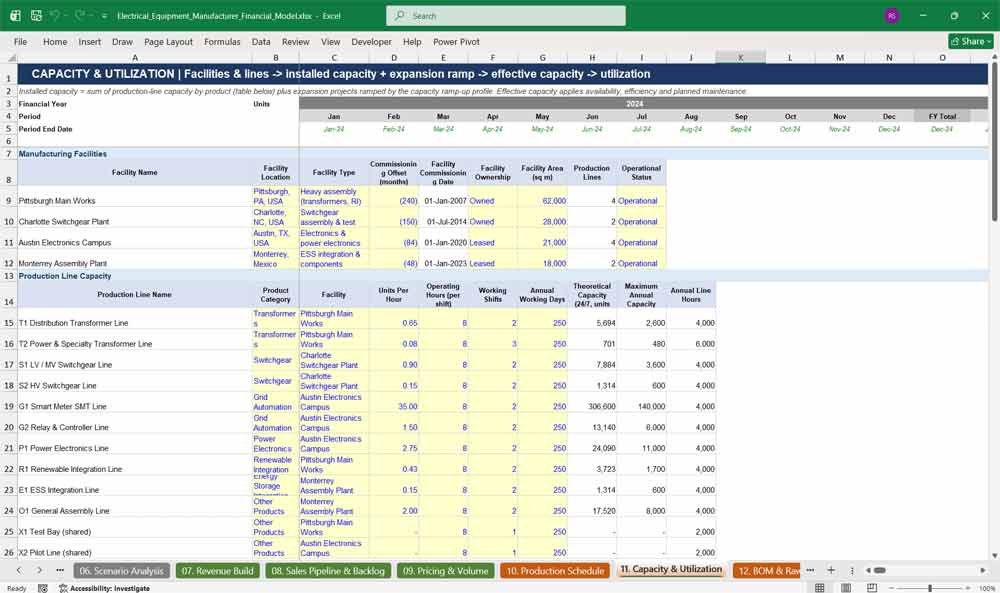
The Capacity & Utilization tab models four manufacturing facilities, 12 production lines and eight expansion projects with ramp-up profiles. Effective capacity reflects availability, efficiency and planned maintenance. Utilisation by product line and an automatic bottleneck indicator help plan factory expansion and capex timing.
- Facility register with ownership, area and lines
- Line capacity from units per hour, shifts and working days
- Expansion projects with start, completion and commissioning dates
- Year-by-year capacity ramp-up profile
- Effective capacity after downtime and maintenance
- Utilisation by product and production bottleneck finder
Electrical Equipment Manufacturer Financial Statements
12. BOM & Raw Materials
The BOM & Raw Materials tab contains a full bill of materials for every product, covering copper, aluminium, steel, semiconductors, electronic components and ten other material types. Landed costs include freight and import duties. Material consumption, inventory and cost of goods sold are calculated automatically for accurate gross margin forecasting.
- Bill of materials with quantities and wastage by product
- Copper, aluminium, steel, semiconductor and component requirements
- Other materials: insulation, cables, PCBs, enclosures and more
- Supplier, lead time, MOQ, freight and duty assumptions
- Material cost per unit and per product
- Price variance, usage variance and supplier concentration KPIs
13. Labor & Manufacturing
The Labor & Manufacturing tab calculates direct labour from standard hours per unit, productivity and wage rates, plus indirect factory labour. Twelve manufacturing overhead lines are split into fixed and variable costs. Manufacturing depreciation and unit cost economics complete a detailed cost-of-production model.
- Direct labour hours, FTEs, hourly rates and overtime
- Labour cost by product line
- Supervisors, maintenance, quality control and warehouse costs
- Factory utilities, electricity, maintenance and consumables
- Fixed vs variable manufacturing overheads
- Unit manufacturing cost and efficiency KPIs
14. Operating Expenses
The Operating Expenses tab forecasts selling, marketing, R&D, general and administrative and other operating costs line by line. Staff costs link from the headcount plan, while non-staff costs grow with category-specific indices. R&D capitalisation, warranty and bad debt expenses are included for a complete opex forecast.
- Sales salaries, commissions, tenders and business development
- Advertising, trade shows, digital and product marketing
- R&D, engineering, prototypes, testing and certification
- Management, admin, IT, legal, audit and insurance costs
- Warranty, product liability and compliance costs
- Opex as a percentage of revenue KPIs
15. Headcount
The Headcount tab plans 18 employee categories from executives to production workers. Production staff are driven by labour hours, while salaried teams grow at category rates. Hires, resignations, retirements, salaries, bonuses, benefits, payroll taxes and pensions roll into fully loaded costs allocated to COGS and opex.
- Headcount by 18 employee categories
- Opening and closing headcount by department
- New hires, resignations, terminations and retirements
- Salary, bonus, benefit, payroll tax and pension assumptions
- Fully loaded employee cost by cost centre
- Revenue and EBITDA per employee KPIs
16. Working Capital
The Working Capital tab calculates receivables, raw materials, work-in-progress, finished goods and payables using days assumptions. Every balance has a full roll-forward, including collections, purchases and supplier payments. Net working capital, cash impact and the cash conversion cycle show the true cash needs of a manufacturer.
- Receivables roll-forward and DSO
- Raw material, WIP and finished goods inventory schedules
- Payables, purchases and supplier payments
- Customer advances, prepayments and accruals
- Net working capital movement and cash impact
- DSO, DIO, DPO and cash conversion cycle
17. CapEx & PP&E
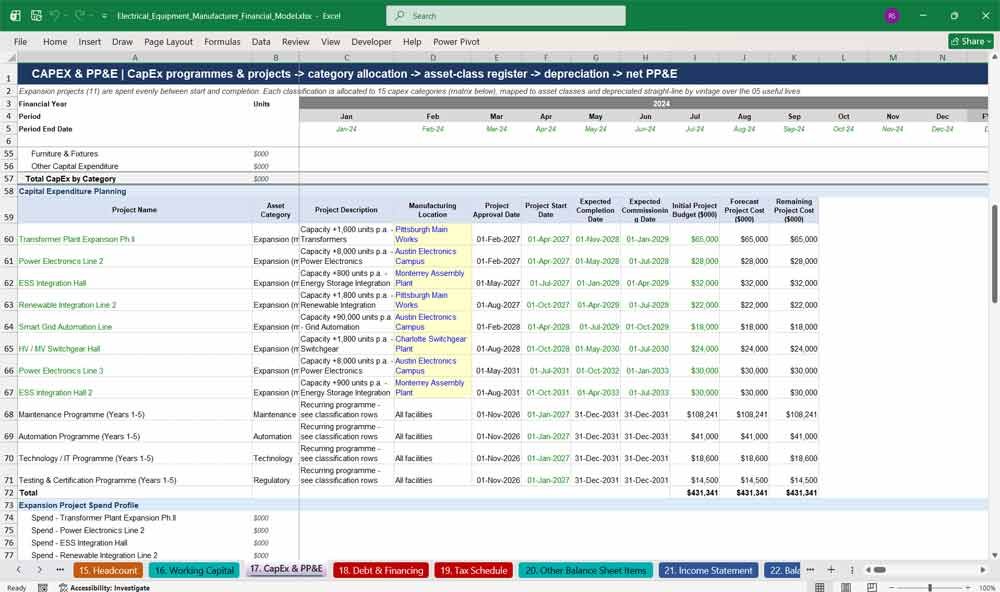
The CapEx & PP&E tab plans maintenance, expansion, replacement, automation, technology, regulatory and building capex. Spend is allocated to 15 asset categories and depreciated by vintage over each asset class’s useful life. Full gross, accumulated depreciation and net PP&E roll-forwards support accurate fixed asset reporting.
- 15 capex categories from land to robotics and testing labs
- Capex project planning register with approval and commissioning dates
- Expansion project spend profiles
- Asset-class register with straight-line depreciation by vintage
- PP&E and intangible asset roll-forwards
- Capex to revenue and capex to depreciation KPIs
18. Debt & Financing
The Debt & Financing tab models the existing term loan, a new growth term loan, equipment financing and a revolving credit facility with automatic cash sweep. Interest, commitment fees and arrangement fee amortisation are calculated without circular references. Equity raises, funding requirements and credit ratios support lender and investor discussions.
- Existing debt facility register with covenants
- Term loan, equipment finance and revolver tranches
- Automatic revolver draw to maintain minimum cash
- Interest, commitment fees and arrangement fees
- Equity issuance and transaction costs
- Net debt/EBITDA, interest cover and DSCR
19. Tax Schedule
The Tax Schedule tab moves from accounting profit to taxable income, including permanent and temporary differences. It handles tax loss carryforwards with utilisation limits, R&D tax credits, deferred tax from accelerated depreciation and tax payments in arrears. Effective and cash tax rates are reported for every period.
- Permanent and temporary tax differences
- Tax loss carryforward and utilisation limit
- Current tax with R&D credits
- Deferred tax assets and liabilities
- Tax payable roll-forward and cash tax payments
- Effective tax rate and cash tax rate
20. Other Balance Sheet Items
The Other Balance Sheet Items tab manages prepayments, advances, VAT, deposits, capitalised development costs, provisions, accruals, IFRS 16 leases and other liabilities. Warranty provisions roll forward from charges and claims. Equity movements, including retained earnings and dividends, complete a fully balanced balance sheet.
- Prepaid expenses, supplier advances and VAT receivable
- Capitalised development costs and amortisation
- Warranty, legal, environmental and other provisions
- Accrued salaries, bonuses, utilities and fees
- IFRS 16 lease liabilities and right-of-use assets
- Share capital, retained earnings and dividends
21. Income Statement
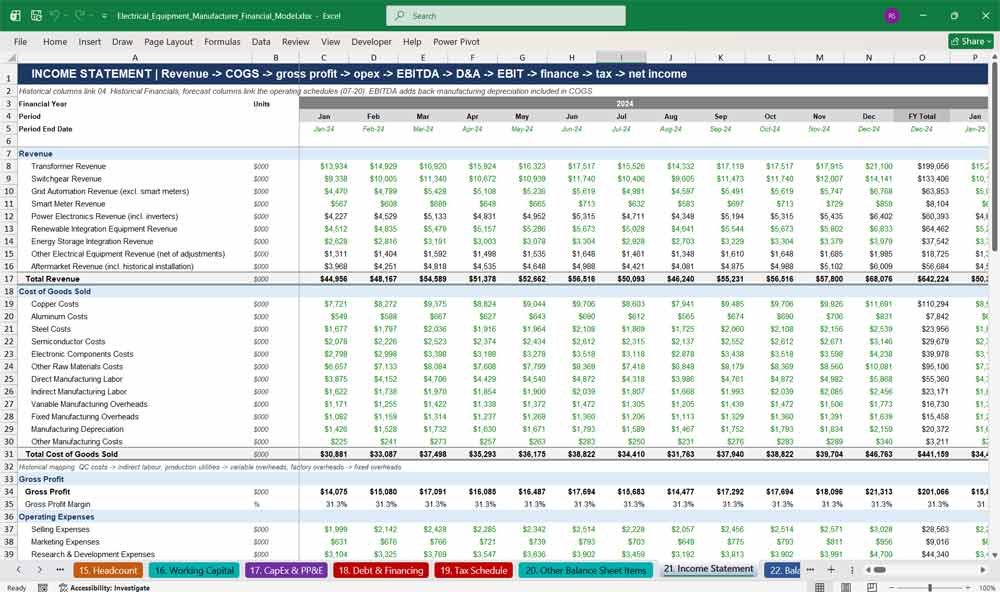
The Income Statement tab presents monthly and annual profit and loss from revenue by product through cost of goods sold, gross profit, operating expenses, EBITDA, depreciation, EBIT, finance costs, tax and net income. It also includes earnings per share and growth metrics across the full 13-year period.
- Revenue by product line
- Detailed COGS by material, labour, overheads and depreciation
- Gross profit, EBITDA and EBIT with margins
- Finance costs, lease interest and fee amortisation
- Current and deferred tax and net income
- EPS, diluted EPS and year-on-year growth
22. Balance Sheet
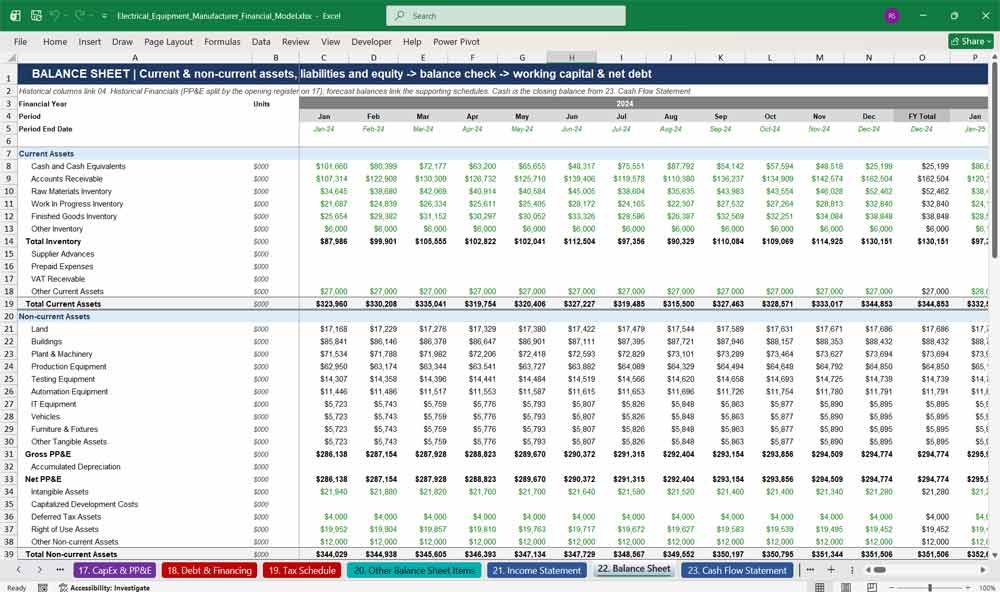
The Balance Sheet tab shows assets, liabilities and equity for every month and year, with PP&E split by asset class. A balance check confirms assets equal liabilities plus equity in every period. Net working capital, operating working capital, net debt and invested capital are calculated for analysis.
- Current assets including three inventory types
- PP&E by 10 asset classes with accumulated depreciation
- Current and non-current liabilities including leases
- Warranty and other provisions
- Full shareholders’ equity breakdown
- Balance check, net debt and invested capital
23. Cash Flow Statement
The Cash Flow Statement tab uses the indirect method, with working capital movements taken directly from the balance sheet so cash always reconciles. It covers operating, investing and financing cash flows, interest and tax paid, and unlevered and levered free cash flow with cash flow KPIs.
- Operating cash flow with full working capital movements
- Interest and income tax paid
- Capex analysed by programme
- Debt drawdowns, repayments, revolver, equity, leases and dividends
- Cash reconciliation to the balance sheet
- Unlevered and levered free cash flow
Key Financials For Smart Grid Equipment Manufacturing
24. Model Checks
The Model Checks tab runs 54 automated checks across the financial statements, supporting schedules, operations, commercial data, financing, valuation and model integrity. Each check shows PASS or REVIEW, and an overall model status feeds the cover and index, giving reviewers and lenders confidence in the model.
- Balance sheet and cash reconciliation checks
- Roll-forward checks for receivables, inventory, payables, PP&E, debt and tax
- Revenue, volume, production and cost reconciliations
- Backlog, pipeline and minimum cash checks
- Valuation, WACC, ownership and IRR checks
- Error, missing data and duplicate input checks
25. KPI Dashboard
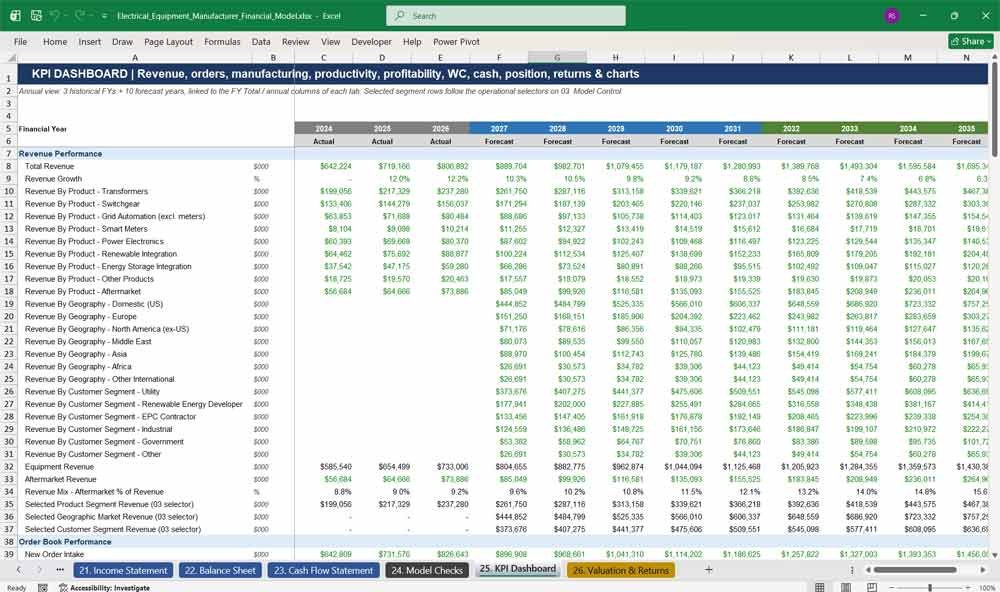
The KPI Dashboard tab summarises the business across 3 historical and 10 forecast years on one page. It covers revenue, order book, manufacturing, productivity, profitability, working capital, cash flow, financial position and investment returns, with 11 charts ready for investor presentations and board packs.
- Revenue by product, geography and customer segment
- Order intake, backlog and book-to-bill
- Capacity utilisation, yield and scrap rate
- Margins, cash conversion and net debt
- EV multiples, ROIC, ROE, IRR and MOIC
- 11 charts including revenue, EBITDA, backlog and valuation sensitivity
26. Valuation & Returns
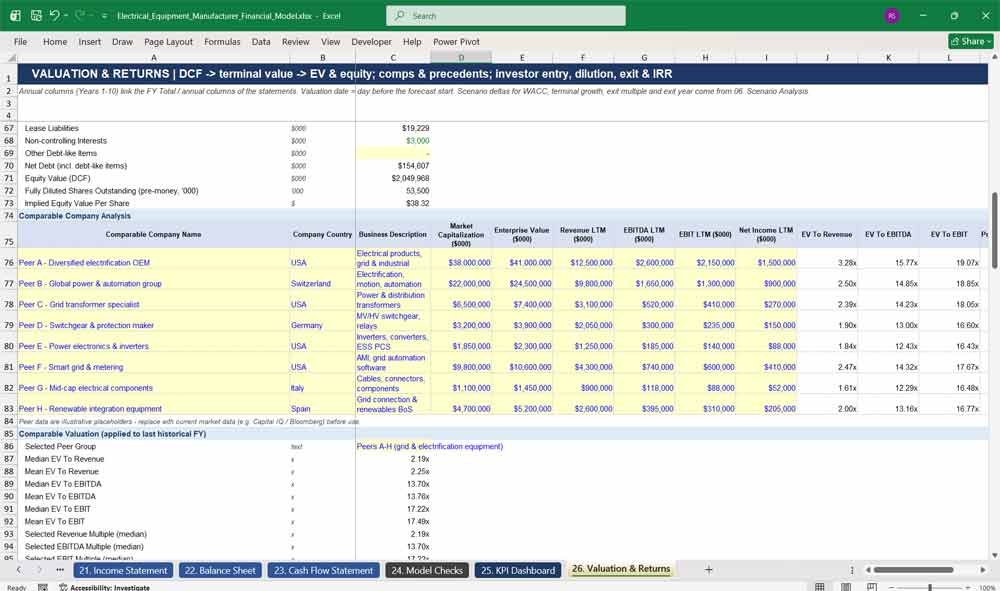
The Valuation & Returns tab values the business using a DCF with perpetuity growth and exit multiple methods, comparable companies and precedent transactions. It models the investment round, share dilution, sources and uses, exit valuation, investor IRR and MOIC, plus 10 valuation sensitivities for robust investment analysis.
- DCF with CAPM-based WACC and terminal value options
- Enterprise value to equity value bridge
- Comparable company and precedent transaction analysis
- Pre-money, post-money and fully diluted ownership
- Sources and uses, exit valuation, IRR, MOIC and payback
- Sensitivities: WACC, growth, margin, copper price, utilisation, entry and exit
Why Buy This Model
Building a credible financial model for an electrical equipment manufacturer from scratch can take weeks of specialist work. This model gives you that work done properly from day one. It is driven by real manufacturing logic (bill of materials, commodity prices, production yield, labour hours, factory capacity, expansion projects and order backlog) rather than simple growth percentages, so your numbers stand up to questions from investors, banks and boards. The three financial statements are fully integrated and balance in every period, 54 automated checks catch errors, and there are no circular references. Five built-in scenarios, ten valuation sensitivities and a one-click start date make it easy to adapt the model to your own business and timeline. Clear colour coding, consistent layouts and a tab-by-tab navigation index mean you can understand, update and present it with confidence, whether you are raising equity, applying for debt, planning a new factory line or valuing a grid and renewable energy equipment company.
Smart Grid Infrastructure Frequently Asked Questions
What type of business is this financial model designed for?
It is designed for manufacturers of smart grid and renewable energy integration equipment, such as transformers, switchgear, grid automation systems, smart meters, power electronics, inverters, renewable grid connection equipment and battery energy storage integration. It also suits wider electrical equipment manufacturers with similar production processes.
Can I use it if my company only makes some of these products?
Yes. You can set volumes for any product line you don’t make to zero, and the model continues to work. You can also rename products and SKUs and update prices and bills of materials to match your own range.
How long is the forecast period?
The model includes 3 years of monthly historical data and a 10-year forecast. Years 1 to 5 are monthly with an annual total column, and Years 6 to 10 are annual.
Can I change the start date of the model?
Yes. Enter a new start date on the Index & Navigation tab and every date, year label, timeline and dated register across all 26 tabs updates automatically. It also works with fiscal years that don’t start in January.
Do I need advanced Excel skills to use it?
No. Inputs are clearly marked in blue on a yellow background, calculations are in black and links between tabs are in green. You mainly update the historical data and key assumptions, and the model does the rest. Experienced users can still trace every formula.
Does the model include a balance sheet and cash flow statement?
Yes. It includes a fully integrated Income Statement, Balance Sheet and Cash Flow Statement, monthly and annually. The balance sheet balances in every period, and cash reconciles automatically.
Is the data in the model real?
No. The historical figures, company name, customers, peer companies and transactions are illustrative placeholders that show how the model works. Replace them with your own actual data and current market information before using the model for decisions.
Can I model different scenarios?
Yes. The model has five scenarios: Base, Upside, Downside, Management and Investor. Each one flexes over 50 drivers, including volumes, pricing, commodity prices, labour costs, working capital, capex, financing and valuation. You switch between them with a single dropdown.
How does the model handle raw material costs like copper?
Each product has a bill of materials with quantities of copper, aluminium, steel, semiconductors and electronic components, plus other materials. These are multiplied by yearly commodity price assumptions, freight and import duties to give a realistic material cost. The model also includes a copper price sensitivity on the valuation tab.
Does it model factory capacity and expansion?
Yes. It includes production lines, facilities and eight expansion projects with start, completion and commissioning dates and ramp-up profiles. It calculates effective capacity, utilisation by product line and highlights the production bottleneck.
Can I use this model to raise investment or apply for a bank loan?
Yes. It includes a DCF valuation, comparable company and transaction multiples, an investment round with dilution, sources and uses, investor IRR and MOIC, and debt metrics such as net debt to EBITDA, interest cover and DSCR. These are the outputs investors and lenders typically ask for.
How do I know the model is error-free?
The Model Checks tab runs 54 automated checks covering the statements, schedules, operations, financing, valuation and model integrity. Each shows PASS or REVIEW, and the overall model status appears on the cover page.
Does the model contain circular references or macros?
No. Interest is calculated on opening balances, so there are no circular references, and the model uses standard Excel formulas without macros.
Which currency does the model use?
The model is in US dollars, shown in thousands. The currency label and exchange rate assumptions can be updated for your reporting needs.
Can I customise the model for my business?
Yes. The model is fully unlocked, so you can add products, change cost lines, adjust assumptions and update the dashboard charts to suit your company.
Final Notes on the Financial Model
Financial model for an Electrical Equipment Manufacturer
- Scenario Analysis: Create best-case, base-case, and worst-case projections.
- Break-even Analysis: Determine the sales volume required to cover fixed & variable costs.
- Sensitivity Analysis: Assess how changes in raw material costs, pricing, or demand impact profitability.
This structured model will help any Electrical manufacturing company address a broad market spectrum, offering the right balance between cost, production capacity, and support.