
Drone Manufacturing Financial Model Template (2026 Excel)
A drone manufacturing financial model template is the fastest way to turn a hardware business plan into numbers that investors, lenders and your own board can trust. This Excel template is built specifically for drone and UAV manufacturers, covering consumer, prosumer, enterprise, industrial and defense/security drones, plus custom contract manufacturing, spare parts, accessories, batteries, software, subscriptions and services. It combines two years of monthly historical actuals with a five-year monthly forecast and annual roll-ups, so you can present a complete operating history and a credible growth plan in one integrated workbook.
5-Year Financial Model for a Drone Manufacturer
Unlike generic startup templates, this drone business plan financial model starts where a drone company actually starts: on the factory floor. Demand drives a monthly build plan by product category, production lines and shifts set capacity, and yield, scrap and rework determine good units available to sell. A full bill of materials (BOM) with more than 40 components (flight controllers, motors, ESCs, cameras, gimbals, battery cells, firmware and more) flows into direct materials, while direct labor, manufacturing overhead, contract manufacturing, logistics and warranty complete a detailed cost of goods sold. The result is a realistic gross margin per unit and a clear view of how capacity, pricing and component costs shape profitability.
Every assumption links through a fully integrated income statement, balance sheet and cash flow statement, with a balance sheet check, cash flow reconciliation and a dedicated checks tab that flags any issue. Change one Model Start Date and every tab re-dates automatically. Switch between Base, Upside and Downside scenarios from the cover page, review funding needs with an automatic revolving credit facility, and test value with a DCF valuation, exit multiple and investor IRR. Whether you are raising a seed or growth round, applying for equipment financing, or planning a new UAV production line, this model gives you a professional, lender-ready starting point.
What’s Inside: Tab-by-Tab Overview
01. Cover Control
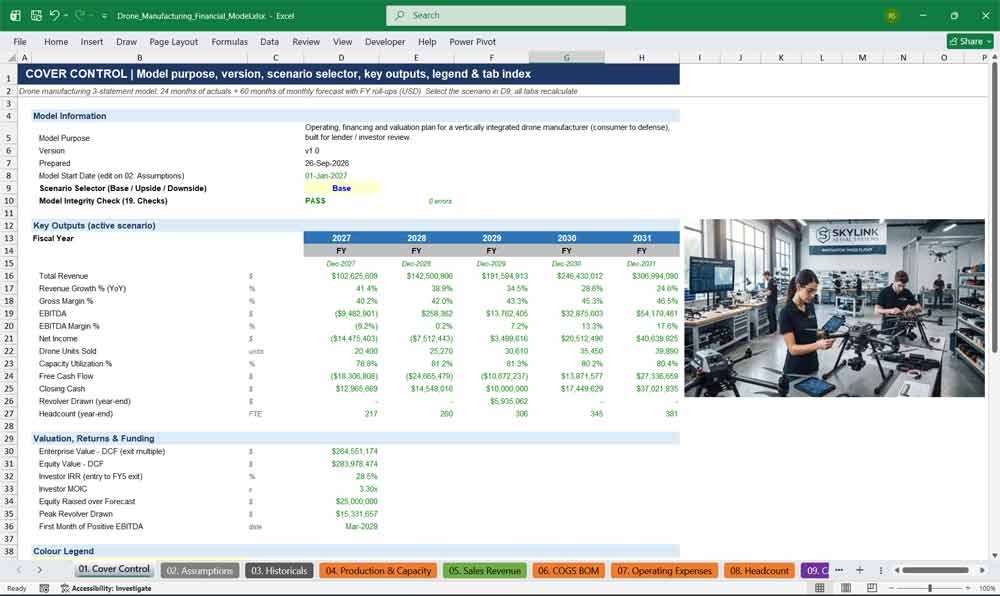
The Cover Control tab is your command centre for the drone financial model. Select Base, Upside or Downside scenarios from one dropdown, confirm model integrity at a glance, and review headline revenue, EBITDA, cash, valuation and funding outputs before presenting to investors or lenders.
- Scenario selector (Base / Upside / Downside) that drives the whole workbook
- Model integrity status (PASS / REVIEW) linked to the Checks tab
- Five-year key outputs: revenue, growth, gross margin, EBITDA, net income, units, cash
- Valuation summary: enterprise value, equity value, investor IRR and MOIC
- Colour legend and hyperlinked tab index for fast navigation
02. Assumptions
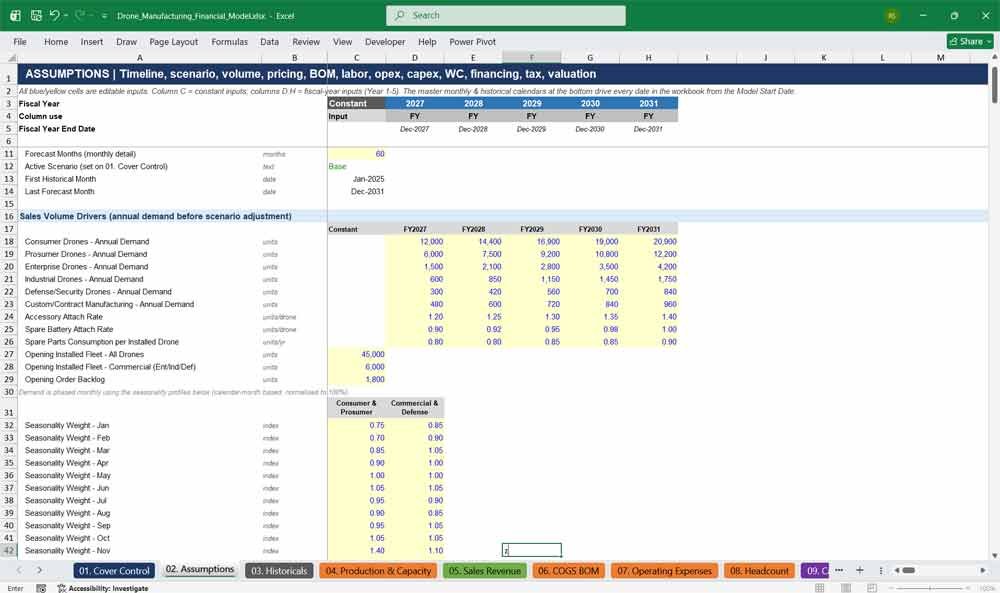
The Assumptions tab centralises every input for your drone manufacturing forecast. Edit demand, pricing, discounts, BOM costs, labor rates, headcount, opex, capex, working capital, financing, tax and valuation assumptions in one place, with a single start date driving every timeline.
- One Model Start Date re-dates every tab, header and escalation automatically
- Annual inputs by fiscal year plus constant inputs, clearly colour-coded
- Full bill of materials matrix: 43 components across five drone categories
- Seasonality profiles for consumer and commercial demand
- Master monthly forecast calendar and historical calendar
Drone Manufacturing Revenues & Expenses
The Historicals tab holds 24 months of monthly actuals for production, revenue, COGS, operating expenses, capex, P&L, cash flow, balance sheet, working capital and KPIs. An opening balance sheet bridge maps historical closing balances into the forecast, so history and projections connect seamlessly.
- Two years of monthly history with annual totals
- Historical production metrics: units, capacity, utilization, yield, scrap, unit cost
- Historical balance sheet that balances by construction
- Working capital days and KPIs such as revenue per employee and inventory turns
- Opening balance sheet bridge with its own tie-out check
04. Production & Capacity
The Production & Capacity tab builds a monthly drone production plan by category. Demand, finished goods targets and warranty replacements set required output, while production lines, shifts, efficiency and a capacity constraint determine gross production, scrap, rework, good units and units available to sell.
- Seven production categories, including custom/contract manufacturing and spare parts
- Capacity model: lines, days, shifts, hours, theoretical, practical and maximum capacity
- New-line ramp-up curve, pilot/NPI builds and steady-state output
- Manufacturing efficiency: first pass yield, scrap, rework, downtime, OEE, cycle time
- In-house vs contract manufacturing split and factory footprint
05. Sales Revenue
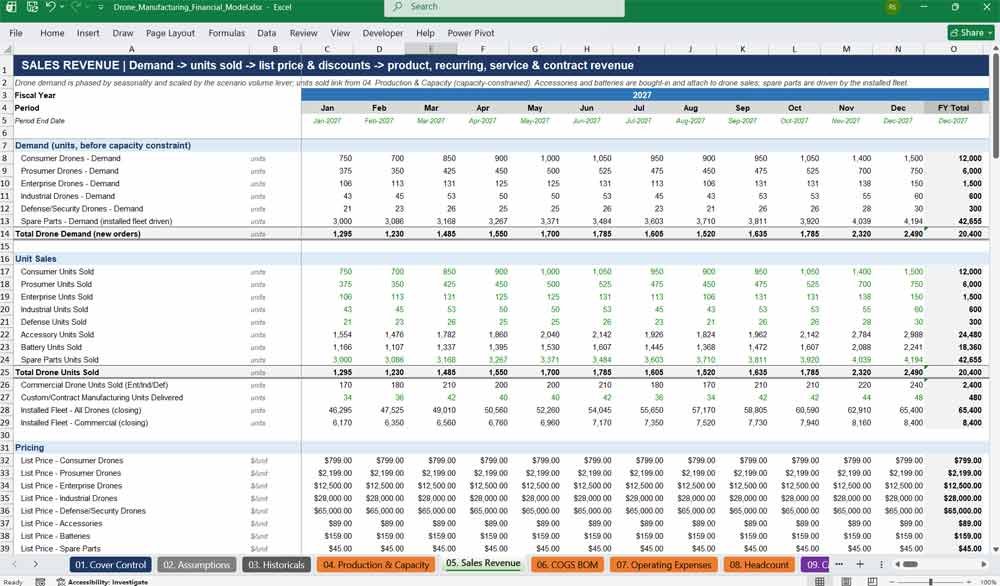
The Sales Revenue tab converts seasonal demand into units sold, list prices, discounts and net revenue for every drone category. It also models accessories, batteries, spare parts, software licenses, subscriptions, maintenance, repairs, training, extended warranties and contract revenue.
- Revenue by product, sales channel (seven channels) and geography (five regions)
- Pricing waterfall: list price, volume, channel and promotional discounts, returns
- Subscriber build: new, churned and ending subscribers with monthly pricing
- Contract backlog, bookings, completion % and book-to-bill ratio
- Customer metrics: active customers, CAC and revenue per customer
06. COGS BOM
The COGS BOM tab calculates cost of goods sold from a detailed drone bill of materials. Component costs flow through inflation, supplier price changes and scrap, then combine with direct labor, overhead, contract manufacturing, logistics, warranty and inventory adjustments.
- Component-level material cost across electronics, imaging, airframe, power and firmware
- Effective BOM cost per unit for each drone category, accessories and batteries
- Direct labor hours and cost for assembly, testing and packaging
- Manufacturing overhead, contract manufacturing fees and MOQ shortfalls
- Warranty provision, claims, inventory obsolescence, shrinkage and scrap cost
07. Operating Expenses
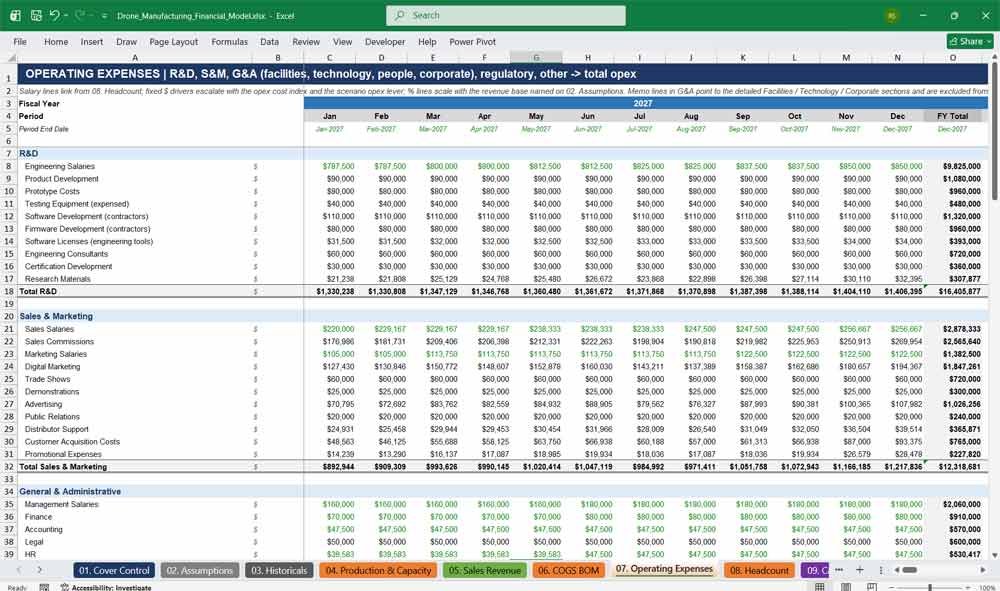
The Operating Expenses tab forecasts R&D, sales and marketing, general and administrative, regulatory and compliance, facilities, technology, people and corporate costs. Salaries link from headcount, fixed costs escalate with inflation, and variable costs scale with revenue.
- R&D: engineering salaries, prototypes, software and firmware development, certification
- Sales & marketing: commissions, digital marketing, trade shows, demos, CAC
- Regulatory: aviation certifications, export compliance, safety and environmental testing
- Facilities, technology, people and corporate cost sections
- Opex ratios: R&D, S&M and G&A as % of revenue and revenue per employee
08. Headcount
The Headcount tab builds a hiring plan for nine salaried departments plus derived direct production staff. Headcount ramps monthly towards year-end targets, driving base salaries, bonuses, benefits, payroll taxes, stock-based compensation, recruitment, relocation, training and travel costs.
- Department-level headcount, new hires and average salaries
- Wage inflation applied automatically by fiscal year
- Direct production FTE derived from labor hours
- Supervisors and QC costs loaded into manufacturing overhead
- Total payroll cost and headcount summary for investor reporting
09. Capex Fixed Assets
The Capex Fixed Assets tab links capital spending to growth: new production lines, tooling for new products and factory expansion. It tracks funding sources, asset roll-forwards by class, depreciation, intangibles, leased assets and disposals with gains or losses.
- Production, tooling, facility, technology and maintenance capex
- Fourteen capex categories reconciled to capex totals
- Cash-, debt- and lease-funded capex split
- Fixed asset roll-forwards and depreciation for six asset classes
- Intangibles, right-of-use assets and disposal gain/loss calculations

Drone Manufacturer Financial Statements
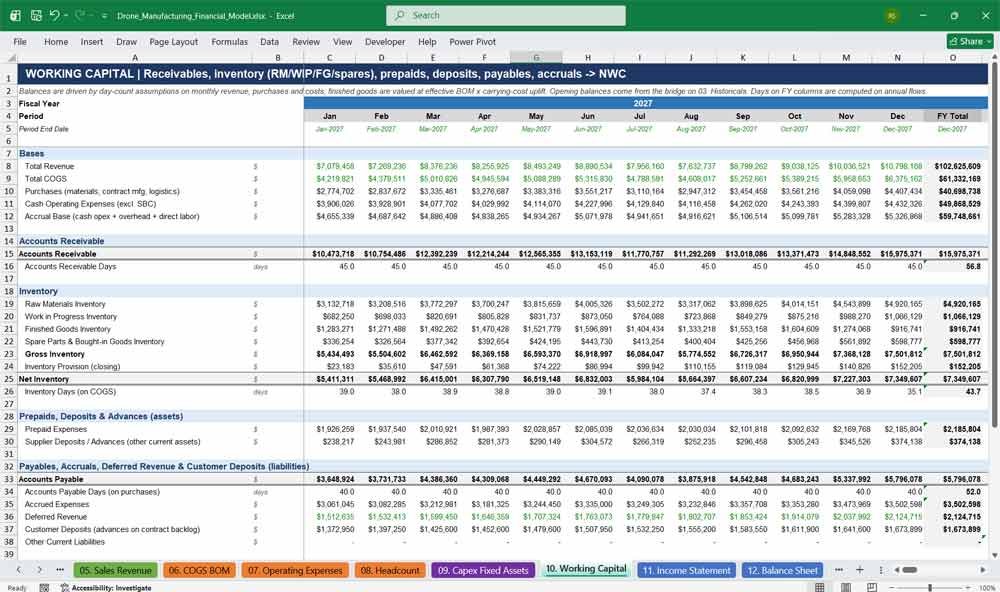
10. Working Capital
The Working Capital tab calculates receivables, inventory, prepaids, supplier deposits, payables, accruals, deferred revenue, customer deposits and tax payable. Inventory is split into raw materials, work in progress, finished goods and spare parts for a realistic manufacturing cash cycle.
- AR, inventory and AP days plus working capital days
- Inventory build with obsolescence provision
- Customer deposits on contract backlog and deferred subscription revenue
- Quarterly tax payment schedule
- Net working capital and change in working capital each month
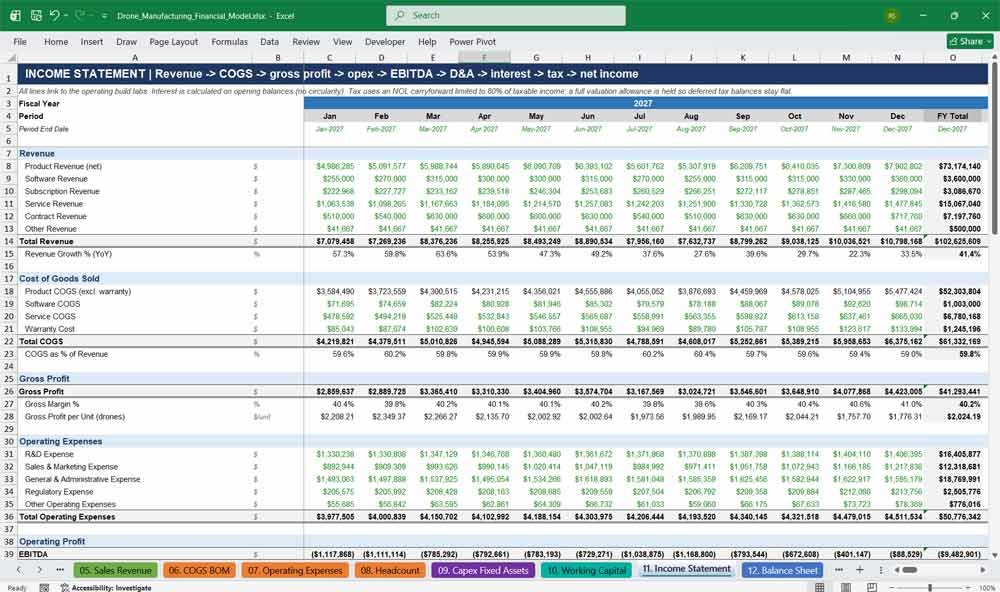
11. Income Statement
The Income Statement tab presents a monthly and annual drone company P&L, from revenue by stream through gross profit, operating expenses, EBITDA, depreciation, interest and tax to net income, with margins and per-unit profitability metrics.
- Revenue by product, software, subscription, service, contract and other
- Gross margin, EBITDA margin, EBIT margin and net margin
- Tax schedule with NOL carryforward and utilisation limit
- Per-unit revenue, COGS, gross profit, EBITDA and net income
- EBITDA break-even month tracking
12. Balance Sheet
The Balance Sheet tab delivers a full monthly balance sheet with current assets, inventory detail, fixed assets, right-of-use assets, intangibles, liabilities and equity. A balance check confirms assets equal liabilities plus equity in every period.
- Detailed current and non-current assets and liabilities
- Inventory breakdown: raw materials, WIP, finished goods, spare parts, provision
- Equity: share capital, APIC, retained earnings, current year profit, treasury shares
- Working capital and debt summaries
- Balance sheet check in every month and year
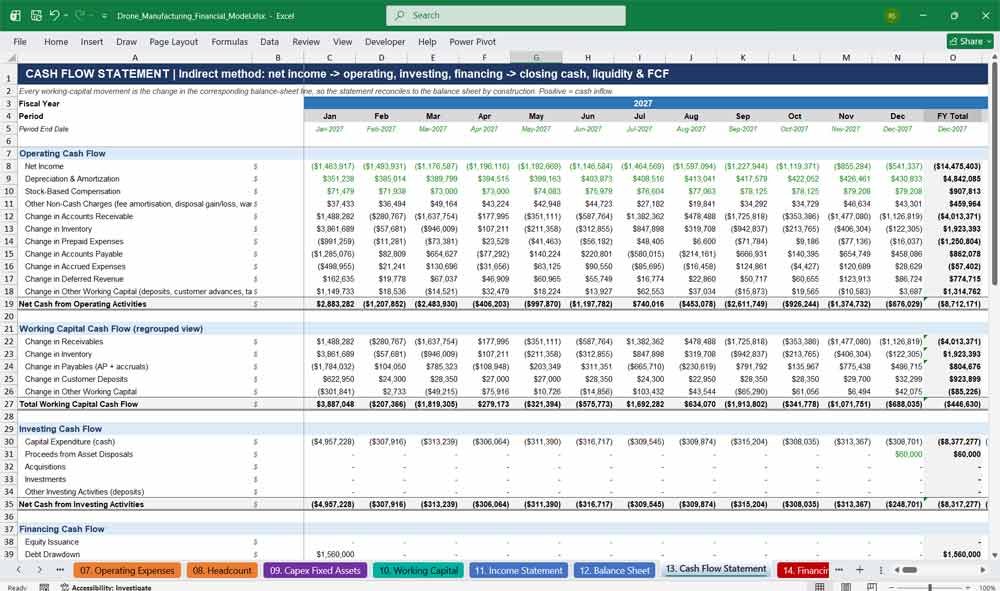
13. Cash Flow Statement
The Cash Flow Statement tab uses the indirect method to reconcile net income to cash across operating, investing and financing activities. It shows liquidity, cash runway, monthly burn and free cash flow, so funding gaps are visible early.
- Operating, investing and financing cash flows
- Regrouped working capital cash flow view with tie-out
- Minimum cash, available cash, shortfall and funding requirement
- Cash runway and monthly cash burn
- Free cash flow and free cash flow margin
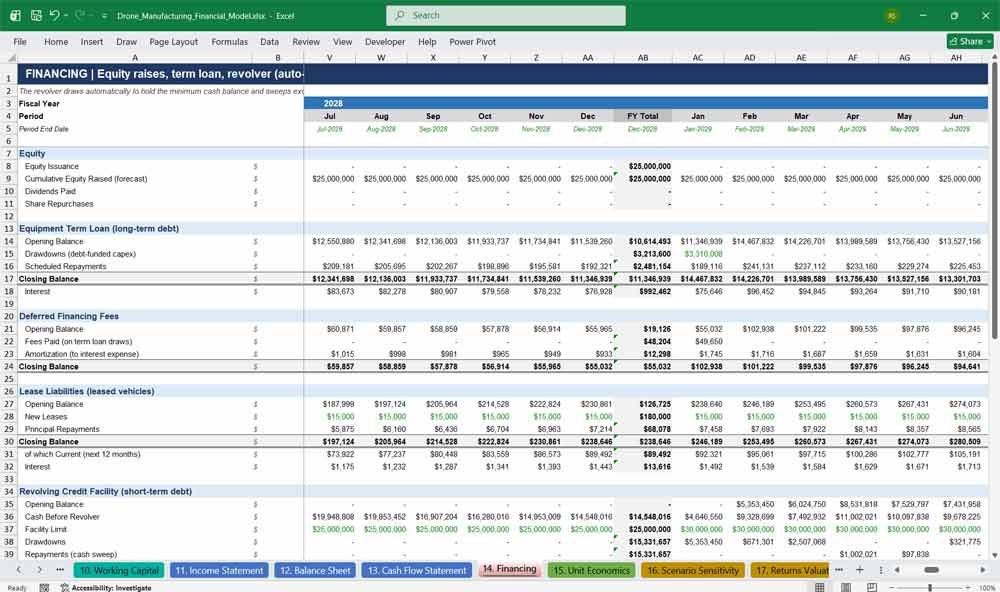
14. Financing
The Financing tab manages equity raises, an equipment term loan, a revolving credit facility, leases, financing fees, dividends and share buybacks. The revolver draws automatically to protect minimum cash and repays from surplus cash, without circular references.
- Equity issuance by month with cumulative equity raised
- Term loan draws linked to debt-funded capex, with amortisation
- Automatic revolver with facility limit and undrawn headroom
- Interest summary and deferred financing fee amortisation
- Net debt, leverage and interest cover metrics
15. Unit Economics
The Unit Economics tab shows the profitability of every drone sold. It builds revenue, cost, gross margin and contribution margin per unit, then calculates break-even volume, margin of safety, CAC, subscriber lifetime value and LTV/CAC ratio.
- Blended revenue and cost stack per drone unit
- Gross margin and contribution margin per unit and %
- Break-even volume and margin of safety
- Customer economics: CAC, LTV and LTV/CAC
- Direct margin by drone category (consumer to defense)
Key KPIs For Drone Manufacturer
16. Scenario Sensitivity
The Scenario Sensitivity tab defines Base, Upside and Downside levers for volume, price, BOM cost, yield, capacity utilization and fixed opex. It adds EBITDA sensitivities and a stored snapshot comparing key results across all three scenarios.
- Six scenario levers selected from the Cover tab
- Live lever column feeding the whole model
- EBITDA sensitivities for price, volume, BOM cost and yield
- Capacity-constrained months by year
- Stored side-by-side scenario comparison
17. Returns Valuation
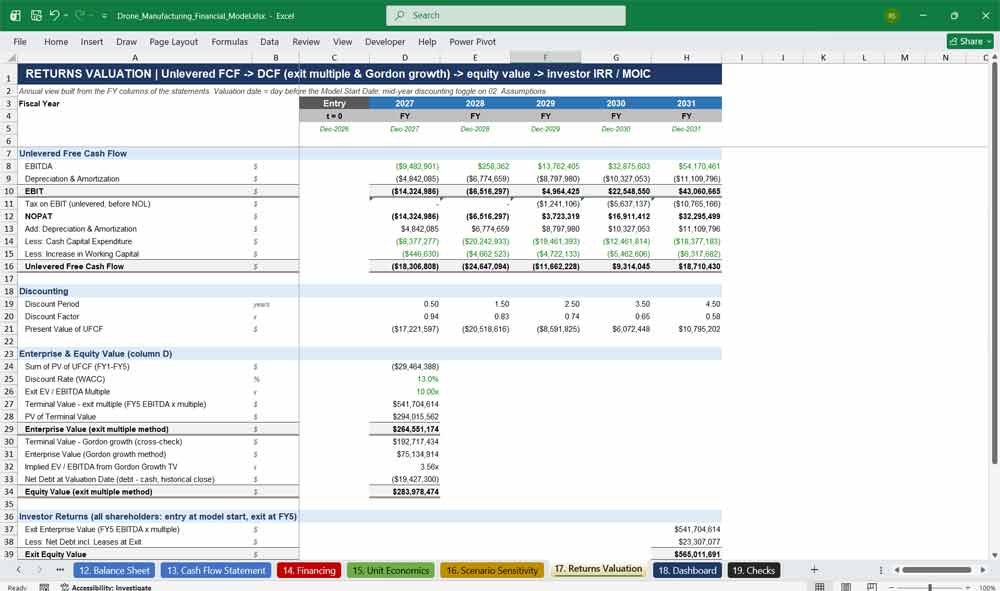
The Returns Valuation tab values the drone business using unlevered free cash flow and a discounted cash flow (DCF). It compares exit-multiple and Gordon growth terminal values, derives equity value and calculates investor IRR and MOIC.
- Unlevered free cash flow build from EBITDA
- Mid-year discounting toggle and WACC input
- Exit multiple and Gordon growth terminal values
- Enterprise value to equity value bridge
- Investor cash flows, IRR and MOIC
18. Dashboard
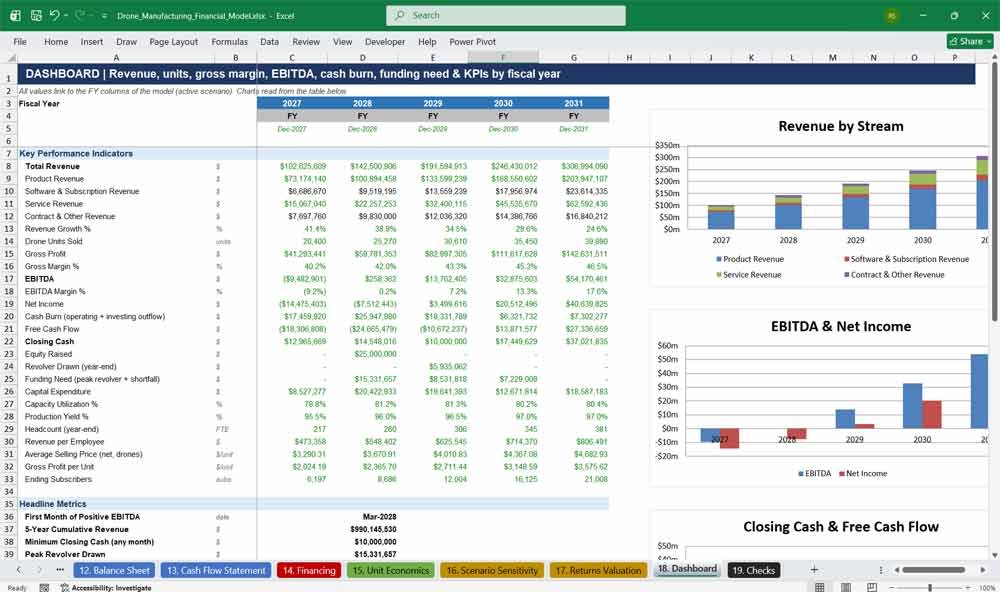
The Dashboard tab summarises the drone manufacturing business plan on one page. Annual KPIs and charts show revenue, units, gross margin, EBITDA, cash burn, free cash flow, funding need, capacity utilization and headcount for fast investor presentations.
- Annual KPI table for all five forecast years
- Charts: revenue by stream, EBITDA and net income, cash and FCF, units sold
- EBITDA break-even month and minimum cash
- Peak revolver and total external funding need
- Enterprise value, IRR and model check status
19. Checks
The Checks tab validates the entire financial model every month and year. It tests the balance sheet, cash reconciliation, EBITDA, revenue, COGS, opex, capex and working capital tie-outs, plus liquidity and input flags, returning a clear PASS or REVIEW status.
- 18 integrity checks with a $1 tolerance
- Error count and PASS / REVIEW status per period
- Negative cash, revolver limit and debt balance warnings
- Historical balance sheet and opening bridge checks
- Capacity-binding flag and no circular references by design
Why Buy This Model
Building a drone manufacturing financial model from scratch can take weeks, and generic templates rarely capture production capacity, BOM costs, yield or contract manufacturing. This model does. It gives you a fully integrated, formula-driven Excel workbook with 24 months of history, 60 months of monthly forecasts, three linked financial statements, scenario analysis, DCF valuation and built-in checks, so every number ties out. Colour-coded inputs make it easy to replace the illustrative figures with your own data, and a single start date keeps the whole model current as your plans change. Whether you are a founder preparing for a fundraise, a CFO planning a new production line, or an analyst evaluating a UAV manufacturer, you get a professional, lender-ready model you can adapt and present with confidence.
Frequently Asked Questions
Q: I’m building a drone startup and don’t have any sales yet. Can I still use this model?
A: Yes. The historical tab is optional in practice: you can enter small or zero historical figures and start from the forecast. Demand, pricing, capacity and cost assumptions on the Assumptions tab drive the projections, so a pre-revenue company can model its launch and ramp-up.
Q: Do I need advanced Excel skills to use it?
A: No. Inputs are clearly marked in blue on yellow, formulas are in black, and links between tabs are in green. You change the inputs on the Assumptions and Historicals tabs, and the rest of the model updates automatically. The Cover tab also has a hyperlinked index so you can find any section quickly.
Q: Which version of Excel do I need?
A: The model is built with standard Excel functions and contains no macros or VBA, so it runs in Microsoft 365 and recent desktop versions of Excel. Some features, such as charts and data validation, may display differently in other spreadsheet programs.
Q: We only make enterprise and industrial drones, not consumer drones. Will it still work?
A: Yes. Set the demand for any category you don’t sell to zero and it drops out of revenue, production and costs automatically. The same applies to accessories, subscriptions, services or contract manufacturing if they aren’t part of your business.
Q: Can I change the forecast start date?
A: Yes. Change the Model Start Date on the Assumptions tab and every date, month label, fiscal-year header, calendar and escalation across all 19 tabs updates automatically, including the 24 historical months.
Q: Does the model handle production capacity limits?
A: Yes. It compares planned in-house production with maximum line capacity each month. When demand exceeds capacity, in-house production is scaled back, and you can see exactly which months are constrained so you can plan new production lines or more contract manufacturing.
Q: How detailed is the bill of materials?
A: The BOM covers 43 components across electronics, imaging, airframe, power and software/firmware for five drone categories. Component inflation, supplier price changes, scrap and material yield are applied automatically, and a scenario lever lets you test higher or lower BOM costs.
Q: Will this help me raise investment or get a bank loan?
A: It is designed to present the information investors and lenders typically ask for: integrated financial statements, cash runway, funding requirement, debt schedules, DCF valuation, investor IRR and model checks. The quality of the output still depends on the assumptions you enter, so use realistic, supportable figures.
Q: Can I model equity rounds and debt?
A: Yes. You can set equity raises by year and month, an equipment term loan linked to capex, leases, and a revolving credit facility that draws automatically to maintain your minimum cash balance. Dividends and share buybacks can also be included.
Q: How do the scenarios work?
A: Choose Base, Upside or Downside on the Cover tab. Each scenario adjusts volume, price, BOM cost, production yield, maximum capacity utilization and fixed operating costs. The whole model recalculates instantly, and the Scenario Sensitivity tab adds quick EBITDA sensitivities.
Q: How do I know the model is accurate?
A: The Checks tab runs 18 tests every month and year, including the balance sheet check, cash reconciliation, and tie-outs between the P&L and the supporting schedules. The Cover tab shows an overall PASS or REVIEW status, so you’ll know immediately if something needs attention.
Q: Are the numbers in the model real company data?
A: No. The model ships with illustrative figures so you can see how everything works. Replace them with your own historical results and assumptions to create your plan.
Q: Does it use circular references or macros?
A: No. Interest is calculated on opening balances and the revolver is sized before financing, so the model has no circular references and doesn’t need iterative calculation. There are no macros.
Q: Can I add more products, years or departments?
A: The model is fully unlocked, so you can extend it. The structure is consistent across tabs, which makes adding rows straightforward for anyone comfortable with Excel formulas. Contact us with your model spec requirements, there is usually no charge for this.
Final Notes on the Financial Model
This 5 Year Drone Manufacturer Financial Model focuses on balancing capital expenditures with steady revenue growth from a diversified product line. By optimizing operational costs, and power efficiency, and maximizing high-margin services, the models ensure sustainable profitability and cash flow stability.
Download Link On Next Page