
20 Year Construction Materials Financial Model Excel
Financial Model for a Construction Materials Manufacturer
Covering key components such as the Income Statement, Cash Flow Statement, and Balance Sheet, A Discounted Cash Flow (DCF) version with Terminal Value, Sensitivity Analysis, and a WACC Model add-on.
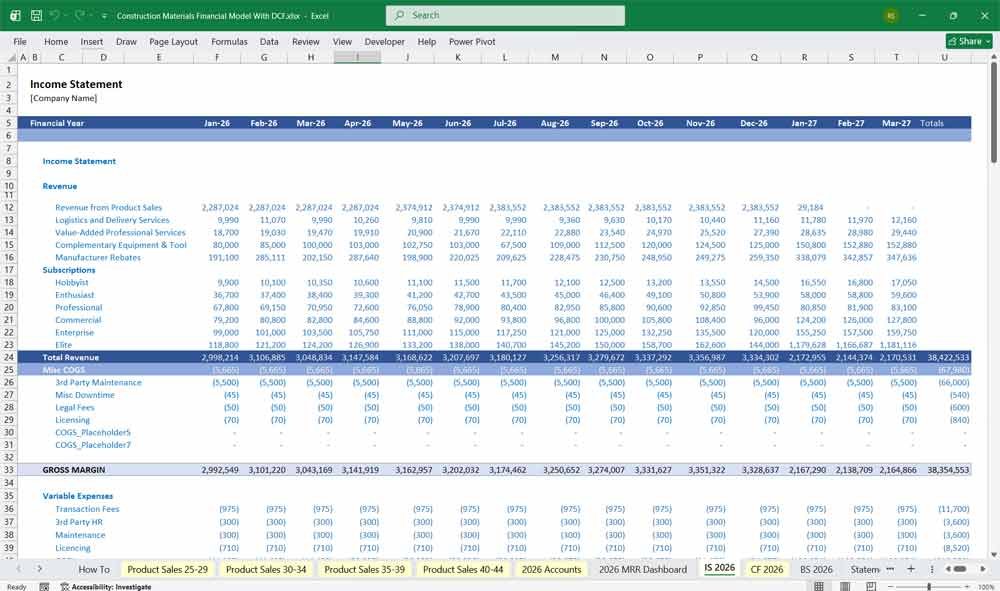
Income Statement (Profit & Loss)
The Income Statement tracks revenues, cost of goods sold (COGS), operating expenses, and profitability over a specific period.
A. Revenue
Revenue is segmented by product line to reflect differing volume drivers, pricing power, and market demand (e.g., residential vs. commercial construction):
Ready-Mix & Precast Concrete: Driven by commercial foundations, infrastructure, and local real estate activity. Measured in cubic yards.
Structural Steel: Driven by high-rise, industrial, and heavy infrastructure projects. Measured in tons.
Dimensional Lumber: Driven heavily by residential framing. Measured in board feet (subject to high commodity price volatility).
Drywall (Gypsum Board): Driven by interior finishing in residential and commercial sectors. Measured in square feet (thousand square feet / MSF).
Flat & Architectural Glass: Driven by commercial facades and residential windows. Measured in square footage/tonnage.
B. Cost of Goods Sold (COGS)
Direct costs required to manufacture and deliver the materials:
Raw Materials: Cement, aggregates, and fly ash (for concrete); iron ore/scrap metal and alloys (for steel); timber logs (for lumber); synthetic/natural gypsum and paper liners (for drywall); silica sand, soda ash, and limestone (for glass).
Direct Labor: Plant operators, kiln workers, rolling mill technicians, and batch plant operators.
Energy & Utilities: High energy costs for melting glass, operating steel electric arc furnaces, and running cement kilns (natural gas, electricity, coal).
Freight & Logistics: Outbound logistics are critical; heavy materials (concrete, steel, drywall) incur substantial shipping costs relative to their value.
C. Gross Profit
Calculated as Total Revenue minus Total COGS. Gross margins vary significantly by product line (e.g., specialty glass or precast concrete often yield higher margins than commodity dimensional lumber).
D. Operating Expenses (OpEx)
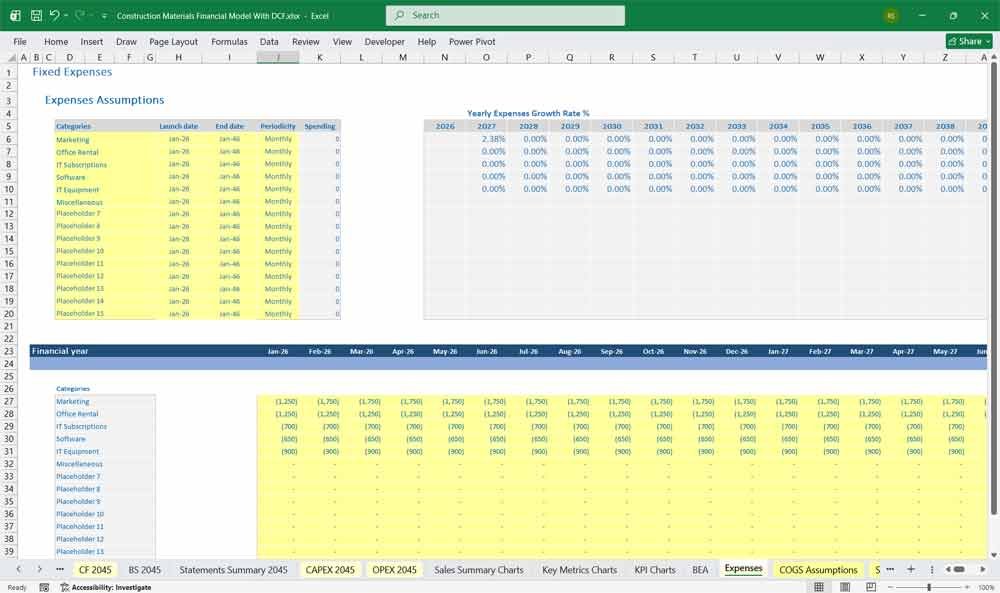
Selling, General, and Administrative (SG&A): Salaries for corporate staff, sales reps targeting general contractors and architects, IT, and legal fees.
Research & Development (R&D): Product development for sustainable/low-carbon materials (e.g., green concrete, recycled steel, eco-friendly drywall formulations).
Marketing & Advertising: Trade shows, industry catalogs, and contractor loyalty programs.
Depreciation & Amortization (D&A): Non-cash expenses related to heavy industrial machinery, kilns, and intellectual property.
E. Operating Income (EBIT)
Gross Profit minus Total Operating Expenses.
F. Below the Line & Net Income
Interest Expense: Cost of servicing debt used to finance capital expenditures (factories, fleet trucks, batch plants).
Taxes: Corporate income tax based on jurisdictional rates.
Net Income: Bottom-line profit carried over to the Retained Earnings and Cash Flow Statement.
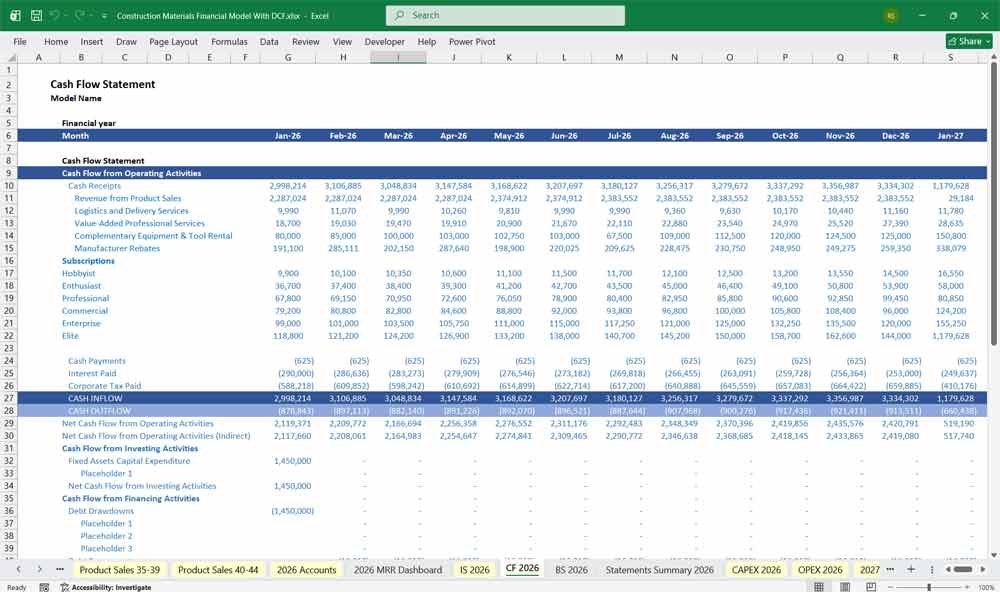
Construction Materials Cash Flow Statement
The Cash Flow Statement reconciles Net Income with actual cash movements, broken down into three core activities.
A. Cash Flow from Operating Activities (CFO)
Begins with Net Income and adjusts for non-cash items and working capital changes:
Add backs: Depreciation and amortization (non-cash charges).
Working Capital Adjustments:
Change in Accounts Receivable: An increase in AR (due to slower contractor payments) reduces operating cash flow.
Change in Inventory: Building up raw lumber or steel stock consumes cash.
Change in Accounts Payable: Extending payment terms with raw material suppliers preserves cash.
B. Cash Flow from Investing Activities (CFI)
Reflects capital allocation toward long-term growth and maintenance:
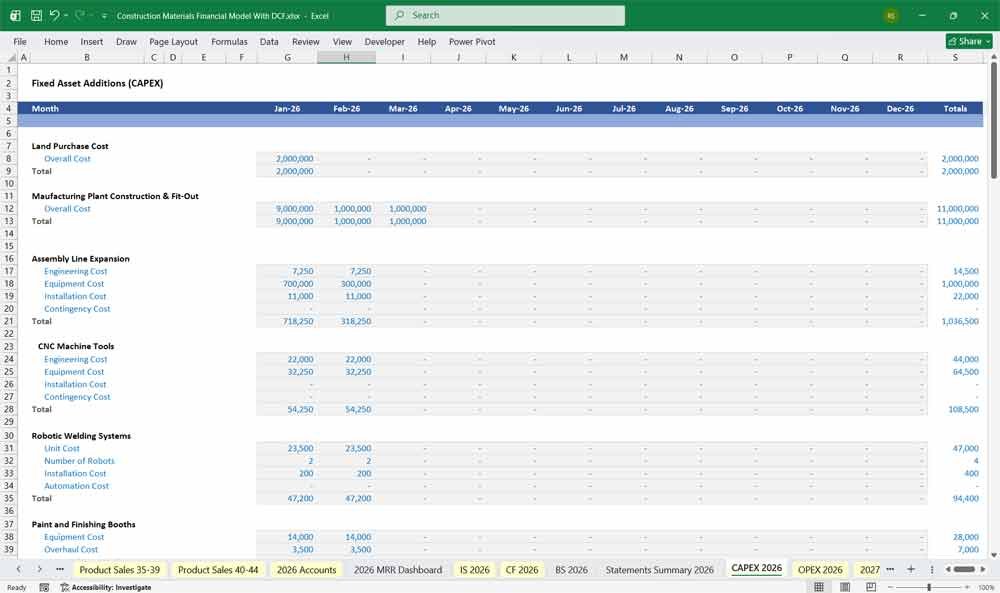
Capital Expenditures (CapEx): Cash spent on maintaining existing kilns/machinery (maintenance CapEx) and building new manufacturing lines for expanded capacity (growth CapEx).
Acquisitions / Disposals: Cash spent on purchasing smaller regional concrete or lumber operations, or proceeds from selling older, underperforming facilities.
C. Cash Flow from Financing Activities (CFF)
Tracks how the business raises capital and pays returns to stakeholders:
Debt Issuance / Repayment: Cash inflows from drawing on new credit lines or long-term loans, offset by cash outflows used to pay down principal debt.
Equity Issuance / Share Buybacks: Capital raised from issuing shares or cash spent buying back stock.
Dividends Paid: Cash distributed to shareholders.
Model Linkage Summary
Net Income flows from the Income Statement into the Cash Flow Statement (Operating Activities) and feeds into Retained Earnings on the Balance Sheet.
Capital Expenditures from the Cash Flow Statement (Investing Activities) update the PP&E balance on the Balance Sheet, which in turn determines the Depreciation expense on the Income Statement.
Ending Cash on the Cash Flow Statement matches the Cash and Cash Equivalents line item on the Balance Sheet, ensuring the model balances.
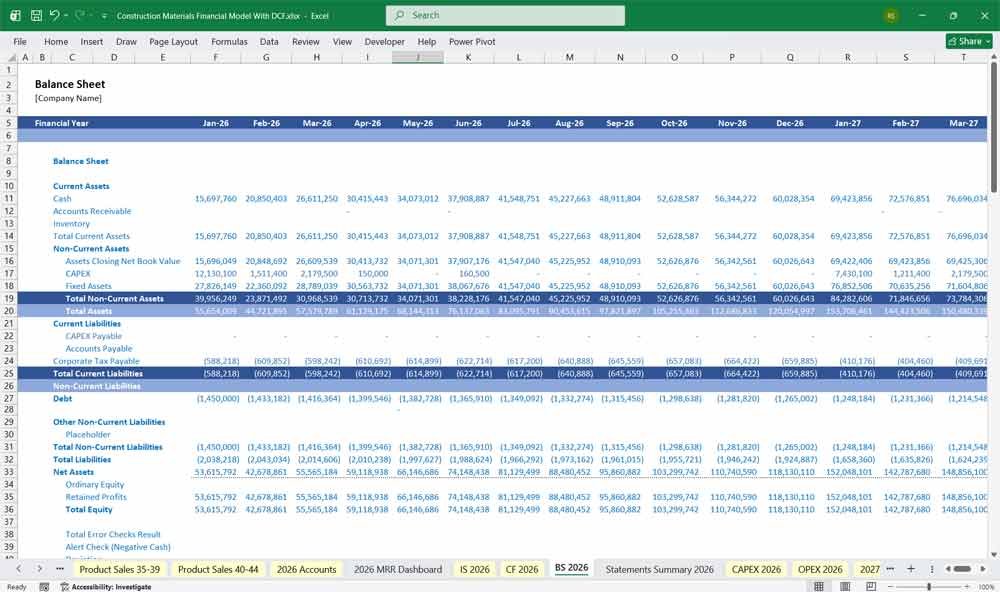
Construction Materials Balance Sheet
The Balance Sheet provides a snapshot of assets, liabilities, and shareholders’ equity at a specific point in time, heavily influenced by physical plant infrastructure and working capital.
A. Current Assets
Cash and Cash Equivalents: Liquid capital for daily operations and payroll.
Accounts Receivable (AR): Money owed by general contractors and developers. Construction terms often feature extended payment cycles (e.g., 60 to 90 days), requiring careful monitoring of Days Sales Outstanding (DSO).
Inventory:
Raw Materials: Unprocessed timber, scrap steel, aggregates, raw chemicals.
Work-in-Progress (WIP): Materials currently in the kiln, curing yard, or rolling mill.
Finished Goods: Stocked drywall bundles, glass sheets, and lumber ready for dispatch.
Prepaid Expenses & Other Current Assets: Insurance policies, short-term prepayments, and maintenance contracts.
B. Non-Current (Long-Term) Assets
Property, Plant, and Equipment (PP&E): The largest asset category. Includes manufacturing plants, rolling mills, kilns, heavy machinery, batching facilities, and a fleet of transit-mix concrete trucks and flatbed semi-trucks.
Intangible Assets & Goodwill: Patents for proprietary chemical admixtures, brand value from historical acquisitions, and mineral/aggregate quarry rights.
C. Current Liabilities
Accounts Payable (AP): Amounts owed to raw material suppliers and energy providers.
Accrued Expenses: Unpaid wages, utilities, and local property taxes.
Short-Term Debt / Current Portion of Long-Term Debt: Debt principal repayments due within the next 12 months.
D. Non-Current Liabilities
Long-Term Debt: Bonds, term loans, and credit facilities utilized to fund major factory expansions, fleet upgrades, or acquisitions.
Deferred Tax Liabilities & Environmental Provisions: Reserves allocated for environmental compliance, land reclamation (for quarries/pits), and carbon tax obligations where applicable.
E. Shareholders’ Equity
Common Stock & Additional Paid-In Capital (APIC): Capital raised through equity issuance.
Retained Earnings: Cumulative net income retained in the business minus dividends paid out.
Key Financial Metrics for a Construction Materials Manufacturer
- Gross Profit Margin = (Gross Profit / Revenue) × 100
- Operating Profit Margin (EBIT Margin) = (EBIT / Revenue) × 100
- Net Profit Margin = (Net Income / Revenue) × 100
- Return on Assets (ROA) = (Net Income / Total Assets) × 100
- Return on Equity (ROE) = (Net Income / Shareholder Equity) × 100
- Debt-to-Equity Ratio = (Total Debt / Shareholder Equity)
- Inventory Turnover = (COGS / Average Inventory)
- Days Sales Outstanding (DSO) = (Accounts Receivable / Revenue) × 365
Editable Product Lines Example Structure:
Concrete
Revenue from Sales: Revenue is generated by selling ready-mix concrete and precast elements to general contractors, infrastructure developers, and commercial builders, typically priced per cubic yard. Pricing power is influenced heavily by local market dynamics, transport radius limitations, and specialized mix requirements (such as high-strength or low-carbon formulations).
Manufacturing Costs: Production involves blending raw ingredients—primarily cement, aggregates (sand and gravel), water, and chemical admixtures—alongside substantial energy consumption for mixing and fleet maintenance. Because wet concrete has a strictly limited shelf life, outbound logistics and transit-mix truck fuel represent a disproportionately large share of total operational costs.
Structural Steel
Revenue from Sales: Sales are driven by large-scale commercial, industrial, and heavy civil infrastructure projects like bridges and high-rise towers, with products measured and priced by the ton. Revenue fluctuations are closely tied to global metal index prices, project scale, and the timing of multi-year construction pipelines.
Manufacturing Costs: The primary cost drivers include heavy raw materials such as iron ore, scrap metal, and metallurgical coal or electricity to power electric arc furnaces. Additionally, high energy demands for melting and rolling, strict quality-control testing, and heavy-haul freight logistics heavily impact the bottom line.
Dimensional Lumber
Revenue from Sales: Revenue stems from supplying framing materials for residential homebuilding, multi-family construction, and light commercial projects, measured in board feet. This revenue stream is historically volatile due to sensitivity to lumber futures markets, seasonal housing cycles, and shifting macroeconomic interest rates.
Manufacturing Costs: Costs are anchored by the procurement of raw timber logs from forestry operations, followed by energy-intensive sawmill processing and kiln-drying. Transporting bulky logs to mills and finished lumber to regional distribution yards also adds significant variable freight expense.
Drywall
Revenue from Sales: Sales are generated by providing gypsum wallboard for interior wall and ceiling installations across residential and commercial sectors, priced per thousand square feet (MSF). Volume depends heavily on the finishing stages of real estate development and interior remodeling activity.
Manufacturing Costs: Production costs center on acquiring natural or synthetic gypsum rock and heavy paper liners, coupled with substantial natural gas energy required to run calcining and drying kilns. Because drywall is heavy, fragile, and prone to transit damage, specialized packaging and freight logistics form a critical portion of total production outlays.
Glass
Revenue from Sales: Revenue comes from supplying flat, laminated, or tempered architectural glass for commercial building facades, storefronts, and residential windows, measured by surface area and thickness. High-value specialty products, such as energy-efficient low-E coatings or bullet-resistant glass, command premium pricing.
Manufacturing Costs: The cost structure is dominated by continuous, high-heat furnace operations that melt silica sand, soda ash, and limestone around the clock, creating massive natural gas and electricity expenses. Precision cutting, tempering treatments, and specialized rack transport to prevent breakage further increase manufacturing and distribution overhead.
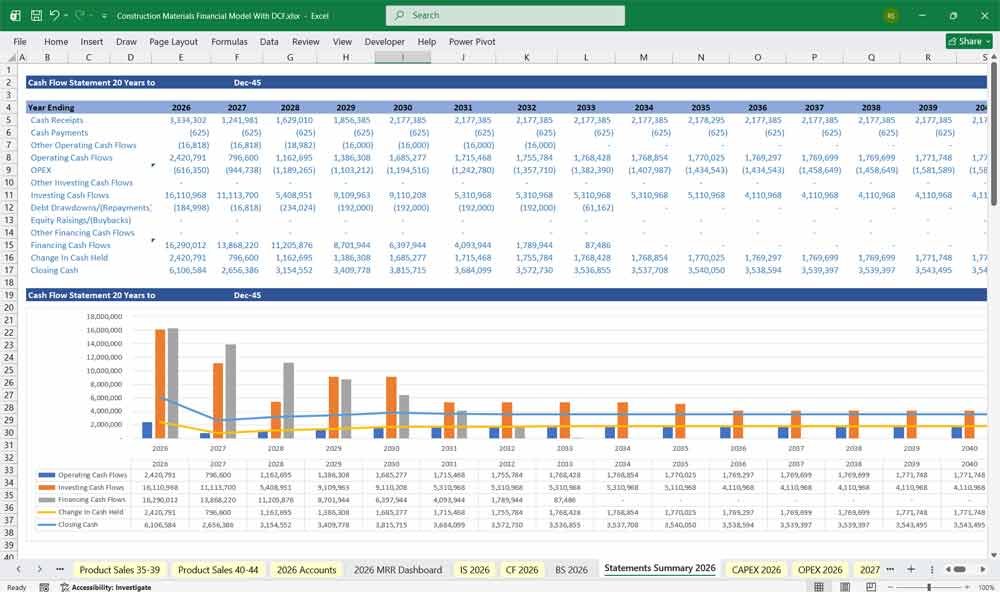
Value Your Construction Materials Company With A DCF
20-Year DCF: Valuing Production Capacity and Infrastructure Cycles
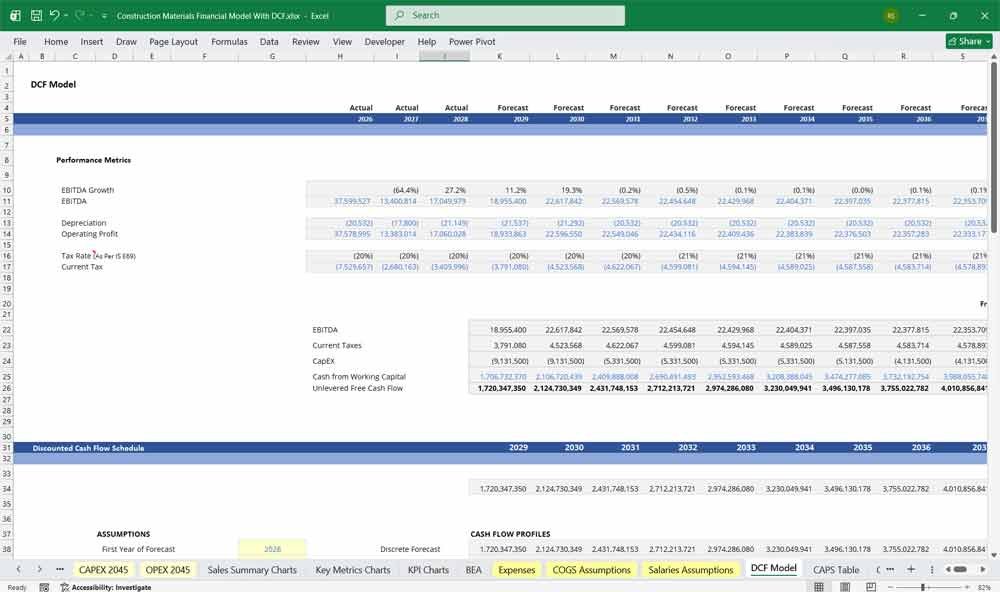
In a 20-year Discounted Cash Flow (DCF) analysis for a construction materials manufacturer (producing cement, concrete, aggregates, or steel rebar), the valuation focuses on factory output volumes, localized real estate demand, and heavy capital efficiency. The model projects cash flows driven by bulk supply contracts across residential, commercial, and civil infrastructure projects, offset by heavy CapEx for automated kilns, mixing plants, quarrying equipment, and environmental compliance systems. A 20-year horizon aligns with regional construction spending cycles and major infrastructure bill deployments. Consequently, the Terminal Value in Year 5 carries significant weight, pricing in the manufacturer’s long-term quarry reserves, strategic plant locations, and established supply chain logistics within its geographic distribution radius.
WACC: Pricing Cyclical Demand and Asset-Backed Debt
The Weighted Average Cost of Capital (WACC) for a construction materials manufacturer typically ranges from 8.0% to 11.0%, reflecting a capital structure supported by substantial physical collateral. Because these companies own specialized industrial real estate, heavy machinery, and raw material reserves, they can secure cost-effective asset-backed debt and industrial revenue bonds to lower their overall borrowing costs. However, the Cost of Equity carries a premium for “Construction and Cyclical Beta.” Investors demand a higher hurdle rate to account for sensitivity to interest rate hikes, volatile energy prices (for kiln firing and transport logistics), and the cyclical nature of broader housing starts and public works spending.
Sensitivity Analysis: Stress-Testing Energy Costs and Utilization Rates
For a construction materials manufacturer, Sensitivity Analysis is the primary tool for testing profit resilience against input cost shocks and volume contractions. Financial analysts build sensitivity matrices to observe how a 15% spike in energy/fuel expenses (which often represent 20–30% of total manufacturing costs) or a 10% decline in realized selling prices per ton impacts the company’s EBITDA margins and free cash flow. The most critical variables to cross-reference are Plant Capacity Utilization % and Freight/Delivery Costs per Unit. Because heavy industrial plants carry high fixed overhead, running below optimal capacity or absorbing rising diesel costs to reach distant job sites rapidly erodes gross margins, making this matrix vital for identifying operational break-even points.
Final Notes on the Financial Model
Financial model for a Construction Materials manufacturer
- Scenario Analysis: Create best-case, base-case, and worst-case projections.
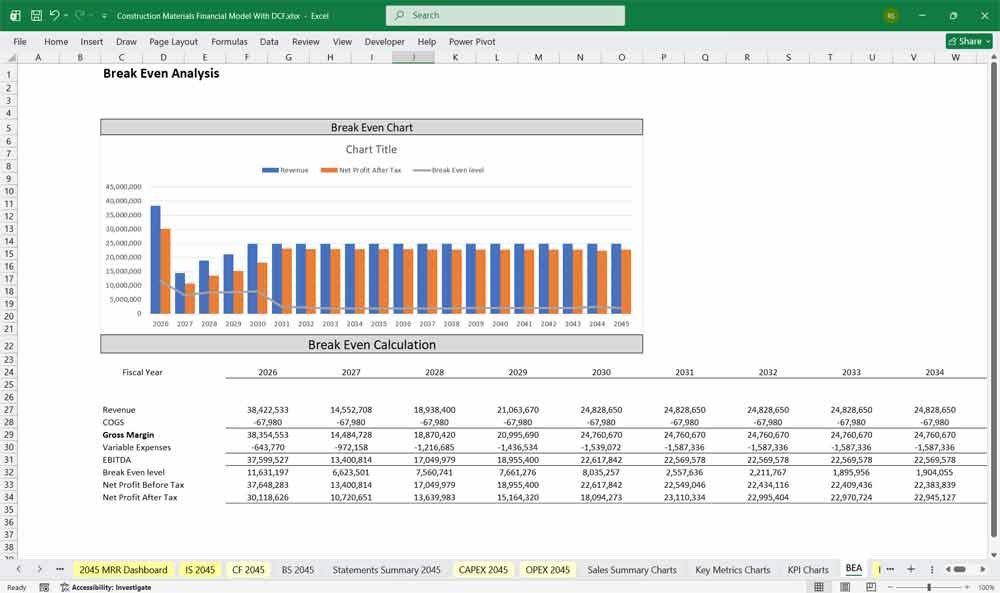
- Break-even Analysis: Determine sales volume required to cover fixed & variable costs.
- Sensitivity Analysis: Assess how changes in raw material costs, pricing, or demand impact profitability.
These structured finance models other help a materials manufacturing company address a broad market spectrum, offering the right balance between cost, production capacity, support.
Download Link On Next Page
Download Link On Next Page