
Construction Equipment Manufacturer Model Template
The Construction Equipment Manufacturer Model Template is an integrated Excel financial model built for heavy machinery and construction equipment OEMs. It covers earthmoving, road construction, lifting, material handling, concrete and agricultural equipment. It combines three years of monthly historical financials with a five-year monthly forecast and annual roll-ups. Revenue, production, cost of goods sold, working capital, capital expenditure, debt and valuation all link through a three-statement financial model. Whether you are building a business plan, preparing an investor pitch, supporting a bank loan application or running an M&A valuation, this construction equipment financial model gives you a professional, lender-ready starting point.
DCF Financial Model for a Construction Equipment Manufacturer
The forecast is driven from the bottom up, the way a real equipment manufacturer runs its business. Unit sales by product (excavators, bulldozers, wheel loaders, cranes, telehandlers, forklifts, concrete pumps and more) are multiplied by average selling prices to build equipment revenue. Aftermarket parts, maintenance, repair, extended warranty and rental revenue are layered on top. On the cost side, the model builds manufacturing costs from raw materials (steel, aluminium, copper), components (engines, transmissions, hydraulics), direct labour, factory overheads and warranty provisions. The model also tracks order intake, order backlog, book-to-bill ratio, production capacity and capacity utilisation, so the forecast reflects how a manufacturing business actually operates.
Every assumption sits on one Assumptions tab, and every date in the workbook runs from a single model start date. Change that date and the entire model re-dates itself automatically. A scenario switch lets you flip between Base, Upside and Downside cases in one click. The integrated income statement, balance sheet and cash flow statement balance in every month, and a dedicated Checks tab confirms it. The valuation section includes a full discounted cash flow (DCF) analysis, WACC calculation, trading comparables, precedent transactions, sensitivity tables and a KPI dashboard. The colour-coded layout makes the model ready for investors, lenders and private equity buyers.
What’s Inside: Tab-by-Tab Overview
01. Cover & Contents
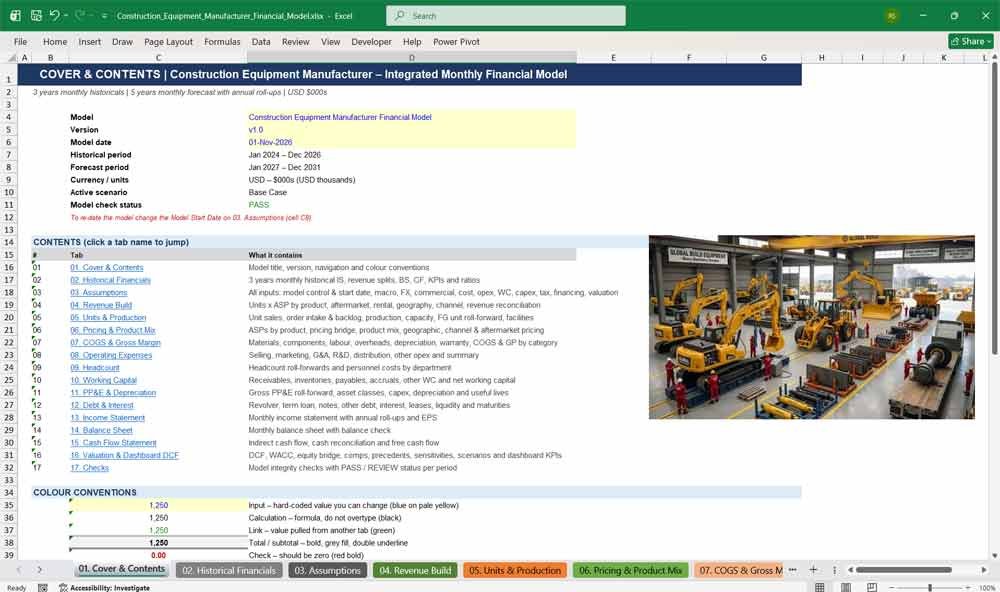
The cover page gives the construction equipment financial model a professional front end, showing the model title, version, historical and forecast periods, currency, active scenario and live model check status, plus clickable navigation to every tab and colour conventions.
- Clickable hyperlinked table of contents for all 17 tabs
- Live display of active scenario and PASS/REVIEW model status
- Historical and forecast periods update automatically from the start date
- Colour-coding legend for inputs, calculations, links, totals and checks
- Key modelling notes explaining the methodology
02. Historical Financials
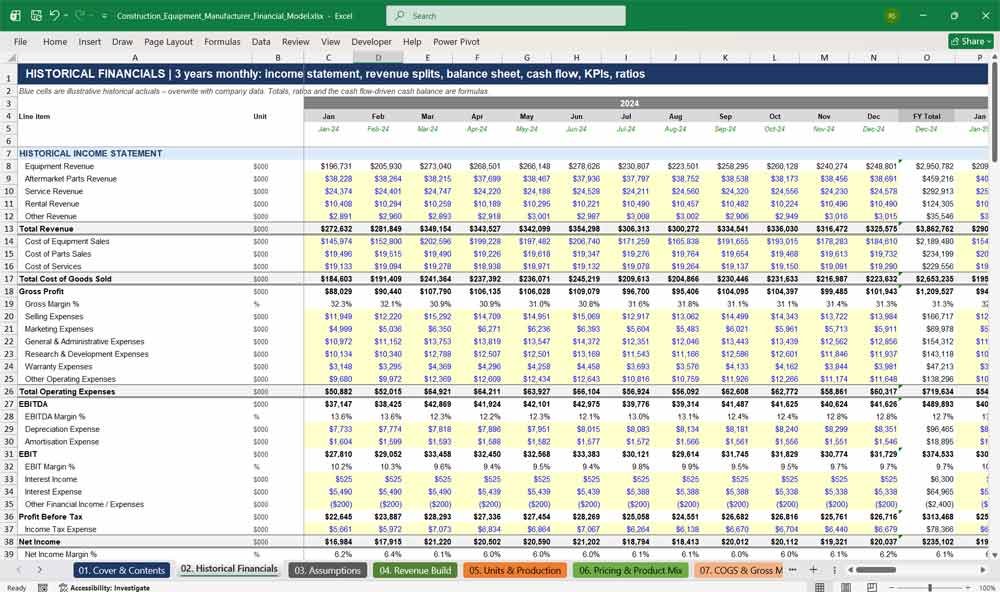
Three years of monthly historical financial statements for a construction equipment manufacturer, including the income statement, balance sheet, cash flow statement, revenue by product category and geography, operating KPIs and financial ratios, providing the baseline the forecast builds from.
- 36 months of historical income statement, balance sheet and cash flow
- Revenue split by product category and by geography
- Operating KPIs: units sold, order backlog, book-to-bill, capacity utilisation, headcount
- Financial ratios: margins, ROIC, ROE, net debt / EBITDA, interest coverage, current and quick ratios
- Built-in historical balance sheet check
03. Assumptions
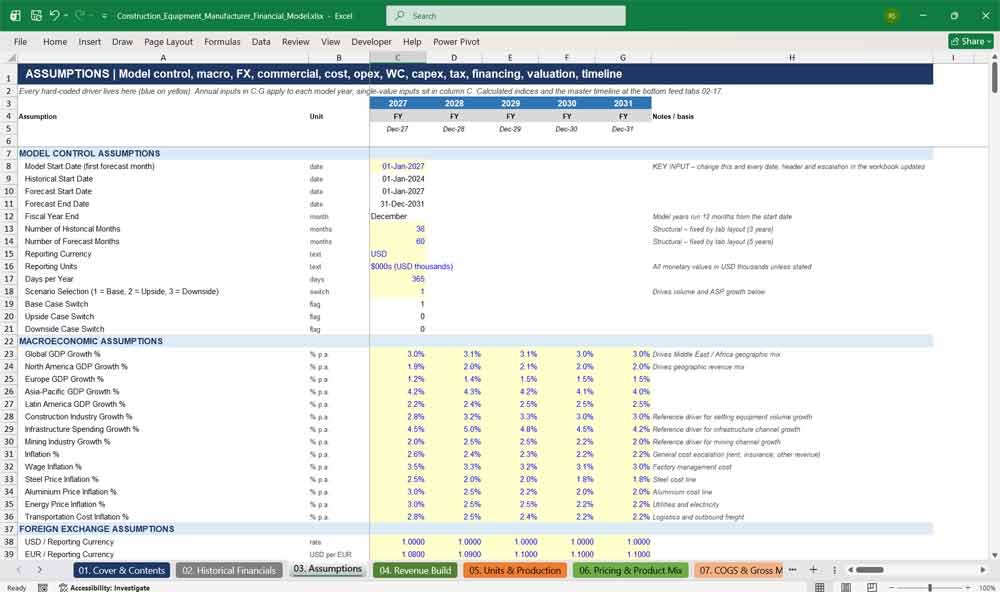
The central control panel for the financial model, holding every input: model start date, scenario switch, macroeconomic drivers, FX rates, commercial growth, manufacturing efficiency, cost inflation, operating expenses, working capital days, capex, tax, financing and valuation assumptions, all clearly colour-coded.
- One Model Start Date drives every date across the workbook
- Base, Upside and Downside scenario selector
- Macroeconomic, steel, aluminium, energy and wage inflation inputs
- Working capital days, capex, tax, debt and WACC assumptions
- Calculated price, volume and cost indices plus master monthly timeline
Construction Equipment Manufacturer Revenues & Production
04. Revenue Build
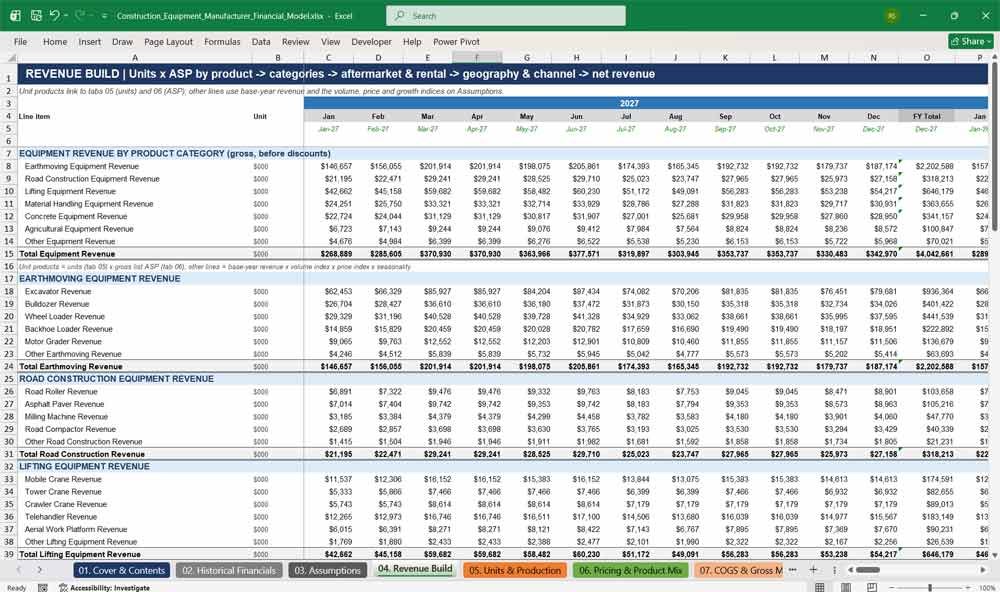
A detailed bottom-up revenue model for construction machinery, calculating equipment revenue as units × average selling price for each product, then adding aftermarket parts, service and rental revenue, and analysing net revenue by geography and sales channel, from gross revenue to net revenue.
- Revenue for 30 equipment lines across six product categories
- Aftermarket revenue: spare parts, components, maintenance, repair, field service, extended warranty
- Rental revenue: short-term, long-term and fleet services
- Revenue by geography (six regions) and by sales channel (seven channels)
- Gross-to-net reconciliation with discounts, rebates and returns
05. Units & Production
Models the physical operations of an equipment manufacturer: monthly unit sales by product, order intake and backlog, production volumes, manufacturing capacity and utilisation, factory downtime, yield and scrap, a finished goods unit reconciliation and production by regional facility.
- Unit sales for 15 product types with monthly seasonality
- Order book: new orders, cancellations, backlog, book-to-bill, backlog coverage
- Manufacturing capacity, expansion, retirement and utilisation %
- Production days, downtime, yield, scrap and rejected units
- Finished goods unit roll-forward and production by region
06. Pricing & Product Mix
Tracks average selling prices for every equipment type, with a pricing bridge from list price increases through dealer discounts, rebates, FX impact and product mix. It also covers geographic pricing, sales channel pricing and aftermarket revenue per installed unit.
- Average selling price (ASP) for 15 equipment products
- Price bridge: list price, realised price, discounts, FX and mix effects
- Product mix % by equipment category
- Geographic and sales channel ASP premiums and discounts
- Installed base and aftermarket revenue per installed unit
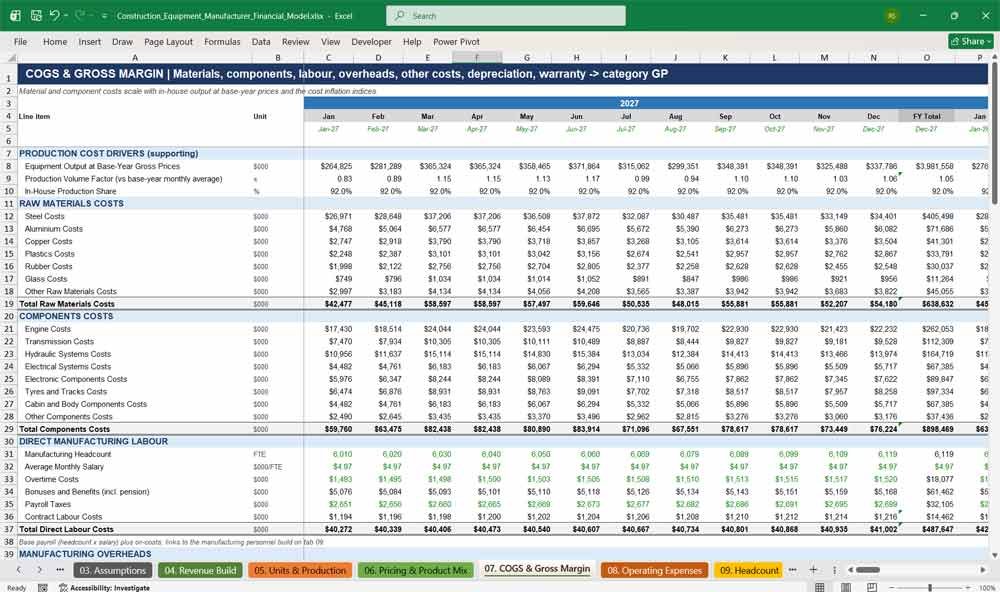
07. COGS & Gross Margin
A full manufacturing cost of goods sold build covering raw materials, components, direct labour, factory overheads, freight, outsourced production, scrap, manufacturing depreciation and warranty provisions. It also calculates COGS and gross margin by product category with manufacturing cost per unit KPIs.
- Raw material costs: steel, aluminium, copper, plastics, rubber, glass
- Component costs: engines, transmissions, hydraulics, electronics, tyres and tracks
- Overheads that flex with volume, split into fixed and variable
- Warranty provision roll-forward and warranty expense %
- Gross profit and gross margin by product category, plus cost per unit
08. Operating Expenses
Forecasts all operating expenses for a heavy equipment business: selling, marketing, general and administrative, research and development, distribution and logistics, and other operating costs, with personnel costs linked to headcount and non-recurring items flagged for adjusted EBITDA.
- Selling costs including commissions, dealer support and dealer incentives
- Marketing: advertising, digital, trade shows and product demonstrations
- R&D: engineering salaries, prototypes, testing and regulatory compliance
- Distribution and logistics expense build
- Opex % of revenue and adjusted EBITDA add-backs
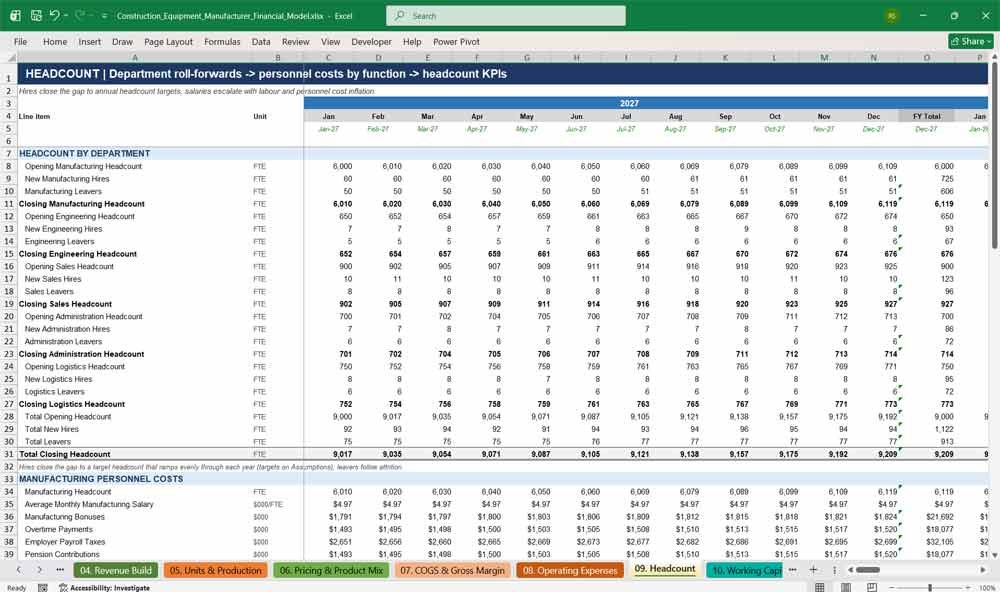
09. Headcount
A workforce planning schedule with monthly roll-forwards for manufacturing, engineering, sales, administration and logistics staff, covering hires and leavers. It calculates salaries, bonuses, overtime, payroll taxes, pensions and benefits by department, plus revenue and EBITDA per employee KPIs.
- Opening headcount, hires, attrition and closing headcount by department
- Manufacturing headcount linked to production volume and productivity
- Fully loaded personnel costs by function
- Revenue per employee and EBITDA per employee
- Personnel costs as a % of revenue
Construction Equipment Manufacturer Financial Statements
10. Working Capital
Models working capital for an equipment manufacturer: accounts receivable, raw materials, work-in-progress and finished goods inventory, accounts payable, accrued expenses, customer advances and deferred revenue. It calculates net working capital, monthly movements and the cash conversion cycle.
- Receivable, inventory and payable days drivers
- Separate raw materials, WIP and finished goods inventory roll-forwards
- Customer advances linked to the order backlog
- Net working capital and change in NWC
- Cash conversion cycle and NWC % of revenue
11. PP&E & Depreciation
A fixed asset schedule with a gross PP&E roll-forward across eleven asset classes, a capital expenditure breakdown, accumulated depreciation and straight-line depreciation by asset category using individual useful lives. It also handles disposals, acquisitions, construction in progress and FX movements.
- Capex split: maintenance, replacement, expansion, new factory, machinery, IT, environmental
- Gross PP&E by asset class: land, buildings, factories, machinery, vehicles, IT
- Construction in progress transfers to operating assets
- Depreciation by asset category with adjustable useful lives
- Capex / revenue, capex / depreciation and PP&E turnover KPIs
12. Debt & Interest
Schedules every financing facility: revolving credit facility, term loan, senior notes and other borrowings, with interest, commitment fees, lease liabilities, cash and liquidity, debt maturity profile and covenant metrics. The revolver automatically draws or repays to maintain minimum cash, without circular references.
- Automatic revolver cash sweep against a minimum cash balance
- Term loan amortisation, senior notes and other debt schedules
- Interest expense, commitment fees and arrangement fees
- IFRS 16 lease liability roll-forward
- Net debt / EBITDA, interest coverage and covenant headroom
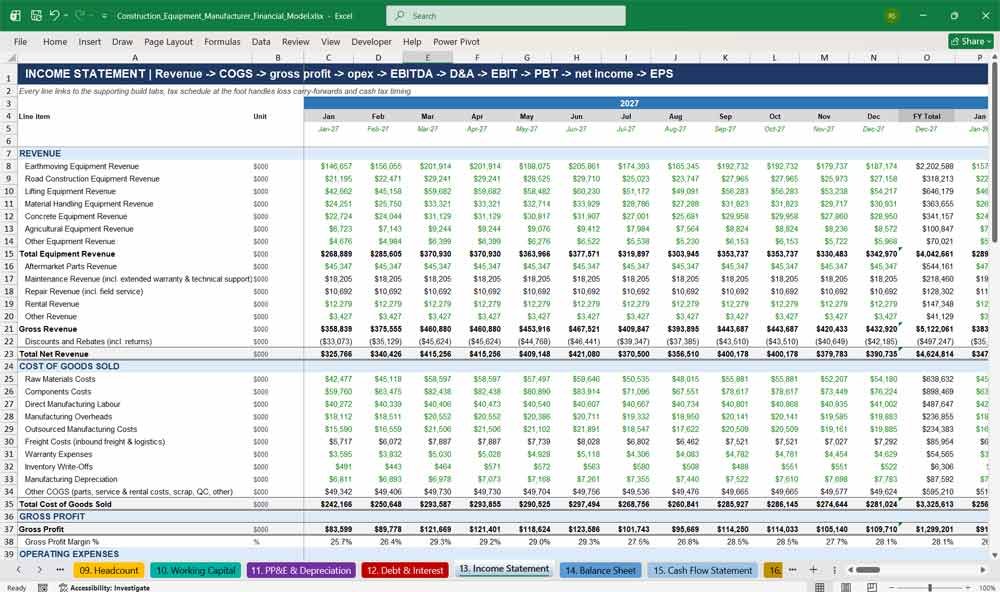
13. Income Statement
A fully integrated monthly profit and loss statement with annual totals, flowing from revenue by product category through cost of goods sold, gross profit, operating expenses, EBITDA, adjusted EBITDA, depreciation and amortisation, EBIT, financial items, tax and net income, through to earnings per share.
- Revenue by equipment category, aftermarket and rental
- EBITDA and adjusted EBITDA with non-recurring add-backs
- Interest, lease interest and FX gains or losses
- Tax schedule with loss carry-forwards and cash tax timing
- Basic and diluted EPS and dividends per share
14. Balance Sheet
A monthly forecast balance sheet covering current assets, inventory by stage, PP&E by asset class, goodwill, intangibles, right-of-use assets, current and non-current liabilities, provisions, debt, leases and shareholders’ equity. A balance check confirms it balances to zero every month.
- Cash, receivables and inventory by raw materials, WIP and finished goods
- Gross PP&E, accumulated depreciation and net PP&E
- Goodwill, software, patents and capitalised development costs
- Warranty, environmental and restructuring provisions
- Balance check equal to zero in all 60 forecast months
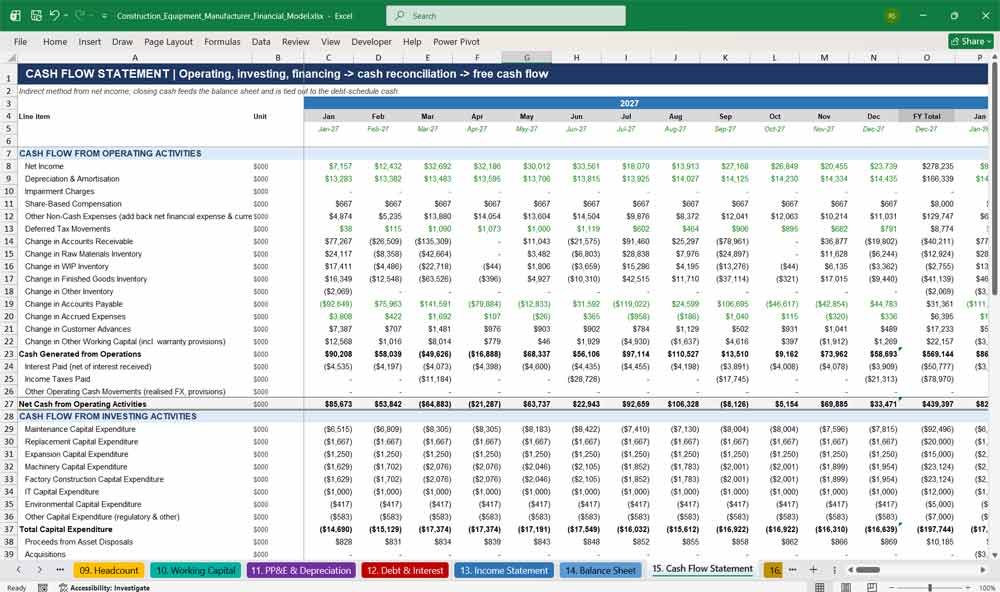
15. Cash Flow Statement
An indirect-method cash flow statement for the construction equipment business, showing operating, investing and financing cash flows, a cash reconciliation tied to the balance sheet, and unlevered and levered free cash flow with FCF conversion and free cash flow yield.
- Detailed working capital movements by inventory stage
- Capex broken out by type within investing cash flow
- Debt drawdowns, repayments, dividends and share buybacks
- Cash reconciliation check against the debt schedule
- Unlevered free cash flow, levered free cash flow and FCF conversion
Key Financial Metrics for a Construction Equipment Manufacturer
16. Valuation & Dashboard DCF
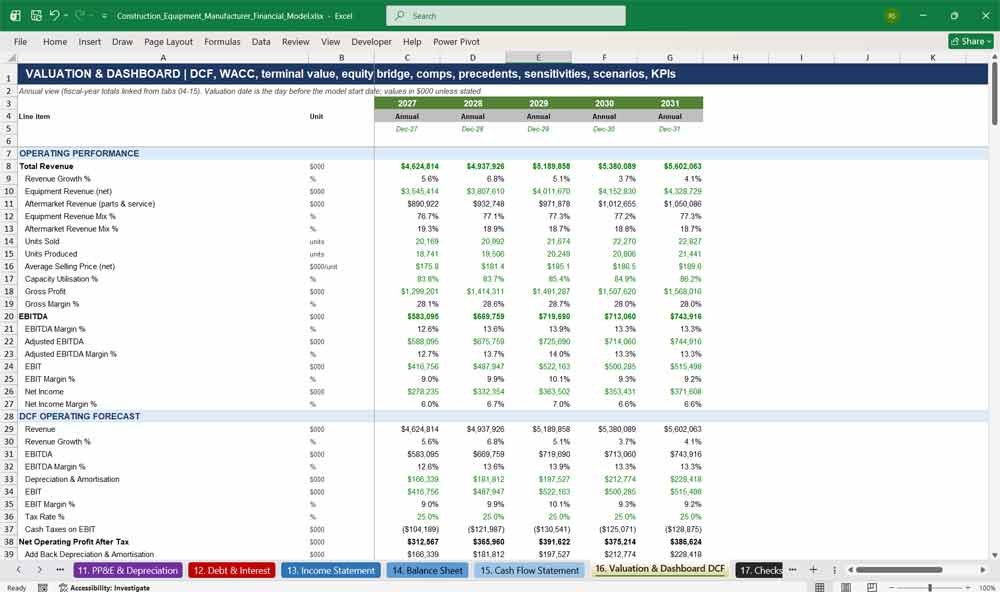
A complete valuation and KPI dashboard: discounted cash flow analysis, WACC calculation, terminal value by perpetuity growth and exit multiple, equity bridge, trading comparables, precedent transactions, sensitivity tables, scenario analysis and an implied share price, with charts for revenue, EBITDA and free cash flow.
- DCF with mid-year discounting switch and WACC build
- Terminal value by perpetuity growth and exit EBITDA multiple
- Trading comparables and precedent transaction multiples
- Sensitivity tables: WACC vs growth, WACC vs exit multiple, revenue growth vs EBITDA margin
- Base, Upside and Downside comparison plus a 29-metric KPI dashboard
17. Checks
A model integrity tab that collects tie-out checks across the workbook, including balance sheet balance, cash reconciliation, revenue splits, EBITDA, COGS, PP&E, debt maturities, production and labour, and returns a PASS or REVIEW status for every period and overall.
- 11 monthly integrity checks across all 60 forecast months
- 10 structural checks on input splits and historical data
- Period-by-period PASS / REVIEW flags
- Overall model status shown on the cover page
- Gives lenders and investors confidence in every number
Why Buy This Model
Building a three-statement financial model for a construction equipment manufacturer from scratch can take weeks of specialist work. This model gives you that work done, structured the way bankers, private equity analysts and corporate finance teams expect to see it. It is built specifically for heavy equipment manufacturing, not adapted from a generic template. It models the things that drive value in this industry: unit volumes and pricing by machine type, order backlog, factory capacity, steel and component cost inflation, warranty exposure and the high-margin aftermarket business. Every forecast number is a live formula tied back to one Assumptions tab, so you can test a new scenario in seconds. The balance sheet balances, the cash flow reconciles, and the Checks tab proves it. Change one start date and the whole model re-dates itself. If you need a credible, investor-ready construction equipment financial projection for fundraising, bank financing, budgeting, acquisition analysis or valuation, this model saves you time and gives you a result you can present with confidence.
Construction Equipment Manufacturing Frequently Asked Questions
Who is this financial model for?
It is designed for founders, CFOs, finance teams, investors, private equity firms, investment bankers, lenders and consultants working with construction equipment, heavy machinery or industrial equipment manufacturers. It also works well for MBA students and analysts learning how a manufacturing business is modelled.
Can I use it for a real company, or is it just a template?
You can use it for a real company. The historical figures included are illustrative placeholders that show how the model works. Replace the blue input cells on the Historical Financials and Assumptions tabs with your company’s data and the forecast updates automatically.
What period does the model cover?
It includes three years of monthly historical data and a five-year monthly forecast, with an annual total column for every year. The default start date is January 2027. You can change it to any month you need.
How do I change the start date of the model?
Enter a new Model Start Date on the 03. Assumptions tab. Every date, month label, year header and timing calculation across all 17 tabs updates automatically. No manual re-work is needed.
Do I need advanced Excel skills to use it?
No. Inputs are clearly marked in blue on a yellow background, so you only change those cells. Formulas are in black and links to other tabs are in green. The cover page includes clickable navigation and a colour-coding legend. Basic Excel knowledge is enough to run scenarios. Intermediate skills help if you want to customise the structure.
Does the model include scenario analysis?
Yes. A scenario switch on the Assumptions tab lets you run Base, Upside or Downside cases, each with its own volume growth and price growth assumptions. The valuation tab also shows all three cases side by side for revenue, EBITDA, free cash flow and enterprise value.
Does the balance sheet balance?
Yes. The integrated balance sheet balances in every month of the forecast and the historical period. The cash flow statement reconciles to the balance sheet cash. The 17. Checks tab shows a PASS status for every period.
What valuation methods are included?
The model includes a discounted cash flow (DCF) valuation using both the perpetuity growth and exit EBITDA multiple methods. It also includes a full WACC calculation, trading comparables, precedent transactions and an equity value bridge to an implied share price. You can choose the selected valuation method or use the average of all four.
Are the trading comparables and precedent transactions real?
No. They are illustrative placeholders that show how the analysis works. Replace them with sourced market data from your own research or data provider before relying on the valuation output.
Which types of equipment are covered?
The model covers earthmoving equipment (excavators, bulldozers, wheel loaders, backhoe loaders, motor graders), road construction equipment (rollers, asphalt pavers, milling machines), lifting equipment (mobile, tower and crawler cranes, telehandlers, aerial work platforms), material handling (forklifts, reach trucks), concrete equipment (pumps, mixers, batching plants), agricultural equipment and other machinery.
Can I add or remove product lines?
Yes. Unit sales and selling prices are set per product on the Assumptions tab. Setting a product’s base units or revenue to zero removes it from the forecast without breaking any formulas. Adding brand-new rows needs some Excel knowledge to extend the formulas, in the same way as the existing lines.
Does it model the aftermarket and rental business?
Yes. Aftermarket revenue covers spare parts, replacement components, maintenance, repair, field service, extended warranty and technical support. Rental revenue covers equipment rental, short-term and long-term rental and fleet services. Each has its own growth rate and cost of sales.
How are manufacturing costs calculated?
Raw materials and component costs scale with in-house production volume and their own inflation rates, including separate steel and aluminium inflation. Direct labour comes from the Headcount tab. Factory overheads are split between fixed and variable costs. Outsourced production, freight, scrap, quality control, inventory write-offs and warranty are all modelled separately.
Does the model contain circular references or macros?
No. Interest is calculated on opening debt balances, so the model has no circular references. It contains no macros or VBA, so it opens cleanly in Excel without security warnings.
Is it suitable for raising investment or applying for a bank loan?
Yes. The model follows the formatting conventions lenders and investors expect: colour-coded inputs, clear section headers, totals with borders, visible tie-out checks and debt metrics such as net debt to EBITDA, interest coverage and covenant headroom.
Which version of Excel do I need?
The model works in Microsoft Excel 2010 or later on Windows and Mac. It uses standard Excel functions throughout and avoids newer dynamic array functions, so it is widely compatible. It also opens in Google Sheets and LibreOffice, although some formatting may vary.
What currency is the model in?
The model is in US dollars, with all figures in thousands ($000s). Foreign exchange assumptions for EUR, GBP, CNY and JPY are included, and you can relabel the reporting currency on the Assumptions tab if you work in another currency.
Final Notes on the Financial Model
Financial model for a Construction Equipment manufacturer
- Scenario Analysis: Create best-case, base-case, and worst-case projections.
- Break-even Analysis: Determine sales volume required to cover fixed & variable costs.
- Sensitivity Analysis: Assess how changes in raw material costs, pricing, or demand impact profitability.
This structured model bundle helps any Construction Equipment manufacturing company address a broad market spectrum, offering the right balance between cost, production capacity, and support.