
Cement Factory Financial Model Template
This cement plant financial model template is a fully-linked, investor-ready Excel template built for anyone planning, financing, or evaluating a greenfield cement manufacturing project. Covering a full 2-year construction period and a 20-year operating horizon, this cement factory financial model turns a complex industrial build into a single, formula-driven workbook: every date, every cost, and every financial statement flows automatically from one start-date input, so the entire 22-year timeline re-dates itself the moment you change a single cell. Whether you’re a project developer preparing a feasibility study, a lender underwriting a construction loan, an investor screening a cement industry opportunity, or a finance student learning how a real project finance model is built, this template gives you a bankable, audit-ready foundation instead of a blank spreadsheet.
20-year Financial Model for a Cement Factory
Unlike generic financial model templates that bury operations behind a simple “revenue growth %” assumption, this cement plant Excel model is built bottom-up from the physical plant itself: installed clinker and cement capacity, utilization rates, the clinker-to-cement ratio, raw material consumption (limestone, gypsum, additives), thermal and electrical energy use, fuel mix economics, and carbon/CO2 costs all feed forward into production volumes, unit costs, and ultimately into revenue and margin. That means every number on the Income Statement, Cash Flow Statement, and Balance Sheet can be traced back to an operating driver you can see and adjust — exactly how banks, private equity funds, and infrastructure investors expect a cement industry financial model to be built.
With 21 fully-linked tabs — from Assumptions and Production through Debt Financing, Tax, Returns/Valuation, DCF, Scenario Sensitivities, and an executive Dashboard — this cement manufacturing financial model gives you everything needed to calculate Project IRR, Equity IRR, NPV, MOIC, and Enterprise Value, stress-test the deal under different price and cost scenarios, and hand a lender a model with built-in tie-out checks on every balance sheet, cash reconciliation, and working capital line. Download it, plug in your own project’s numbers, and you have a professional cement plant feasibility model ready for board decks, lender data rooms, or your own investment committee.
Why Buy This Model
Building a cement plant financial model from scratch takes weeks — sourcing the right formula architecture, getting a 20-year balance sheet to actually balance, and making sure construction-period interest, deferred financing fees, and working capital roll forward correctly is where most DIY models break. This template gives you that engineering already done: a proven, fully-balanced 3-statement model built around real cement industry operating drivers (clinker ratio, energy intensity, fuel mix, carbon cost) rather than generic growth assumptions, so you can spend your time on your project’s actual numbers instead of debugging spreadsheet plumbing. Every input cell is clearly color-coded and editable, every output is a live formula, and the built-in Checks tab flags any tie-out issue instantly — so whether you’re pitching lenders, running sensitivities for an investment committee, or teaching project finance, you’re working from a model that’s already bankable, not one you have to first prove is correct.
Tab-By-Tab Highlights
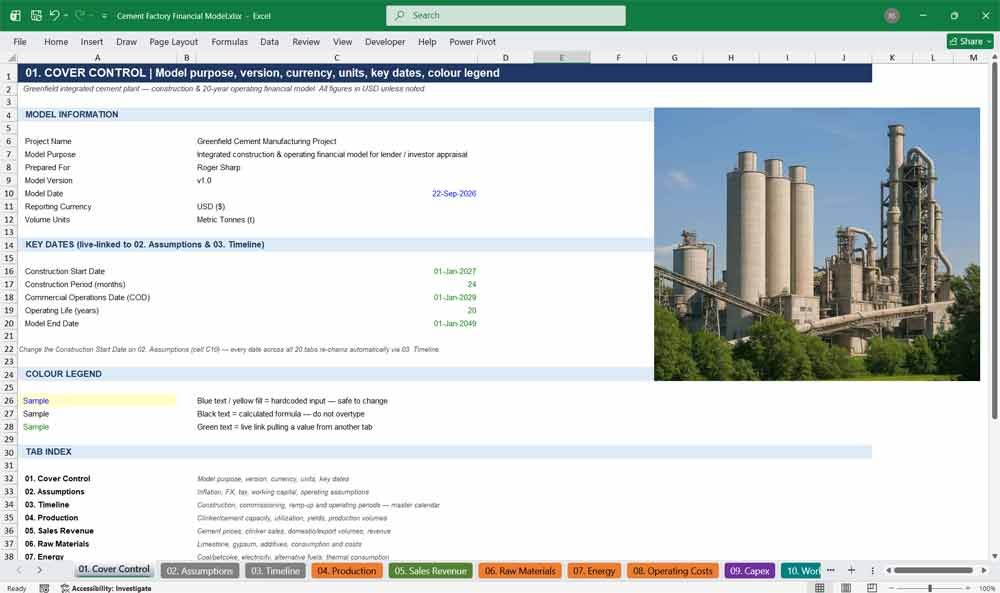
01. Cover Control
Your cement plant model’s control center — project overview, currency and unit settings, color-coding legend, and a full tab index. This cover sheet gives lenders, investors, and analysts instant orientation before they open a single financial statement in the workbook.
- One-click navigation to all 21 model tabs
- Color legend for inputs (blue), formulas (black), and cross-tab links (green)
- Project name, currency, units, and model purpose summary
- Sets the professional, lender-ready tone of the entire financial model
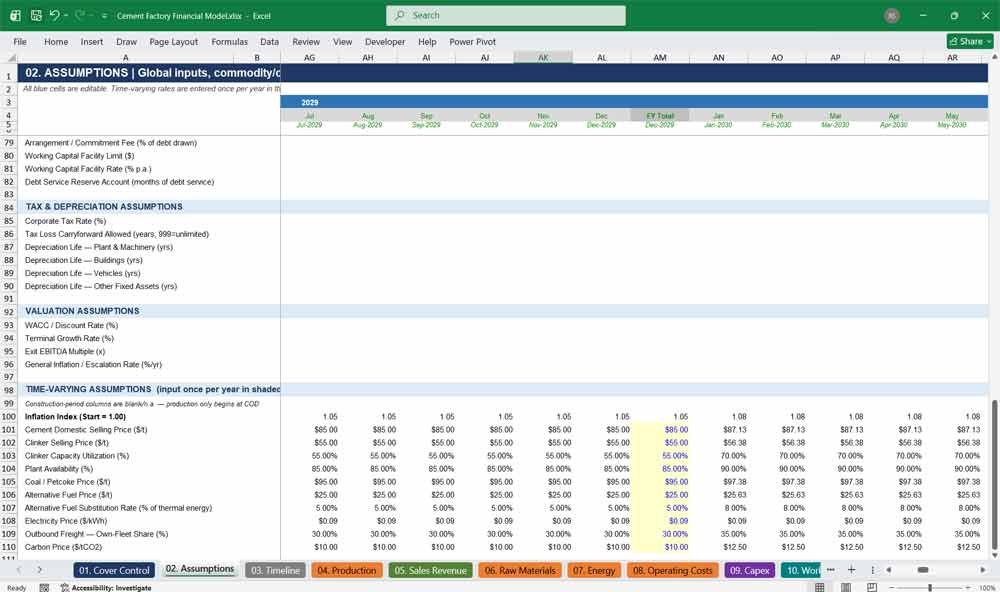
02. Assumptions
The single source of truth for this cement factory financial model — every price, rate, capacity, cost, and financing input lives here, driving all 20 other tabs. Change one cell and the entire construction-to-operations model recalculates automatically.
- One start-date input re-dates the whole 22-year model instantly
- Production, cost, financing, and tax assumptions in one place
- Fully editable blue input cells, clearly separated from formulas
- The engine room for running your own scenarios and sensitivities
Cement Factory Operating Costs & Financing
03. Timeline
The master calendar for the entire cement plant model, converting a single start date into 104 linked monthly and annual periods across construction and 20 years of operations. Every other tab pulls its dates from here, guaranteeing a perfectly consistent timeline.
- Automatic monthly-to-annual transition after Year 5 of operations
- Tracks construction phase, operating year, and calendar year together
- One formula chain — no manually typed dates anywhere downstream
- Eliminates the #1 source of errors in DIY project finance models
04. Production
The physical heart of the cement plant financial model — installed capacity, utilization ramp-up, clinker production, the clinker-to-cement ratio, yield losses, and plant availability, all built bottom-up rather than assumed as a flat growth rate.
- Models capacity utilization ramp-up realistically over time
- Clinker and cement production linked through the clinker/cement ratio
- Plant availability and yield losses captured explicitly
- Feeds every downstream cost and revenue calculation in the model
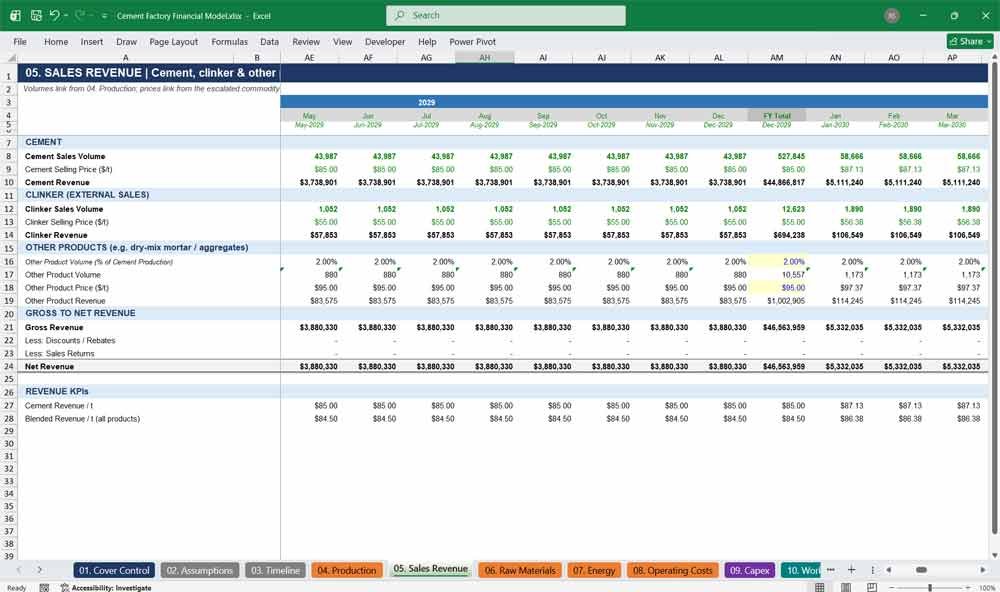
05. Sales Revenue
Turns production volumes into revenue with full price-volume-mix detail across cement, clinker, and other products, including gross-to-net adjustments for discounts and returns — the true top line of your cement manufacturing financial model.
- Separate volume, price, and revenue lines for cement and clinker
- Gross revenue bridged to net revenue via discounts and returns
- Revenue-per-ton KPIs built in for quick benchmarking
- Fully driven by 04. Production — no disconnected revenue assumption
06. Raw Materials
Detailed limestone, gypsum, and additive consumption and cost modeling tied directly to clinker and cement output, giving you a true unit-cost view of raw material economics in your cement plant model.
- Limestone-to-clinker ratio modeled explicitly, not assumed
- Gypsum and additive percentages and per-ton costs broken out
- Raw material cost per ton of cement calculated automatically
- Essential for benchmarking plant efficiency against industry norms
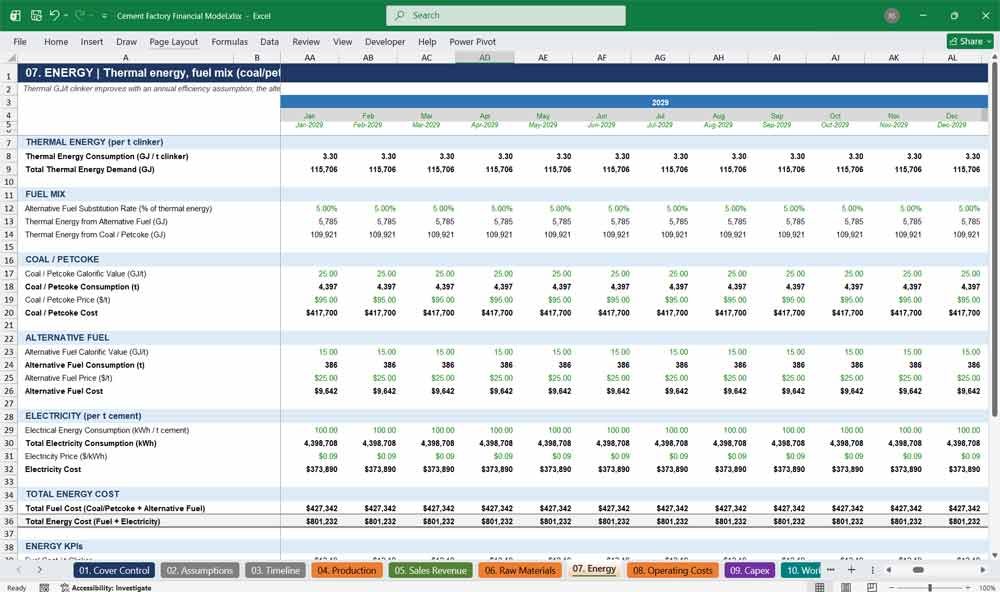
07. Energy
A full thermal and electrical energy model covering GJ per ton of clinker, kWh per ton of cement, coal and alternative fuel mix, fuel pricing, and CO2 emissions and carbon cost — the most detailed energy tab in any cement industry Excel model.
- Thermal energy (GJ/ton clinker) and electrical energy (kWh/ton cement) modeled separately
- Coal, petcoke, and alternative fuel mix with blended fuel cost
- CO2 emissions, emission intensity, and carbon cost fully quantified
- Critical for ESG reporting and decarbonization scenario planning
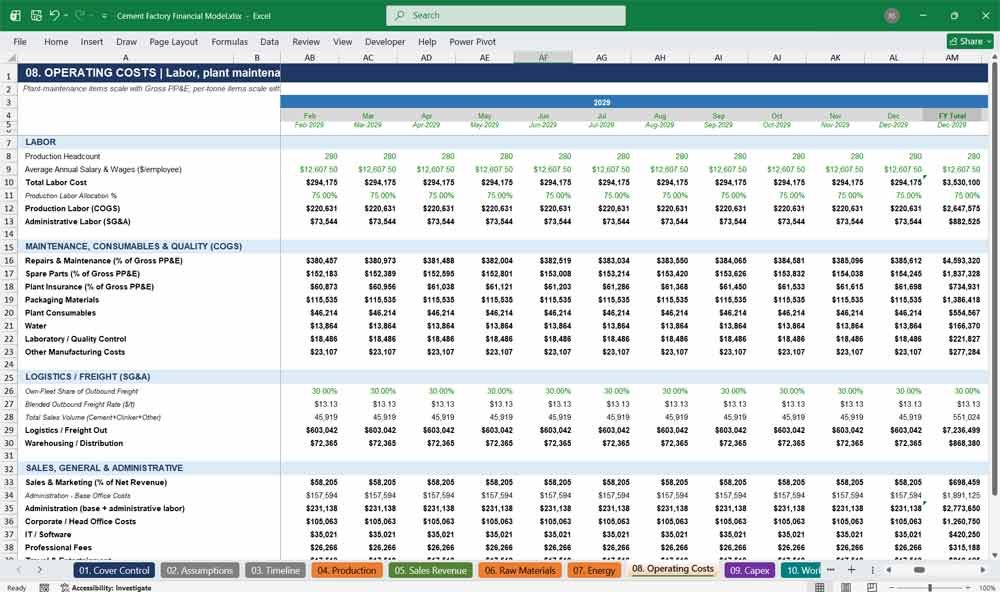
08. Operating Costs
Consolidates labor, maintenance, packaging, freight, logistics, and SG&A into a complete operating cost build for the cement plant, feeding directly into the Income Statement’s cost of sales and overhead lines.
- Headcount and labor cost modeled with allocation between production and admin
- Freight and logistics split between own fleet and third-party transport
- Packaging, spares, and maintenance costs tied to production volume
- Full SG&A build: admin, corporate overhead, IT, professional fees, and more
09. Capex
A granular construction and ongoing capital expenditure schedule — from land and kiln to packing plant and EPC costs during construction, plus sustaining, overhaul, environmental, and expansion capex once the plant is operating.
- 18-line construction budget with a realistic S-curve monthly drawdown
- Recurring major overhaul / shutdown capex modeled on its own cycle
- Sustaining, replacement, and environmental compliance capex all separated
- One-off expansion capex trigger for growth-stage modeling
10. Working Capital
Models accounts receivable, inventory (raw materials, finished goods, spares), and accounts payable using industry-standard days-outstanding methodology, so cash flow timing reflects real operating dynamics rather than a flat percentage-of-revenue guess.
- AR, inventory, and AP driven by editable days-outstanding assumptions
- Separate inventory tracking for raw materials, finished cement, and spares
- Feeds directly into the Cash Flow Statement’s working capital movements
- A key lever for stress-testing liquidity in downside scenarios
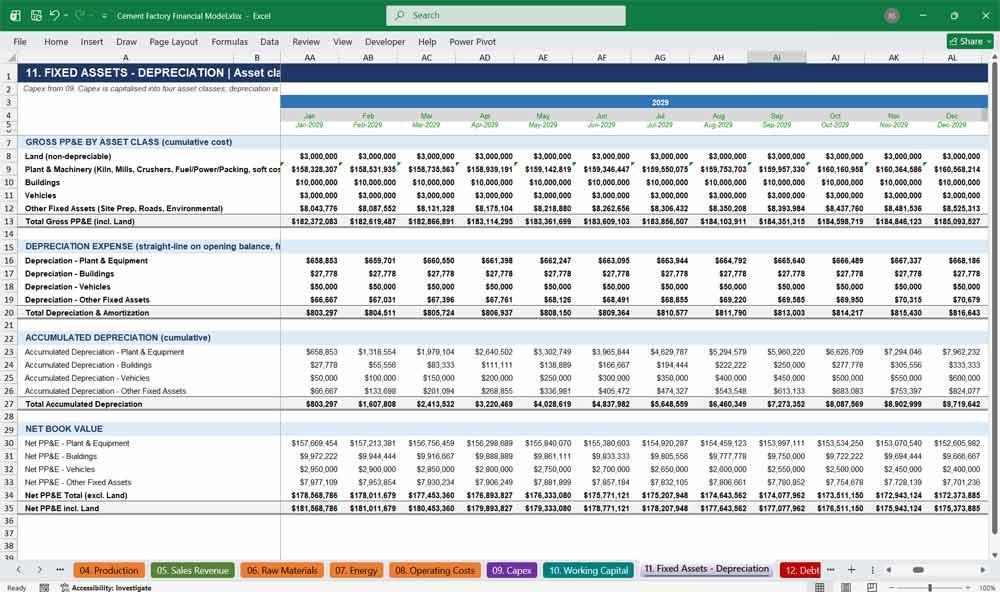
11. Fixed Assets / Depreciation
Rolls forward gross PP&E by asset class, applies straight-line depreciation from the Commercial Operations Date, and tracks accumulated depreciation and net book value — fully synchronized with the Capex and Balance Sheet tabs.
- Separate asset classes: land, plant & machinery, buildings, vehicles
- Straight-line depreciation starts precisely at Commercial Operations Date
- Construction-in-progress and net PP&E kept mutually exclusive (no double-counting)
- Net book value flows directly onto the Balance Sheet
12. Debt Financing
A complete project finance debt schedule — senior term loan drawdown, capitalized construction interest, straight-line repayment, a working capital facility, a Debt Service Reserve Account, and a live DSCR calculation.
- Capitalized interest during construction (IDC) modeled correctly on both sides of the balance sheet
- Straight-line principal repayment gated to the loan tenor
- DSRA sizing and DSCR calculated automatically every period
- Built for lender due diligence and covenant testing
Cement Factory Financial Statements
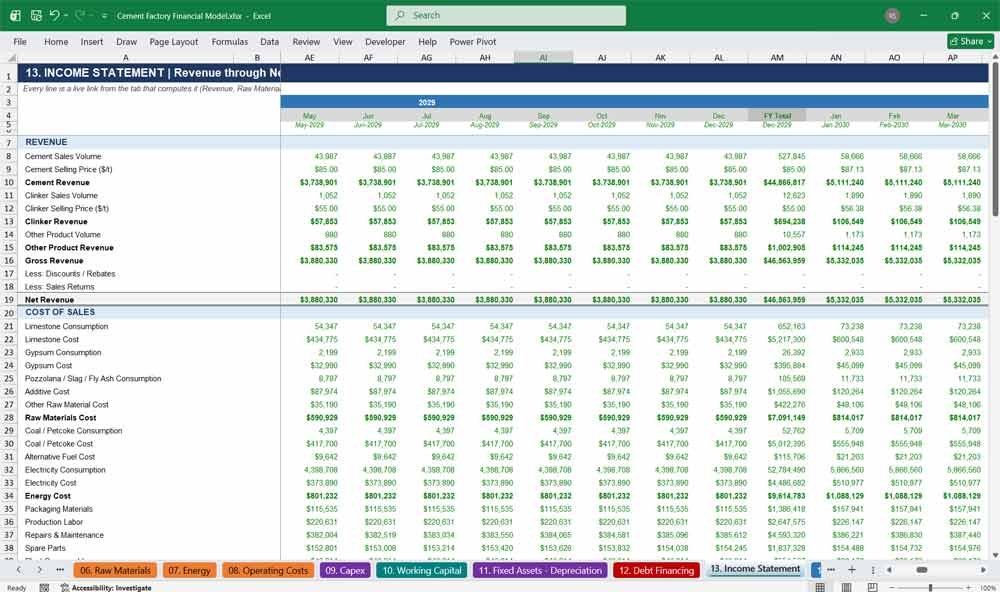
13. Income Statement
The full P&L of the cement plant financial model, from gross revenue down to net income, with complete cost of sales, gross profit, EBITDA, EBIT, finance costs, and a built-in per-ton KPI panel.
- Revenue, COGS, and SG&A fully itemized down to net income
- EBITDA and EBIT bridge with a complete depreciation breakdown
- KPI panel: EBITDA margin, EBITDA per ton, cash cost per ton, and more
- The tab investors and lenders open first
14. Cash Flow
A complete operating, investing, and financing cash flow statement with an explicit CFADS (Cash Flow Available for Debt Service) calculation and a full cash reconciliation check against the Balance Sheet.
- CFADS defined exactly as lenders expect: EBITDA less cash tax, working capital, and sustaining capex
- Detailed investing section covering every construction and operating capex line
- Full financing section: equity, debt draws, repayments, and dividends
- Built-in cash check ties Cash Flow to Balance Sheet every period
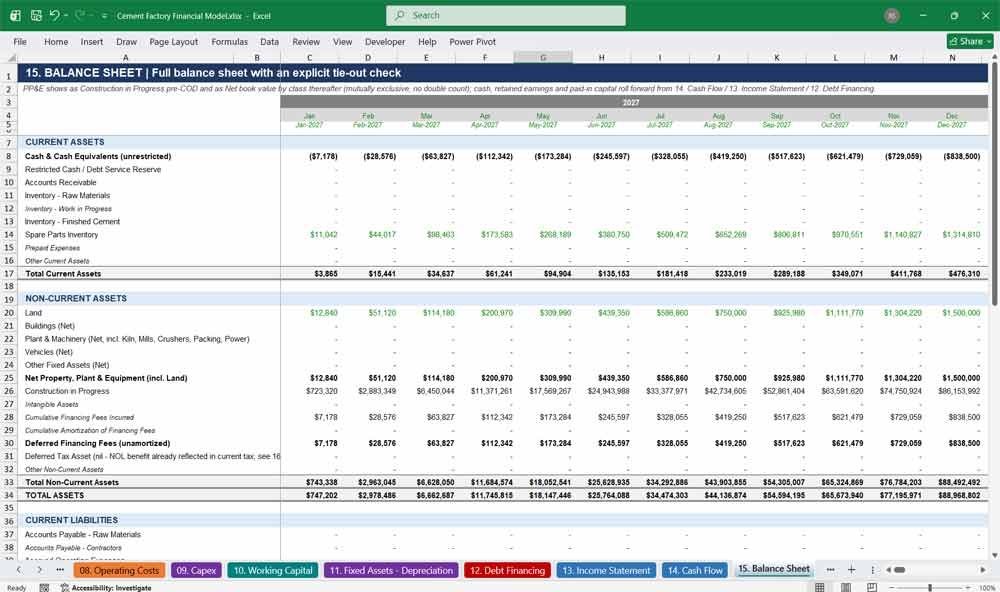
15. Balance Sheet
A fully detailed, fully balanced 22-year balance sheet with complete current and non-current assets and liabilities, an equity roll-forward, and an explicit balance-check row that ties to zero in every single period.
- Every asset and liability class modeled individually, not lumped together
- Retained earnings roll forward automatically from net income and dividends
- Live balance-sheet check flags any imbalance instantly
- Verified to balance across all 104 periods of the model
16. Tax
Calculates taxable income, tracks net operating loss carryforwards, and computes current tax expense — a clean, transparent tax build that flows straight into the Income Statement and Cash Flow Statement.
- NOL carryforward tracked and utilized automatically as profits emerge
- Corporate tax rate is a single editable input
- Tax methodology clearly documented for lender and auditor review
- Feeds both the P&L and the cash tax line in the Cash Flow Statement
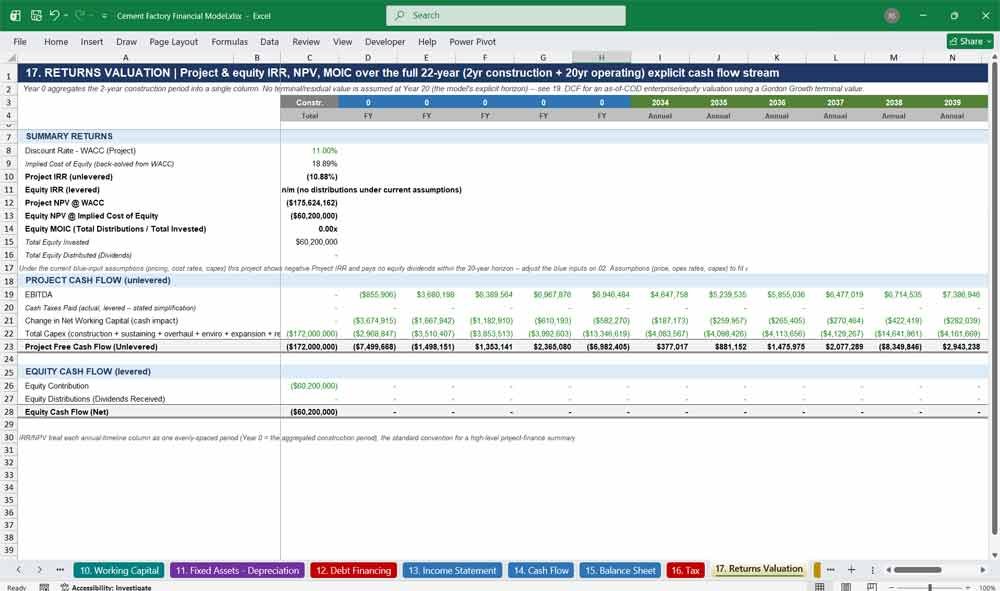
17. Returns Valuation
Calculates Project IRR, Equity IRR, NPV, and equity MOIC across the full 22-year construction-to-operations cash flow stream — the tab every investor and lender will turn to first for a go/no-go decision.
- Unlevered Project IRR and levered Equity IRR calculated automatically
- NPV computed at WACC, with an implied cost of equity back-solved
- Equity MOIC shows total distributions versus total capital invested
- Full year-by-year project and equity cash flow detail included
Key Financial Metrics for a Cement Factory
18. Scenarios Sensitivities
A dedicated scenario and sensitivity tab with editable Downside / Base / Upside toggles for price, volume, opex, capex, and WACC, plus one-way sensitivity tables showing EBITDA and valuation impact instantly.
- Downside / Base / Upside scenario toggles built in and ready to edit
- One-way sensitivities isolate the impact of each key driver
- Enterprise Value sensitivity to price, volume, and cost shown side by side
- Ideal for board presentations and lender risk discussions
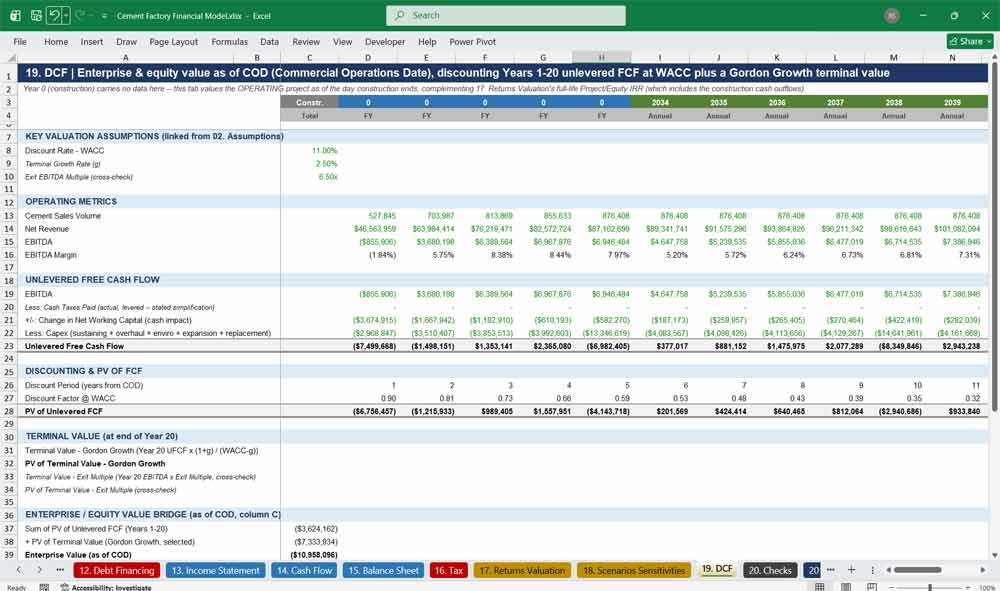
19. DCF
A classic as-of-COD discounted cash flow valuation — unlevered free cash flow, WACC discounting, a Gordon Growth terminal value cross-checked against an exit-multiple method, and a full Enterprise Value to Equity Value bridge.
- Unlevered free cash flow built from EBITDA, tax, working capital, and capex
- Terminal value calculated two ways: Gordon Growth and exit multiple
- Full bridge from Enterprise Value to Equity Value via net debt at COD
- WACC and terminal growth sensitivity table included
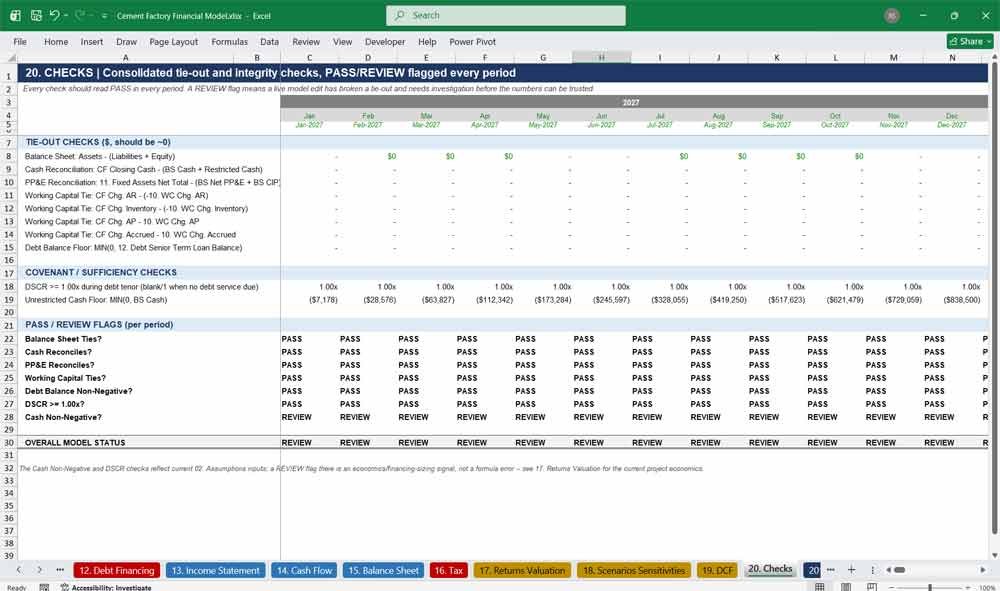
20. Checks
An automated integrity control panel that tests the balance sheet, cash reconciliation, PP&E roll-forward, working capital ties, debt schedule, and DSCR every single period, flagging PASS or REVIEW instantly.
- Every major tie-out check consolidated in one place
- Automatic PASS/REVIEW flag for every period of the 22-year model
- Gives lenders and auditors immediate confidence in model integrity
- Makes it obvious the moment any custom edit breaks a formula chain
201. Dashboard
An executive summary dashboard pulling together headline KPIs, returns metrics, and model status into a single, presentation-ready page — perfect for board meetings, investment committee memos, or a lender’s first look at the deal.
- Project IRR, Equity IRR, NPV, MOIC, and Enterprise Value at a glance
- Year-by-year KPI trends for revenue, EBITDA, net income, and DSCR
- Live model integrity status pulled straight from the Checks tab
- Everything links live — nothing on the dashboard is a hardcoded number
Cement Production Frequently Asked Questions (Faq)
Is this cement plant financial model compatible with Excel or Google Sheets?
The model is built natively in Microsoft Excel (.xlsx) and uses only standard, widely-supported Excel formulas, so it opens cleanly in any current version of Excel. It can also be uploaded to Google Sheets, though we recommend Excel for the smoothest experience with the full formatting and formula set.
Do I need financial modeling experience to use this?
Basic Excel familiarity is enough to get started — every input cell is clearly color-coded in blue so you always know exactly what to change. That said, some background in financial statements or project finance will help you get the most out of the more advanced tabs like Returns Valuation, DCF, and Scenarios.
Can I change the assumptions to match my own project?
Yes — that’s the entire point of the model. Every price, cost rate, capacity figure, financing term, and tax rate lives on the Assumptions tab as an editable blue input cell. Change any of them and the full 22-year model, including all financial statements and returns metrics, recalculates automatically.
What happens if I change the project start date?
The entire model re-dates itself. Every tab’s monthly and annual columns, every escalation calculation, and every period label pulls from a single start-date input on the Assumptions tab, so there’s no manual re-work required anywhere in the workbook.
Does the model actually balance?
Yes. The Balance Sheet includes a live tie-out check on every single period across the full 22-year timeline, and the dedicated Checks tab independently verifies the balance sheet, cash reconciliation, PP&E roll-forward, and working capital ties every period with an automatic PASS/REVIEW flag.
Is this model “bankable,” or is that just marketing language?
“Bankable” here refers to the formatting and structural standard, not a guarantee about any specific deal: inputs, formulas, and cross-tab links are color-coded and clearly separated, every major statement includes a visible tie-out check, and the model follows the structure lenders and investors expect to see in a real project finance data room.
Can I use this for a different plant size or a brownfield expansion, not just a greenfield cement plant?
Yes. Because capacity, utilization, and cost assumptions are all editable inputs rather than hardcoded figures, you can resize the plant, adjust the construction timeline, or model a brownfield expansion by adjusting the relevant Assumptions and Capex inputs.
Does the model include sensitivity or scenario analysis?
Yes — the Scenarios Sensitivities tab includes Downside / Base / Upside toggles for price, volume, operating cost, capex, and WACC, along with one-way sensitivity tables showing the impact on EBITDA and Enterprise Value, and the DCF tab includes its own WACC/terminal-growth sensitivity grid.
What returns metrics does the model calculate?
The Returns Valuation tab calculates Project IRR, Equity IRR, NPV at WACC, and equity MOIC over the full construction-to-operations cash flow stream. The DCF tab separately calculates Enterprise Value and Equity Value as of the Commercial Operations Date, using both a Gordon Growth and an exit-multiple terminal value method.
Will this work for a lender or investor data room, or is it just for internal planning?
It’s built to the structure and formatting standard expected in a lender or investor data room — full construction and operating detail, transparent formulas, color-coded inputs, and built-in tie-out checks — making it suitable for both internal planning and external due diligence, once populated with your project’s actual figures.
What if I find a formula I don’t understand?
Every tab includes a subtitle explaining what it covers and where its inputs come from, and italicized notes flag any modeling simplification or assumption directly next to the relevant calculation, so you can always trace a number back to its source.
Final Notes on the Financial Model
This 20 Year Cement Factory Financial Model Template focuses on balancing capital expenditures with steady revenue growth. By optimizing operational costs, and power efficiency, and maximizing high-margin services like Portland Bulk Sales, the model ensures sustainable profitability and cash flow stability.