
Aggregate Plant Financial Model Excel Template
This 20–Year, 3-Statement Aggregate Plant Financial Model Excel Template includes revenue streams from Crushed Stone, Washed Sand, MOT Type 1 / Road Base, Asphalt and Concrete Aggregate sales, etc. Cost structures, Discounted Cash Flow (DCF) with Terminal Value, Sensitivity Analysis, WACC, NPV and IRR and financial statements to forecast the financial health of your aggregate plant.
20-Year Financial Model for an Aggregate Plant
These very extensive 20 Year Aggregate plant Models involve detailed revenue projections, cost structures, capital expenditures, and financing needs. These models provide a thorough understanding of the financial viability, profitability, and cash flow position of your plant’s financials. Includes: 20x Income Statements, Cash Flow Statements, Balance Sheets, CAPEX sheets, OPEX Sheets, Statement Summary Sheets, and Revenue Forecasting Charts, with the revenue streams, BEA charts, sales summary charts, employee salary tabs and expenses sheets. Cement Factory Financial Model.
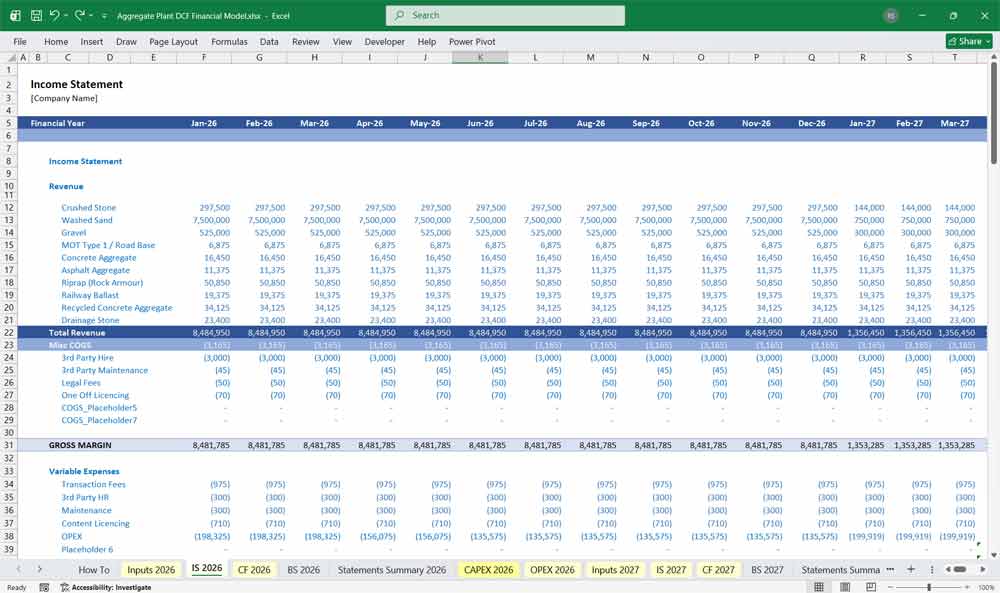
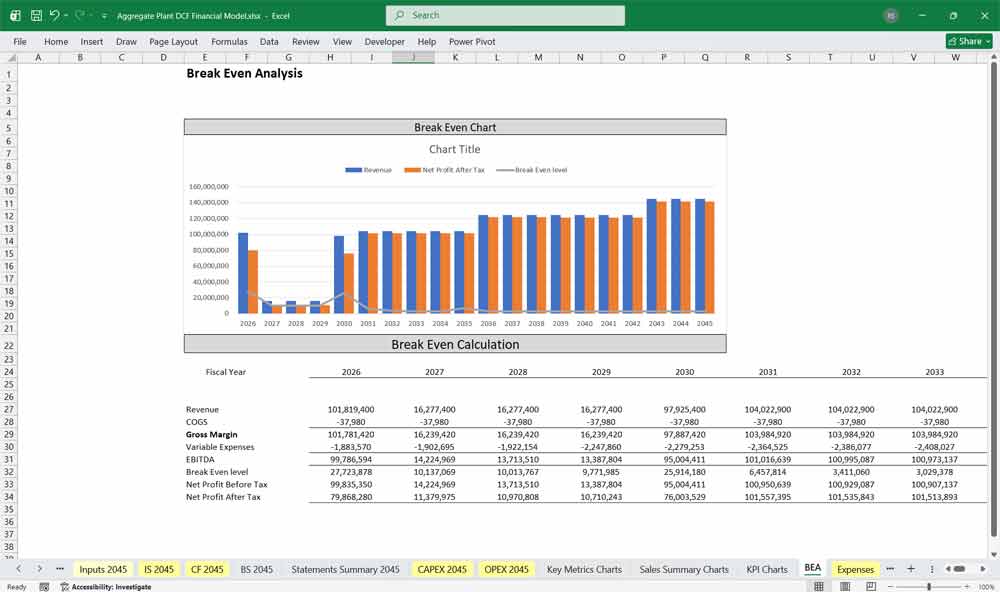
Income Statement
The Income Statement tracks the profitability of the plant over time, shifting from raw volumetric revenue to net earnings after accounting for heavy operational wear and tear.
Revenue
Gross Sales calculated per product line (Crushed Stone, Washed Sand, MOT Type 1, Asphalt/Concrete Aggregate).
Less: Logistics/Freight adjustments (if sold on a delivered basis rather than ex-works).
Cost of Goods Sold (COGS)
Production Costs: Drilling and blasting subcontractors, diesel fuel for haul trucks and loaders, and electricity for the processing plant.
Royalties: Fees paid to landowners per ton of material extracted.
Maintanance & Wear Parts: Ongoing replacement of crusher liners, screen mesh, and conveyor belts (often modeled as a variable cost per ton).
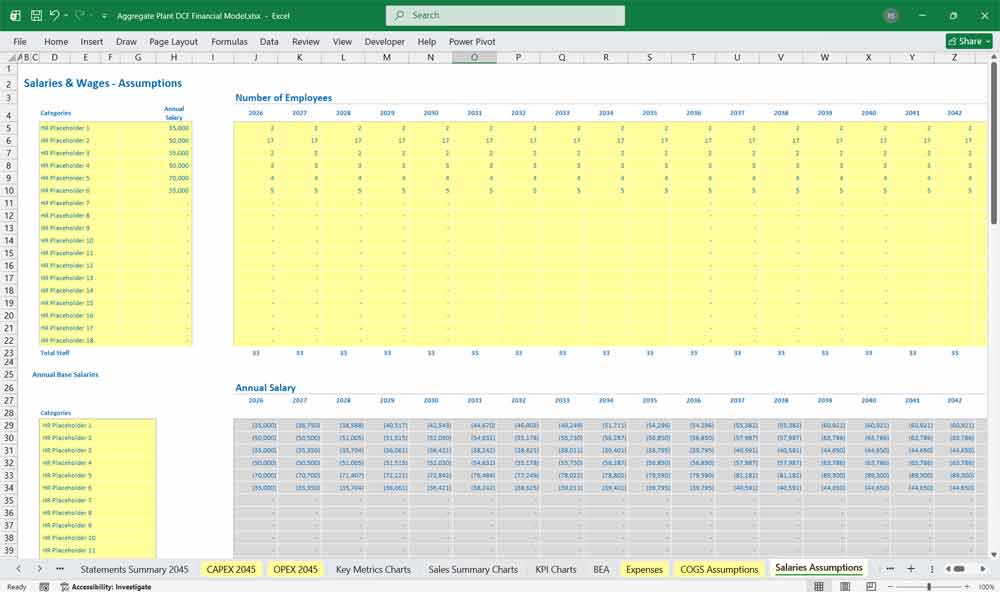
Direct Labor: Plant operators, scale house attendants, and mechanics.
Gross Profit
Revenue minus COGS, indicating the baseline efficiency of the extraction and processing processing.
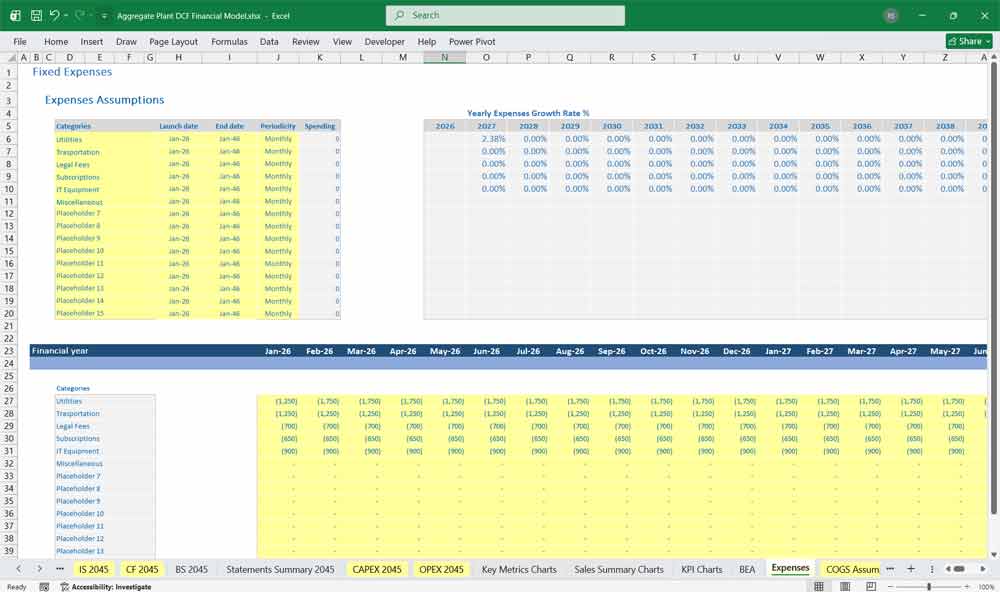
Operating Expenses (OPEX)
Site management salaries, environmental monitoring, regulatory compliance, quality control lab costs, and corporate overhead.
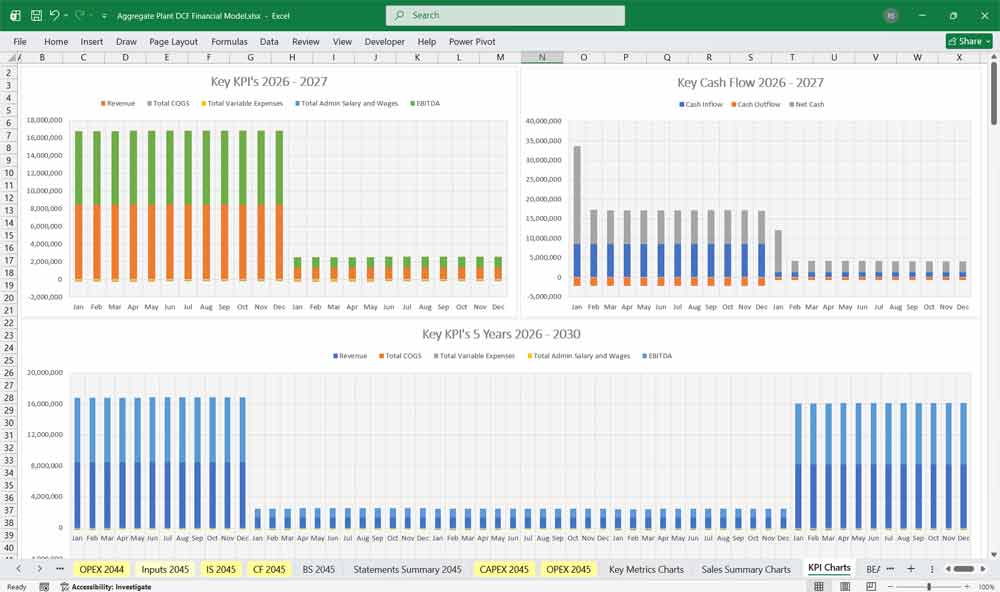
EBITDA
Earnings Before Interest, Taxes, Depreciation, and Amortization. This is the primary metric used to evaluate the operational cash-generating power of the quarry.
Depreciation & Amortization (D&A)
Calculated from the CAPEX schedule. Heavy machinery (Jaw crushers, wash plants) is depreciated over its useful life, significantly impacting net taxable income.
EBIT / Operating Income
EBITDA minus D&A.
Interest, Taxes, and Net Income
Accounts for debt servicing costs (from equipment financing loans) and corporate taxes, resulting in Net Income.
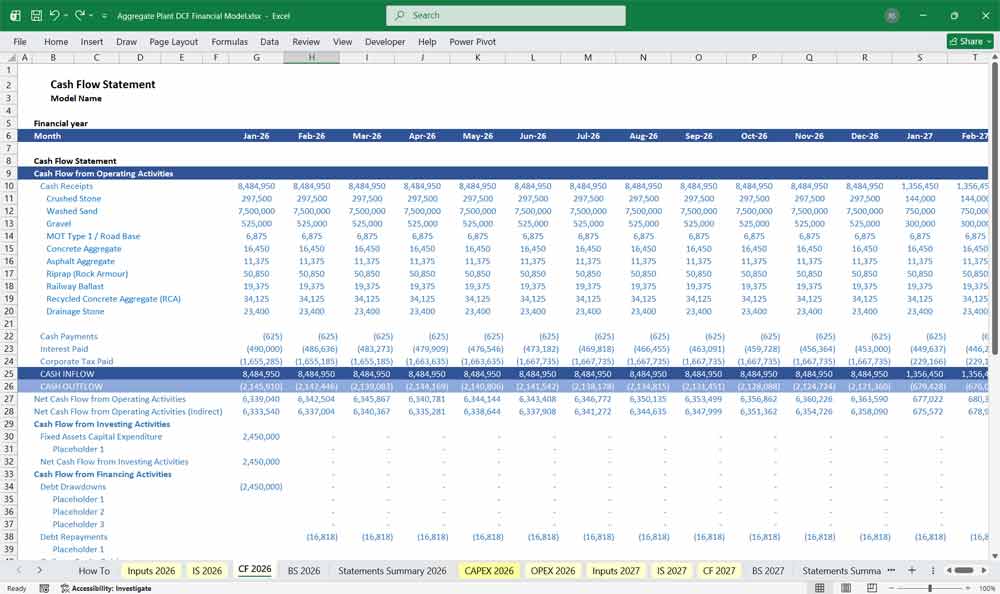
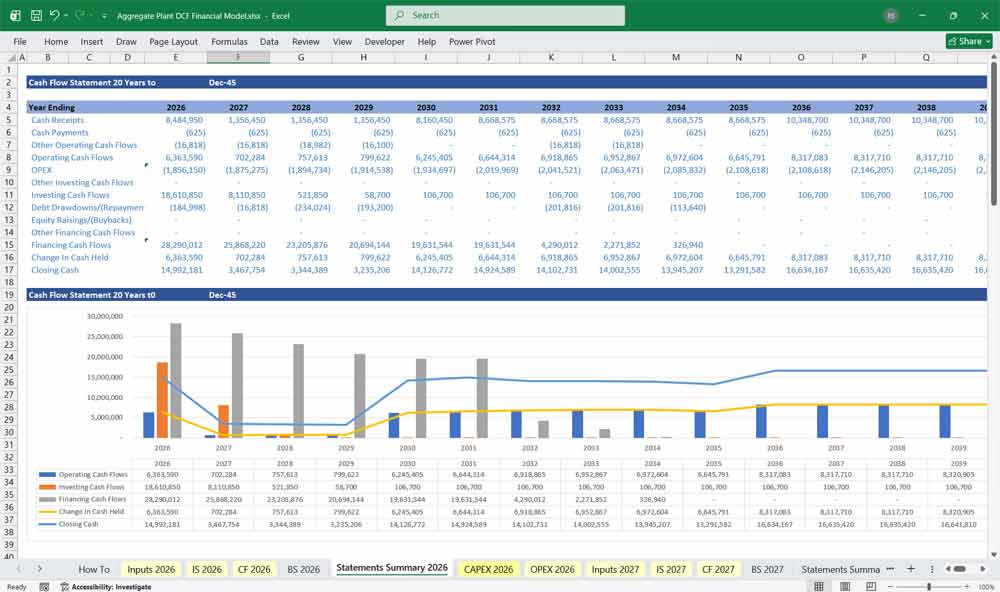
Aggregate Plant Cash Flow Statement
Because an aggregate plant has heavy upfront costs and experiences lag times in client payments, the Cash Flow Statement is the ultimate arbiter of the project’s viability.
Operating Cash Flows
Starts with Net Income.
Add-backs: Non-cash expenses, primarily the heavy Depreciation from the crushers and wash plant.
Changes in Working Capital: Adjustments for cash trapped in building up massive product stockpiles (Inventory) or waiting on client payments (Accounts Receivable).
Investing Cash Flows
Initial & Growth CAPEX: Massive cash outflows in Year 0/Year 1 for buying and setting up the Primary Jaw Crushers, Cone Crushers, Screens, Conveyors, and Wash Plants.
Sustaining CAPEX: Annual cash outflows required to keep the plant running efficiently (e.g., replacing major components or expanding conveyor lines into new quarry benches).
Financing Cash Flows
Inflows from equity partners or bank debt raised to fund the initial asset purchases.
Outflows for mandatory principal repayments on equipment loans.
Net Change in Cash
The sum of Operating, Investing, and Financing cash flows, which reconciles directly back to the Cash balance on the Balance Sheet.
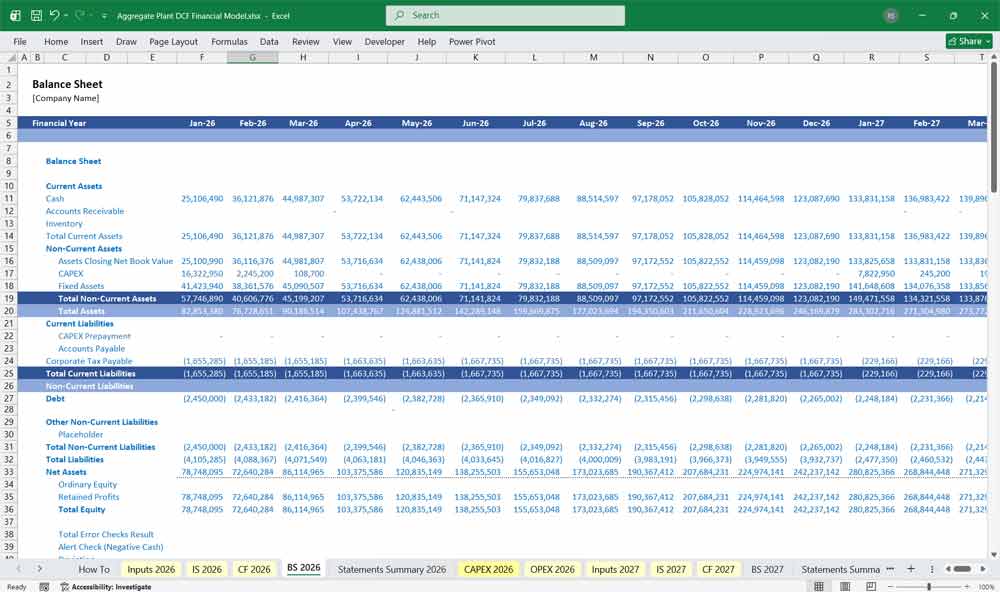
Aggregate Plant Balance Sheet
The Balance Sheet tracks the capital structure, working capital cycles, and the massive asset base of the quarry.
Current Assets
Cash and Cash Equivalents: Operating cash reserves.
Accounts Receivable: Monies owed by construction and infrastructure clients (typically modeled on a 30 to 60-day payment lag).
Inventory / Stockpiles: The value of unsold, processed aggregates sitting in stockpiles. Valued at the cost of production.
Non-Current Assets
Property, Plant & Equipment (PP&E): The net book value of the land, quarry reserves, Jaw Crushers, Cone Crushers, Vibrating Screens, Conveyors, and Wash Plants after subtracting accumulated depreciation.
Mineral Reserves: The capitalized value of the extractable rock reserves, which depletes over time based on annual extraction volumes.
Current Liabilities
Accounts Payable: Monies owed to fuel suppliers, parts vendors, and blasting contractors.
Accrued Expenses: Short-term obligations like unpaid wages or environmental fees.
Non-Current Liabilities
Long-Term Debt: Asset-backed loans used to finance major equipment purchases like the wash plant or crushers.
Asset Retirement Obligations (ARO): A critical line item for quarries—the estimated future financial liability required to remediate, landscape, and close the quarry site at the end of its reserve life.
Equity
Share Capital injected by investors and Retained Earnings rolled over from the Income Statement.
Key Aggregate Plant Industry-Specific Considerations
High Fixed Cost Base: Equipment-heavy industry with high depreciation.
R&D Intensity: Critical for staying competitive.
Quality & Certification: Failure costs can be catastrophic (scrap, rework).
Cyclicality & Diversification: Seasonal demand for Stone, Sand, and Aggregate can affect volumes.
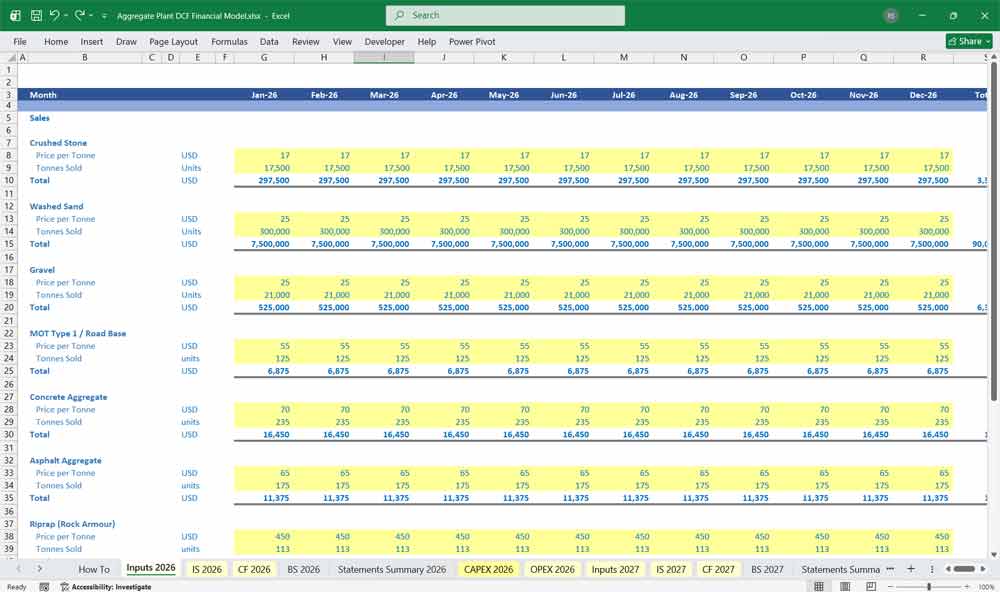
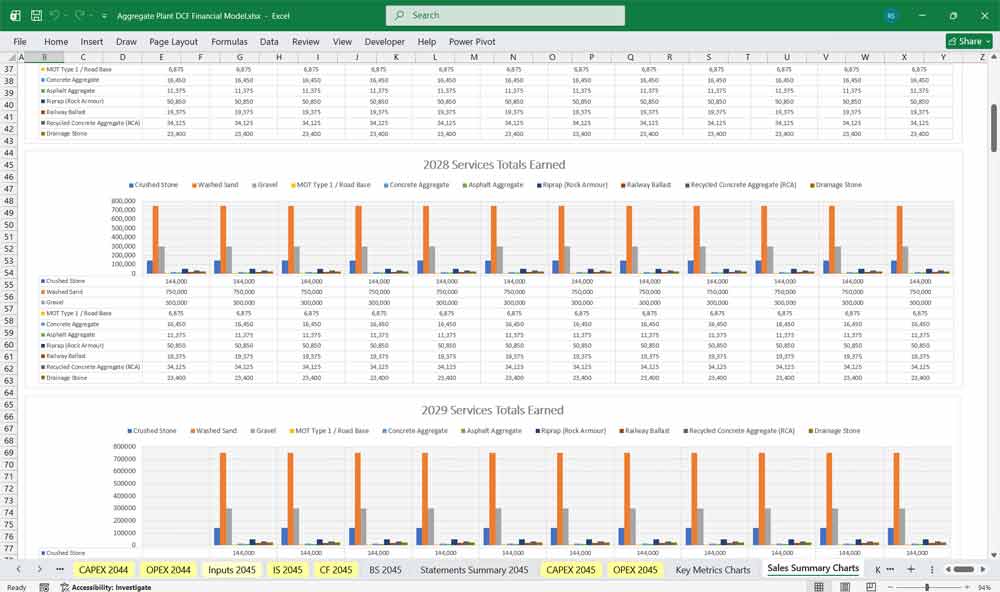
Operational Assumptions & Revenue Drivers
Revenue is driven by multiplying the annual production yield (in tons) of specific product streams by their respective market price per ton, factored by seasonal demand.
Product Mix & Sales Descriptions 10 Editable Input Examples
Crushed Stone: Sourced directly from primary and secondary crushing of the blasted rock face. It is sold in various sizes (e.g., 20mm, 40mm) for general construction. It represents a high-volume, steady-margin baseline for the plant.
Washed Sand: Produced by processing fine aggregates through a wash plant to remove silt and clay. This is a premium, high-demand product critical for ready-mix concrete and mortar, commanding higher prices but requiring significant water and power costs.
MOT Type 1 / Road Base: A highly regulated, blended sub-base aggregate (typically 0-40mm) meeting Ministry of Transport or local highway specifications. It is sold in massive bulks for infrastructure projects, yielding lower margins per ton but driving immense volume.
Asphalt & Concrete Aggregate: Clean, cubical, and highly graded stone fractions. These aggregates undergo rigorous testing for flakiness and durability because they are sold directly to asphalt plants and concrete batching plants at premium price points.
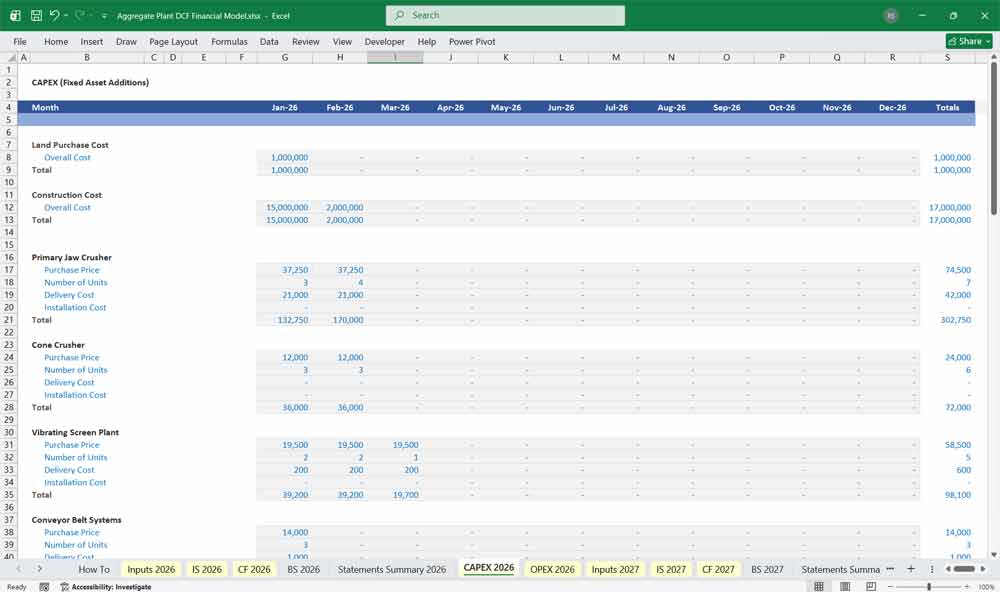
Capital Expenditure (CAPEX) Schedule
An aggregate plant requires substantial upfront and sustaining capital. The CAPEX schedule models the purchase price, installation costs, useful life, and salvage value of heavy machinery, which directly drives the Depreciation schedule.
Key Machinery Line Items
Primary Jaw Crushers: Installed at the front end of the circuit to handle raw, run-of-mine (ROM) blasted rock. They have a high initial capital outlay and a long useful life (10–15 years), with heavy depreciation.
Cone Crushers: Utilized in the secondary and tertiary stages to reduce rock size further and shape it into cubical fractions. CAPEX includes the unit cost and recurring sustaining CAPEX for frequent liner replacements.
Vibrating Screens: The sorting mechanisms that separate crushed material into distinct product sizes. CAPEX is moderate, but they dictate the operational efficiency and product yield mix of the entire plant.
Conveyor Belt Systems: The logistical arteries of the plant, transferring material between crushers, screens, and stockpiles. Modelled as cost-per-meter plus installation, they require regular sustaining CAPEX for belt and roller replacements.
Wash Plants: Highly specialized systems involving hydrocyclones and dewatering screens to produce washed sand. This represents a major capital investment with additional infrastructure requirements for water recycling and settling ponds.
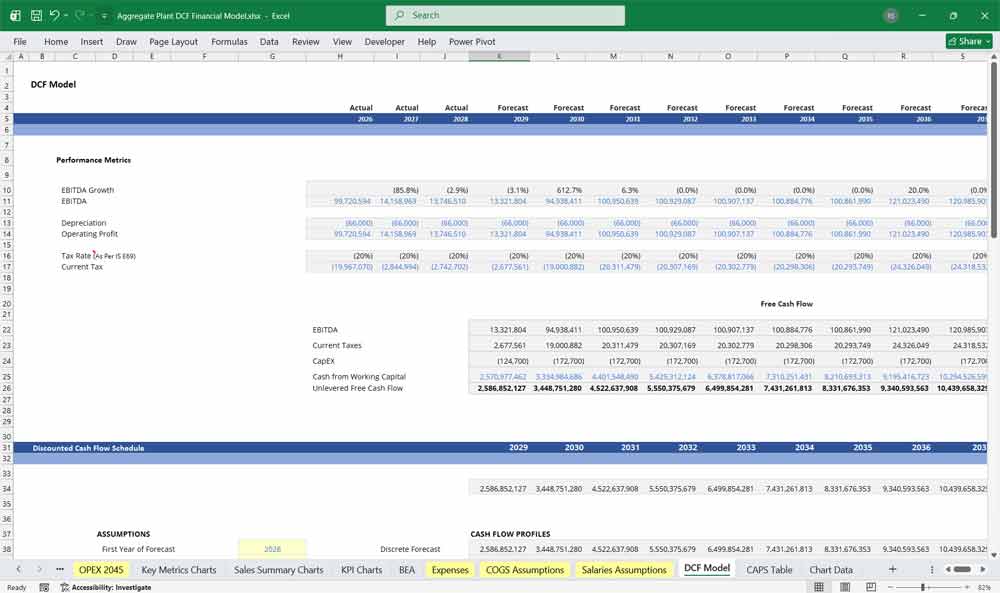
Value Your Aggregate Plant With A DCF
Discounted Cash Flow (DCF): Valuing the “Bedrock” of Infrastructure
This 20-year Discounted Cash Flow (DCF) analysis for an aggregate plant (producing crushed stone, sand, and gravel), the valuation is heavily tied to regional infrastructure pipelines and local construction cycles. The model projects cash flows derived from high-volume, low-margin materials, balanced against massive upfront and sustaining CapEx for heavy yellow iron—such as excavators, haul trucks, primary jaw crushers, and conveyor systems. Because aggregates are extremely heavy and expensive to transport, the DCF must factor in a “geographic monopoly radius,” typically within 30 to 50 miles of the site. The Terminal Value usually incorporates the ultimate depletion of the quarry’s permitted reserves, forcing the model to account for final site reclamation and environmental remediation costs rather than assuming perpetual growth.
Weighted Average Cost of Capital (WACC): Pricing Asset Tangibility and “Permitting Beta”
WACC represents the plant’s blended cost of debt and equity financing. For an aggregate plant, WACC is influenced by the cyclical nature of construction demand, permitting and environmental risks, and the capital-intensive requirements for quarry equipment and processing facilities. A stable market position and long reserve life can reduce perceived risk and lower the overall cost of capital.
Sensitivity Analysis: Stress-Testing the “Diesel-to-Distance” Spread
Sensitivity analysis evaluates how changes in key assumptions affect the plant’s valuation. Critical variables include aggregate selling prices, production volumes, fuel costs, operating margins, and WACC. By testing scenarios such as slower construction activity or higher diesel costs, analysts can identify the most significant risks and assess how sensitive the plant’s value is to changes in market and operating conditions.
Final Notes on the Financial Model
This 20 Year Aggregate Plant Financial Model Excel Template focuses on balancing capital expenditures with steady revenue growth from a diversified product line. By optimizing operational costs, and power efficiency, and maximizing high-margin services, the models ensure sustainable profitability and cash flow stability.
Download Link On Next page
Download Link On Next page