
Wholesale Distributor Financial Model Template
This Wholesale Distributor Financial Model is a fully integrated Excel financial model built specifically for wholesale and distribution businesses. It combines 36 months of historical financials with a 60-month monthly forecast. It also includes annual roll-up columns, so you can plan revenue, gross margin, operating costs, working capital, capex and debt in one connected workbook. Whether you distribute food and beverage, household goods, personal care, industrial MRO or electrical supplies, this distribution business financial model gives you a lender-ready projection in hours, not weeks.
5-Year Financial Model for a Wholesale Distributor
At its core is a driver-based revenue engine. Revenue is built from customers × orders per customer × units per order × average selling price, with monthly seasonality. Revenue is then split by product category, SKU, customer, geography and sales channel. Cost of goods sold flows from purchase cost per unit, supplier rebates, freight-in, import duties and inventory adjustments. Inventory, receivables and payables are driven by DIO, DSO and DPO, so the cash impact of growth is calculated automatically.
Everything links into a monthly three-statement model: the income statement, balance sheet and cash flow statement. A seven-facility debt schedule includes an automatic revolving credit facility, covenant testing and a cash runway analysis. A KPI dashboard with charts, four built-in scenarios and two-variable sensitivity tables let you stress-test the business before you commit. A dedicated checks tab confirms the balance sheet balances every month and that the workbook contains no formula errors. That makes this wholesale distribution Excel template ready for owners, CFOs, banks and investors.
What’s Inside: Tab-by-Tab
01. Cover & Model Guide
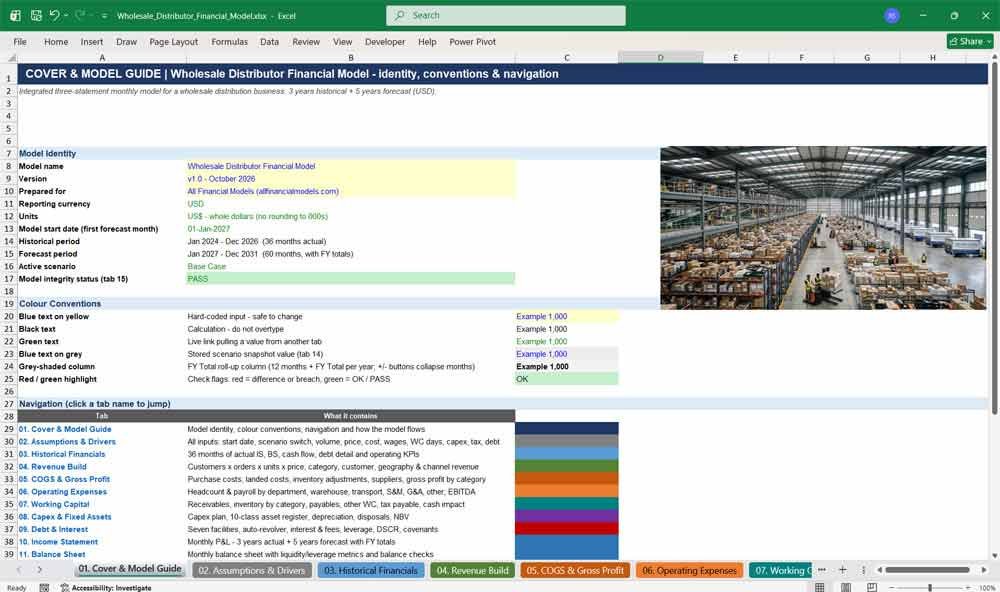
The Cover & Model Guide introduces the wholesale distributor financial model, showing the model name, version, reporting currency and units. A colour legend, clickable navigation to every tab and a step-by-step model flow help new users start building forecasts within minutes.
- Model name, version, currency (USD) and units
- Colour-coded legend for inputs, formulas and links
- One-click hyperlinks to all 15 tabs
- Live model integrity status (PASS/REVIEW)
02. Assumptions & Drivers
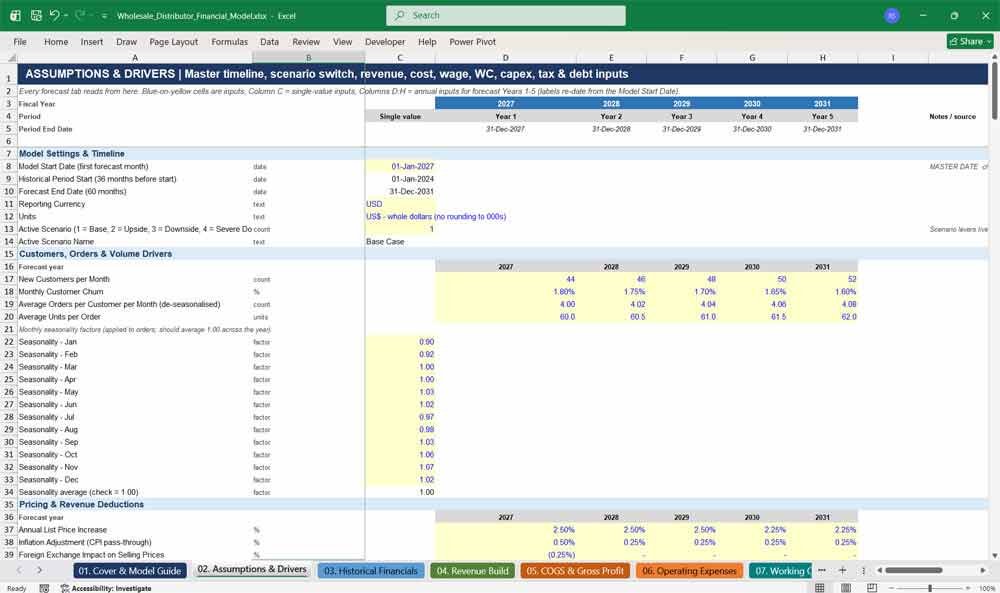
All forecast inputs live on one assumptions tab, including volumes, price increases, gross margins, wages, inflation, tax, capex, DSO, DIO and DPO. Change the single model start date and every date, label and calculation throughout the distribution model updates automatically.
- One master start date re-dates the entire workbook
- Scenario switch: Base, Upside, Downside, Severe Downside
- Product, customer, supplier, geography and channel registers
- Annual inputs for Years 1–5 plus single-value drivers
- Debt facility, covenant and fixed asset registers
Wholesale Distributor Revenues & Expenses
03. Historical Financials
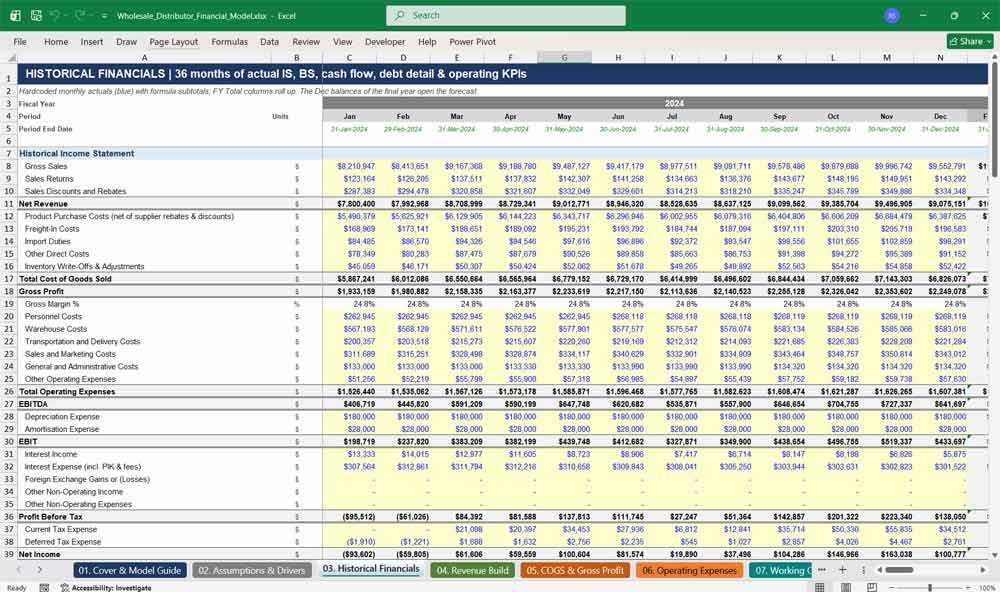
Enter three years of monthly historical income statements, balance sheets, cash flows and operational KPIs. Formula subtotals and annual totals verify your actuals, and the final December balances automatically open the forecast, creating a seamless link between history and projections.
- 36 months of historical P&L, balance sheet and cash flow
- Debt balances by facility
- Operating KPIs: customers, orders, units, headcount, fleet
- Built-in balance sheet and cash reconciliation checks
04. Revenue Build
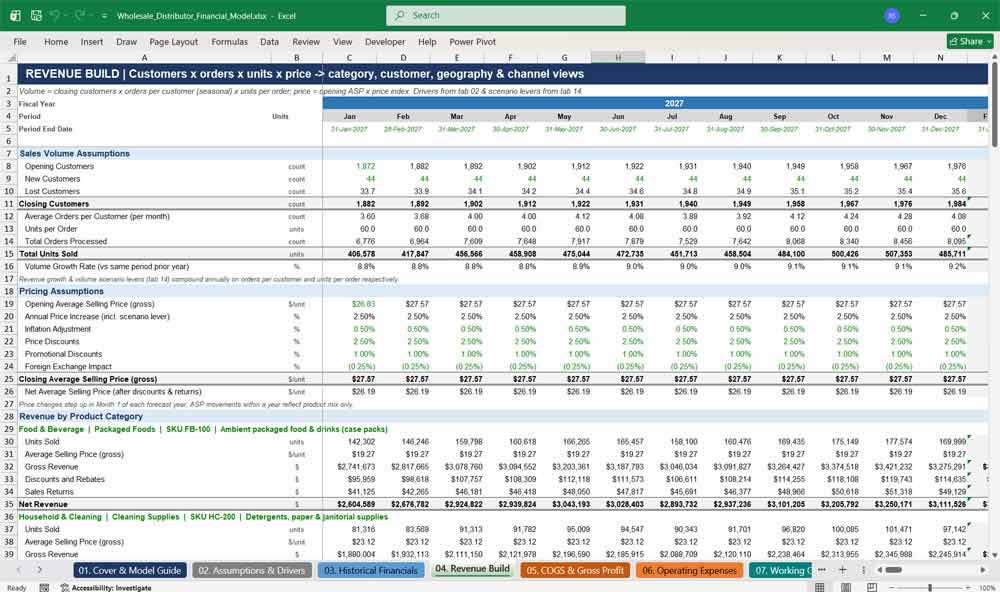
A driver-based wholesale revenue forecast built from customers, orders, units per order and pricing. Revenue is analysed by product category, SKU, customer, geography and sales channel. Seasonality, churn, new customer acquisition, discounts, rebates and returns are all modelled monthly.
- Customer roll-forward: opening, new, lost, closing
- Pricing: list increases, inflation, discounts, promotions, FX
- Revenue by category and SKU, customer, country and channel
- Customer concentration: largest and top-10 share
- Revenue checks reconcile every split to the total
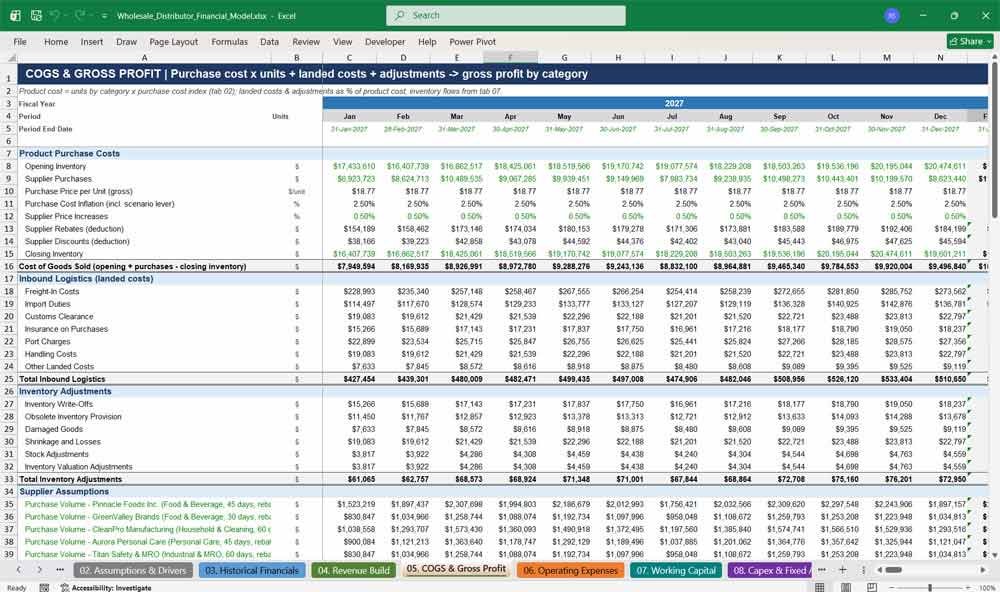
05. COGS & Gross Profit
Calculate cost of goods sold from purchase cost per unit, supplier price inflation, rebates and discounts. Landed costs (freight-in, duties, customs, insurance, port charges and handling) and inventory adjustments produce an accurate gross profit and gross margin by category.
- Purchase price per unit with cost inflation index
- Full inbound logistics and landed cost build
- Inventory write-offs, obsolescence, shrinkage and damage
- Supplier register: volumes, payment terms, rebates, concentration
- Gross profit and margin by product category
06. Operating Expenses
Forecast distribution operating costs with a payroll build by department, covering headcount, hires, attrition, salaries, bonuses, payroll taxes and benefits. Warehouse, transport, fleet, sales, marketing and administrative costs flex with orders, units, revenue and inflation, producing EBITDA and EBIT.
- Headcount and fully loaded payroll for six departments
- Warehouse rent, utilities, picking, storage and handling
- Fleet, fuel, 3PL, courier and last-mile delivery costs
- Sales, marketing, G&A and other operating expenses
- Fixed vs variable split, cost per order and cost per unit
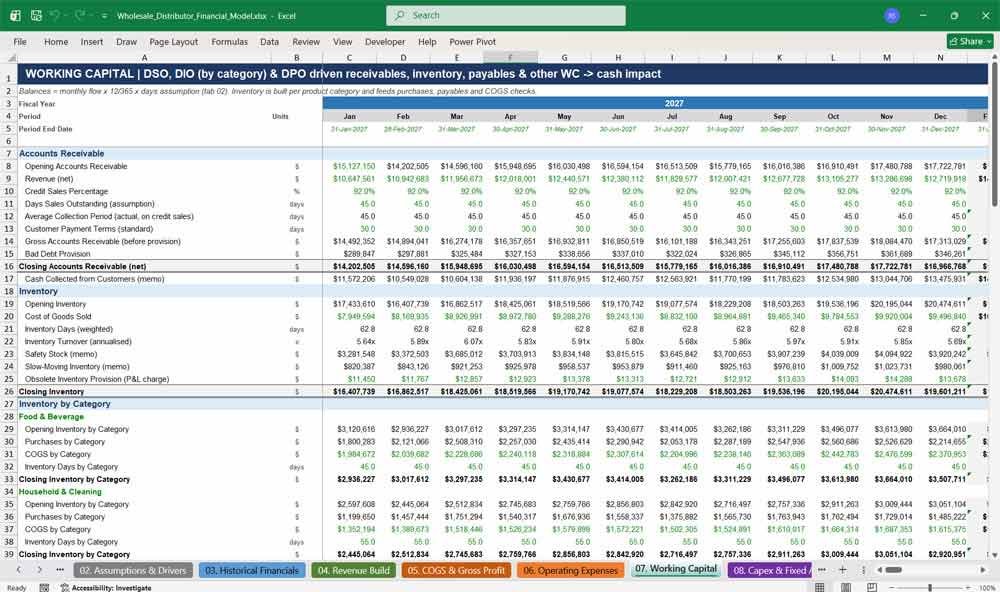
07. Working Capital
Model receivables, inventory and payables using DSO, DIO and DPO assumptions, with inventory days set by product category. Prepayments, sales tax, accruals, customer deposits and tax payable are included, showing exactly how much cash your distribution growth absorbs.
- Accounts receivable with bad debt provision
- Inventory and purchases by product category
- Accounts payable driven by supplier terms
- Cash conversion cycle and turnover ratios
- Cash absorbed or released by working capital
08. Capex & Fixed Assets
Plan warehouse expansion, racking, forklifts, delivery vehicles, IT and software capex with inflation. A ten-class fixed asset register calculates straight-line depreciation and amortisation, disposals, impairments and net book value, feeding both the balance sheet and cash flow statement.
- Eight capex categories, split into maintenance and growth
- Ten-class fixed asset register with useful lives
- Gross cost, accumulated depreciation and NBV roll-forwards
- Vehicle disposals with proceeds and gain/loss
- Capex as a percentage of revenue and EBITDA
09. Debt & Interest
A complete debt schedule covering a revolving credit facility, overdraft, term loan, asset-based lending, equipment finance, shareholder loans and other borrowings. The revolver draws and repays automatically, and the schedule calculates interest, fees, leverage, DSCR and covenant compliance monthly.
- Seven debt facilities with fixed or floating rates
- Automatic revolver keeps cash at your minimum balance
- Cash interest, PIK interest, commitment and arrangement fees
- Net debt/EBITDA, interest cover and DSCR
- Covenant headroom and compliance status
Wholesale Distributor Financial Statements
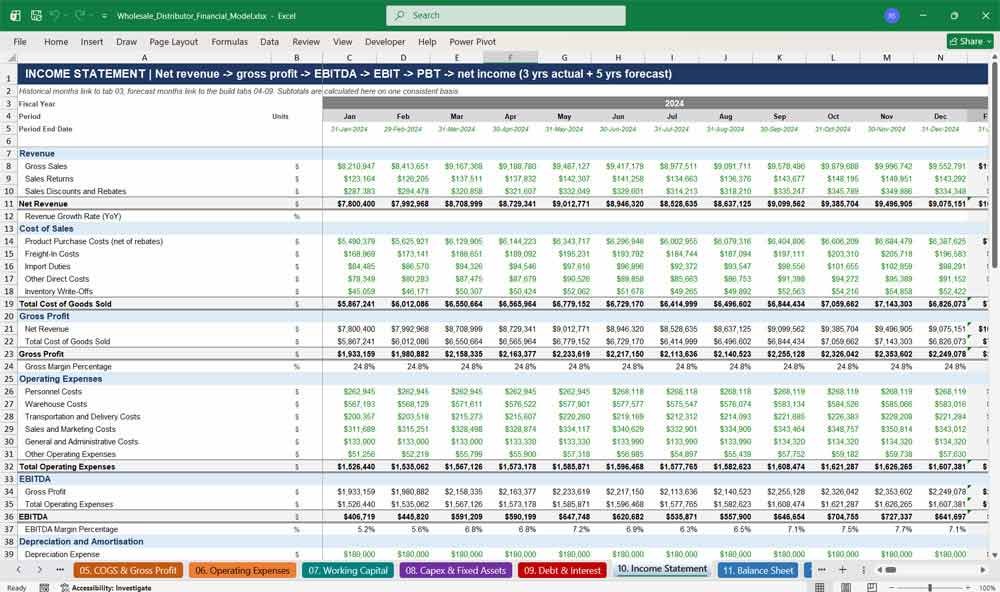
10. Income Statement
A monthly income statement covering three years of actuals and five years of forecasts, with annual totals. It flows from gross sales through cost of sales, gross profit, operating expenses, EBITDA, depreciation, EBIT, interest and tax to net income and EPS.
- Monthly P&L with FY roll-up columns
- Margins at every level: gross, EBITDA, EBIT, net
- Current and deferred tax with effective tax rate
- EPS and dividends per share
- LTM EBITDA and interest for covenant testing
11. Balance Sheet
A fully balancing monthly balance sheet linking cash, receivables, inventory, fixed assets, debt and equity from the supporting schedules. Liquidity and leverage metrics, including current ratio, quick ratio and net debt to EBITDA, are calculated alongside automatic balance checks.
- Current and non-current assets and liabilities
- Equity roll-forward: retained earnings, net income, dividends
- Working capital, liquidity and leverage ratios
- Balance check, retained earnings, cash, fixed asset and debt reconciliations
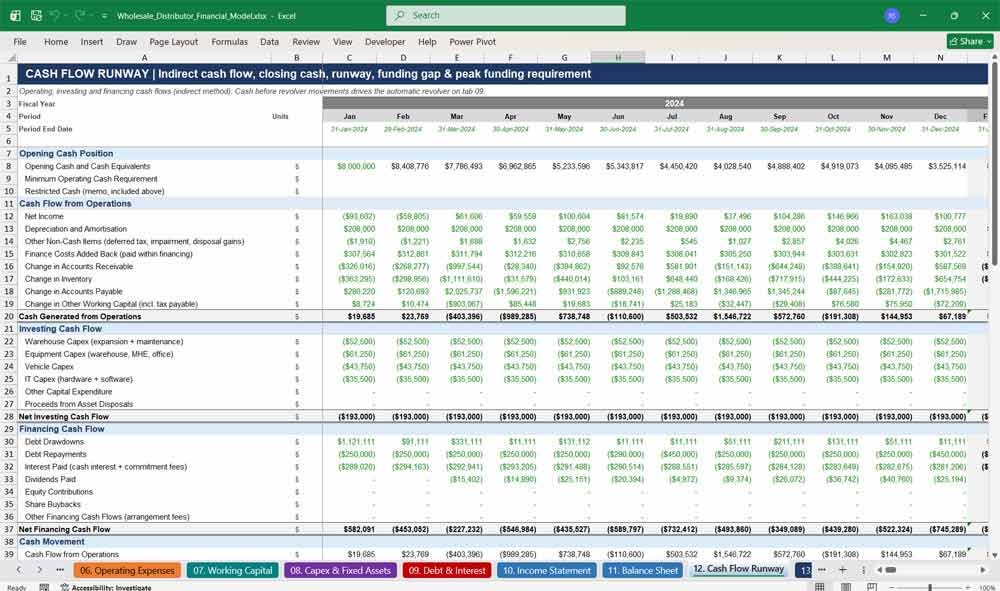
12. Cash Flow Runway
An indirect cash flow statement with operating, investing and financing cash flows, plus full cash runway analysis. It identifies the lowest cash balance, any funding shortfall month, the peak funding requirement and how much additional debt or equity is needed.
- Monthly cash flow statement (indirect method)
- Opening and closing cash versus minimum cash
- Cash burn, runway in months and facility headroom
- Funding gap, funding date and debt/equity requirement
- Cash reconciliation checks
Overview of the Wholesale Distributor Financial Model
13. KPIs & Dashboard
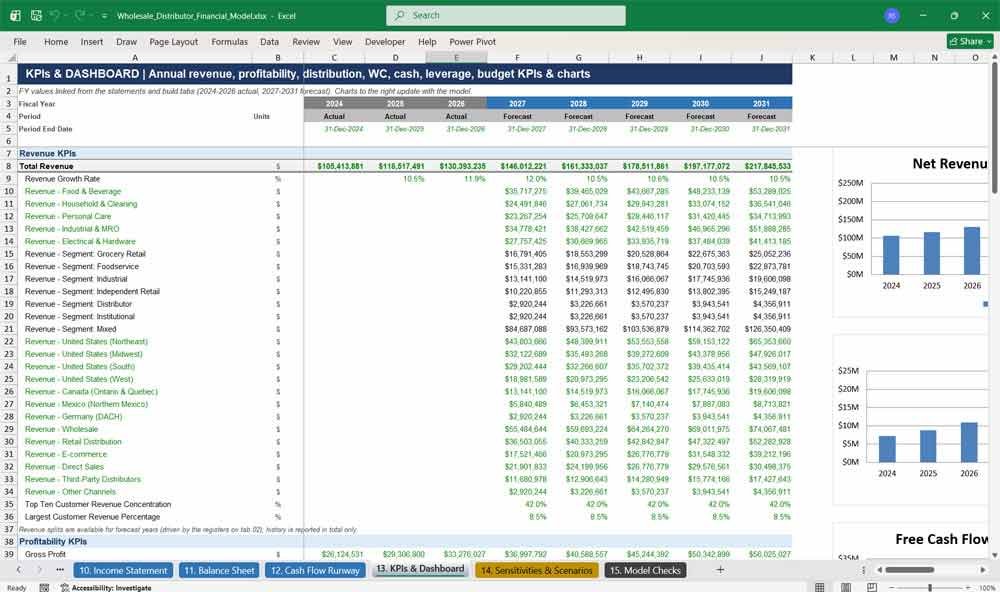
An annual KPI dashboard for wholesale distributors, covering revenue, profitability, distribution operations, working capital, cash flow and leverage. Budget versus actual variances, automatic risk alerts and six dynamic charts present the business clearly for board meetings, banks, lenders and investors.
- Revenue by category, segment, geography and channel
- Distribution KPIs: orders, order value, cost per order, warehouse utilisation
- Budget vs actual revenue, margin, EBITDA and cash flow
- Automatic alerts: covenants, liquidity, concentration, margin, leverage
- Six charts, including base case vs downside
14. Sensitivities & Scenarios
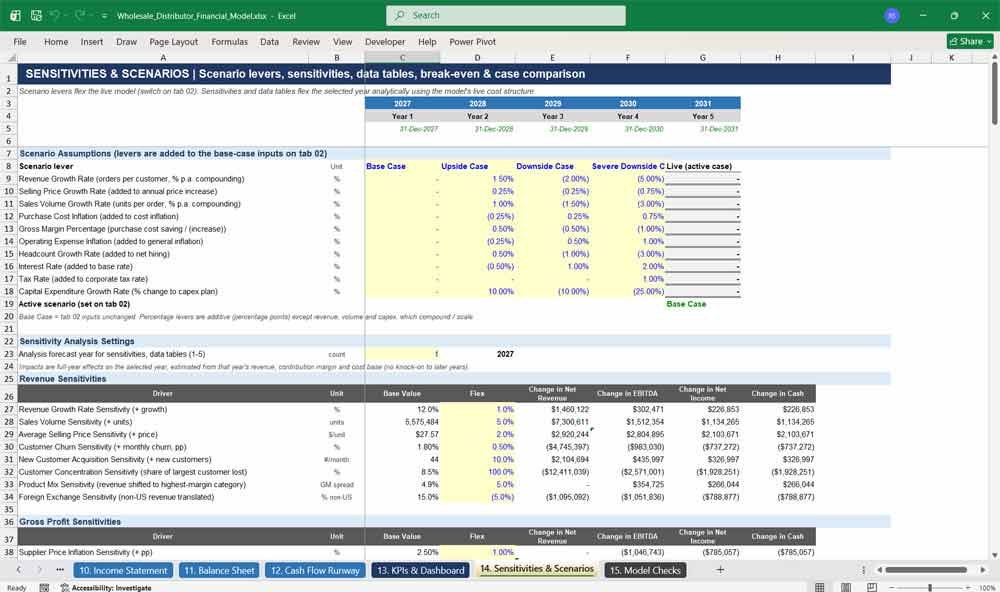
Stress-test your distribution business with four scenarios (base, upside, downside and severe downside), each flexing growth, pricing, costs, interest and capex. Sensitivity tables, two-variable data tables, break-even analysis and scenario comparison quantify risks on revenue, EBITDA, cash and covenants.
- Ten scenario levers across four cases
- Revenue, gross profit, working capital, opex and financing sensitivities
- Six two-variable data tables
- Break-even revenue, margin, volume and covenant revenue
- Side-by-side scenario comparison with peak funding and covenant breaches
15. Model Checks
An integrity tab that confirms the model is error-free in every period. It verifies that the balance sheet balances, cash flow reconciles, debt rolls forward and revenue, COGS and working capital tie out, and it scans every tab for formula errors.
- PASS/REVIEW status for every month
- Fifteen reconciliation checks in one place
- Workbook-wide formula error scan
- Overall model status shown on the cover
Why Buy This Model
Building a reliable financial model for a wholesale distribution business from scratch takes weeks, and one broken link can undermine your credibility with a bank or investor. This model gives you a professionally structured, fully integrated three-statement forecast designed around how distributors actually operate: customers, orders, units, margins, inventory, supplier terms and warehouse and fleet costs. All inputs sit on one tab, with colour-coded cells that make it obvious what to change. A single start date re-dates the entire workbook, and the automatic revolver means there are no circular references to manage. Built-in scenarios, sensitivities and a model checks tab show you how robust your plan is before you present it, so you can walk into a lender or board meeting with confidence.
Wholesale Distribution Frequently Asked Questions (Faq)
I run a small distribution company. Is this model suitable for my business?
Yes. The model is built for wholesale and distribution businesses of any size, and every driver can be edited. Enter your own customers, products, prices, costs and historical figures, and the forecast scales to your business.
What kind of products does it cover?
The template comes set up with five example product categories: food and beverage, household and cleaning, personal care, industrial and MRO, and electrical and hardware. You can rename the categories, SKUs, descriptions, prices and costs to match whatever you distribute.
Do I need to be a finance expert to use it?
No. All inputs are on the Assumptions & Drivers tab and are highlighted in blue on yellow. Black cells are formulas you don’t need to touch. The cover tab explains how the model flows, and the checks tab tells you immediately if anything is out of balance.
Can I use this model to apply for a bank loan or raise investment?
Yes. The model produces a monthly income statement, balance sheet and cash flow statement, along with debt covenants, DSCR, leverage ratios and funding requirements. Those are the outputs lenders and investors typically ask for. It also shows the funding gap and peak funding requirement under different scenarios.
How many years does the forecast cover?
It covers three years of monthly historical data and five years of monthly forecasts. Each year has an annual total column, and you can collapse the monthly columns to see an annual view.
Can I change the start date of the forecast?
Yes. Change the Model Start Date on the Assumptions tab, and every date, year label and period throughout the workbook updates automatically. You can also start the forecast in a month other than January, for example to match an April financial year.
Do I need to enter historical data?
The Historical Financials tab includes illustrative data so you can see how the model works. Replace the blue cells with your own actuals. The closing balances from your final historical month then automatically become the opening position for the forecast.
Does the model include scenarios and sensitivity analysis?
Yes. Four scenarios (Base, Upside, Downside and Severe Downside) can be switched on from one cell. Tab 14 also includes sensitivity tables, six two-variable data tables, break-even analysis and a side-by-side scenario comparison.
How does the model handle inventory and working capital?
Inventory is modelled by product category using days inventory outstanding, while receivables and payables are driven by DSO and DPO. The model calculates supplier purchases, the cash conversion cycle and how much cash is tied up in working capital each month.
Will I get circular reference errors from the interest calculation?
No. Interest is calculated on opening balances, and the revolving credit facility draws and repays automatically to maintain your minimum cash balance. The model has no circular references and doesn’t need iterative calculation.
Does the model include debt covenants?
Yes. The debt tab tests maximum net leverage, minimum interest coverage and minimum liquidity every month. It shows covenant headroom and flags any breach, which also appears in the dashboard alerts.
Can I use a currency other than US dollars?
The model is set up in USD, but the calculations work with any currency. Simply change the reporting currency label on the Assumptions tab and enter your figures in your local currency.
Can I add more customers, suppliers or product categories?
The model includes ten named customers plus an “all other customers” line, eight suppliers, five product categories, seven geographies and six sales channels. Names, shares and attributes are all editable. Adding extra rows requires extending the related formulas, which is straightforward for users comfortable with Excel.
Does it contain macros or VBA?
No. The model uses standard Excel formulas only, with no macros, so it opens without security warnings and every calculation is transparent and auditable.
How do I know the model is working correctly?
The Model Checks tab confirms that the balance sheet balances, cash reconciles and debt rolls forward. It also checks the revenue, COGS, working capital and fixed asset tie-outs, and scans the whole workbook for formula errors. The overall status, PASS or REVIEW, is displayed on the cover page.
Final Notes on the Financial Model
This 5 Year Wholesale Distributor Financial Model focuses on balancing capital expenditures with steady revenue growth from a diversified product line. By optimizing operational costs, and power efficiency, and maximizing high-margin services, the models ensure sustainable profitability and cash flow stability.