
Waste To Energy Plant Financial Model
This 20-Year, 3-Statement Excel Waste To Energy Plant Financial Model includes revenue streams from Electricity Sales, Recycled Materials Sales, Recovered Heat Sales, Ash Utilization Sales, and Gate Fees. Cost structures, WtE Discounted Cash Flow (DCF) with Terminal Value, Sensitivity Analysis, and WACC, and financial statements to forecast the financial health of your Waste To Energy Plant.
20-year Financial Model for a Waste To Energy Plant (Wte)
This financial model provides a detailed framework for analyzing the economic viability of a Waste-to-Energy (WtE) plant. The model includes projections for revenue streams (electricity, recycled materials, recovered heat, and ash utilization, and Gate Fees), operating expenses, capital expenditures, and financing structure With 20x Income Statements, Cash Flow Statements, Balance Sheets, CAPEX sheets, OPEX Sheets, Statement Summary Sheets, and Revenue Forecasting Charts with the specified revenue streams, BEA charts, sales summary charts, employee salary tabs and expenses sheets.
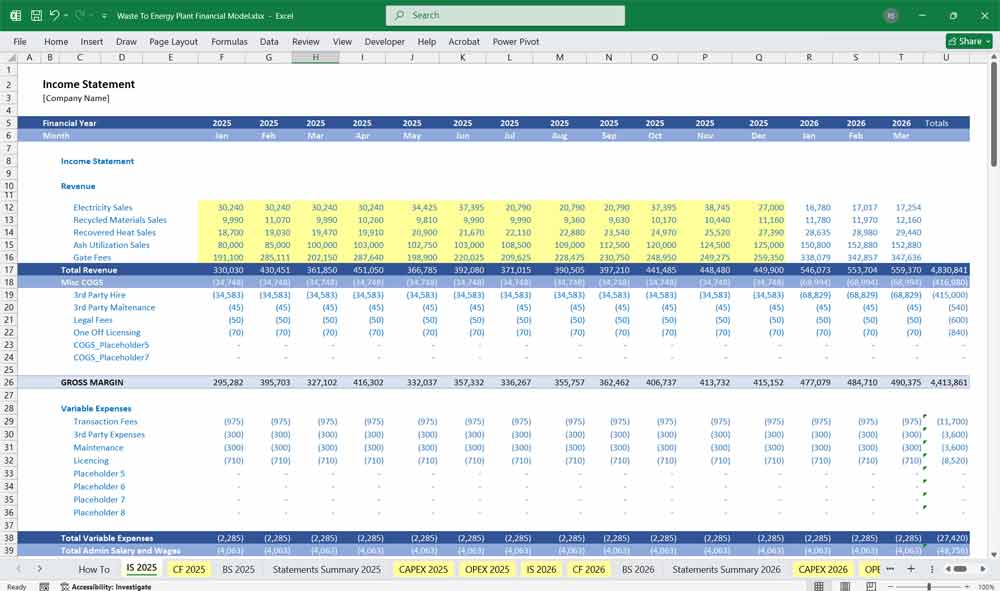
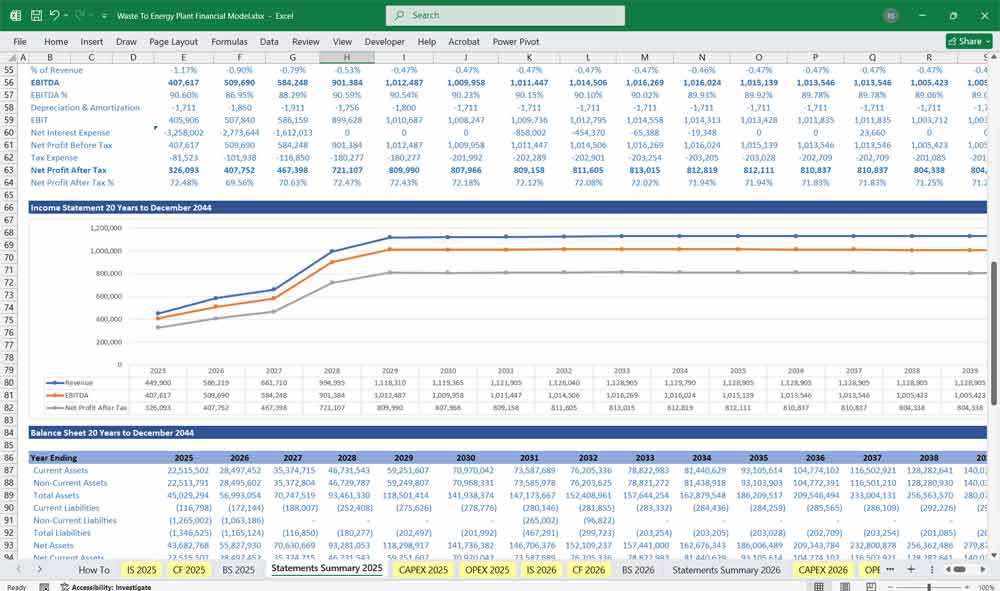
Income Statement (Profit & Loss Statement)
The Income Statement summarizes revenues, costs, and profitability over a given period (typically annually).
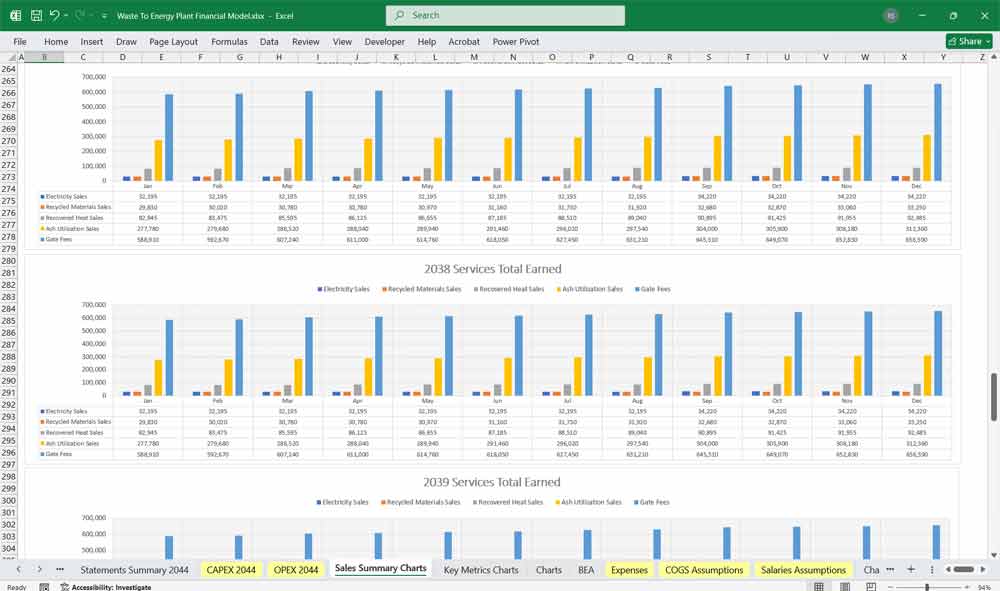
Revenue Streams
Electricity Sales
Revenue from selling electricity to the grid or off-takers.
Formula:
Electricity Revenue=Energy Generated (MWh)×Tariff Rate (USD/MWh)Electricity Revenue=Energy Generated (MWh)×Tariff Rate (USD/MWh)
Assumptions:
Plant capacity (e.g., 100,000 MWh/year)
Feed-in tariff or PPA rate (e.g., $80/MWh)
Grid availability & curtailment risks
Recycled Materials Sales
Revenue from selling recovered metals (ferrous/non-ferrous) and other recyclables.
Formula:
Recycled Revenue=Tons of Recyclables×Market Price per TonRecycled Revenue=Tons of Recyclables×Market Price per Ton
Assumptions:
5-10% of input waste is recoverable metal
Market price volatility (e.g., $200/ton for ferrous metals)
Recovered Heat Sales (if applicable)
Revenue from district heating or industrial heat supply.
Formula:
Heat Revenue=Thermal Energy Sold (GJ)×Heat Price (USD/GJ)Heat Revenue=Thermal Energy Sold (GJ)×Heat Price (USD/GJ)
Assumptions:
30-50% of waste energy converted to usable heat
Heat price depends on local demand (e.g., $10/GJ)
Ash Utilization Sales
Revenue from selling bottom ash for construction (e.g., road base, cement substitute).
Formula:
Ash Revenue=Tons of Ash Sold×Price per TonAsh Revenue=Tons of Ash Sold×Price per Ton
Assumptions:
20-30% of input waste becomes ash
Ash market price (e.g., $15/ton)
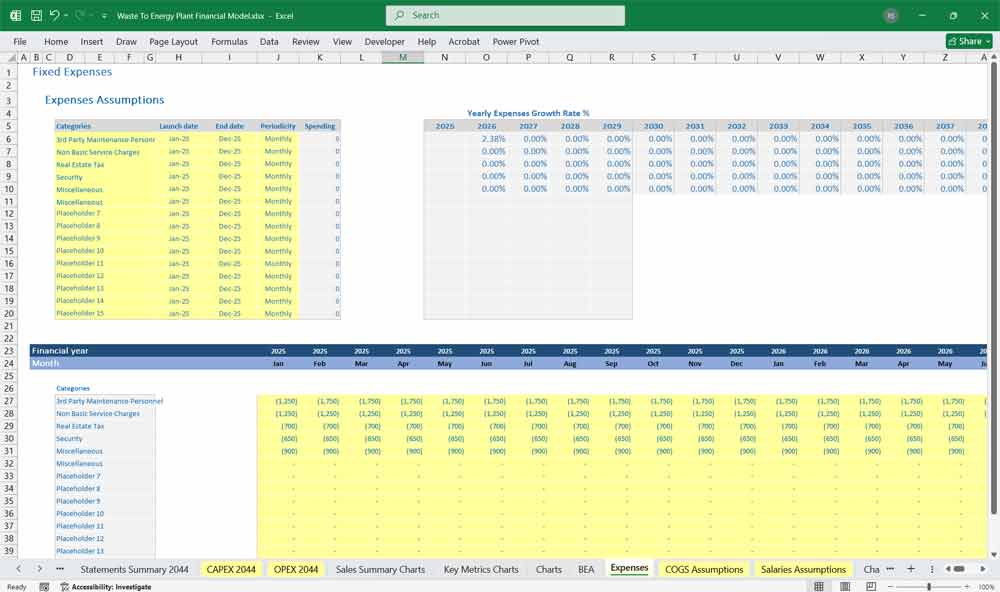
Operating Costs
Waste Supply Costs
Tip fees (if paid) or revenue (if charging for waste intake).
Formula:
Waste Cost=Tons Processed×Tip Fee (USD/ton)Waste Cost=Tons Processed×Tip Fee (USD/ton)
Assumptions:
Municipal contracts may guarantee supply
Tip fee: $50-$100/ton
Labor & Maintenance
Salaries, plant maintenance, and repairs.
Assumptions:
Fixed O&M: $5M/year
Variable O&M: $10/ton
Fuel & Consumables
Auxiliary fuel (if needed), chemicals, water.
Ash Disposal Costs
If ash is not sold, landfill costs apply.
Other Costs
Insurance, permits, compliance (emissions control).
Depreciation & Amortization
Straight-line depreciation over plant life (e.g., 20-25 years).
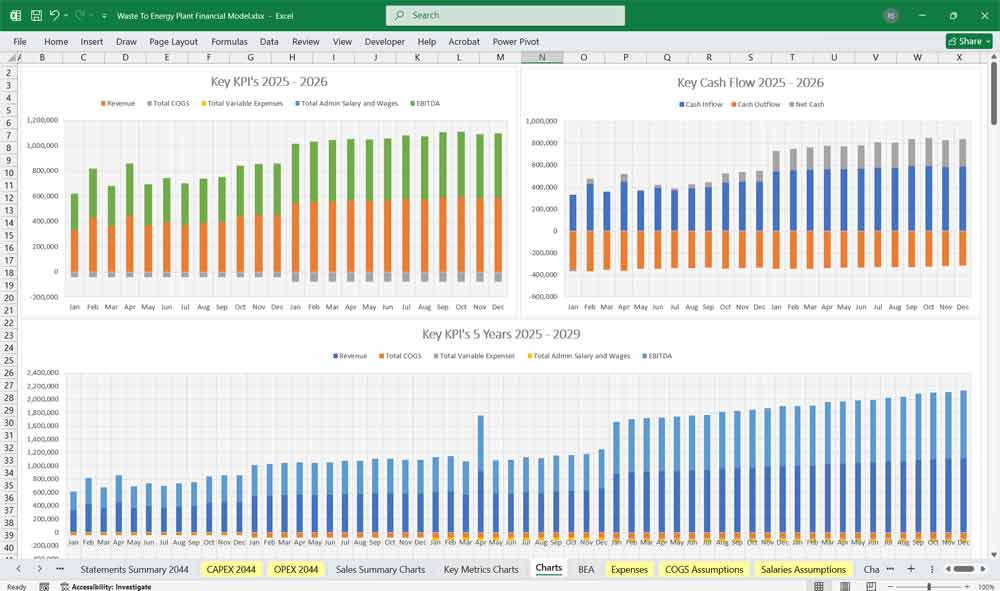
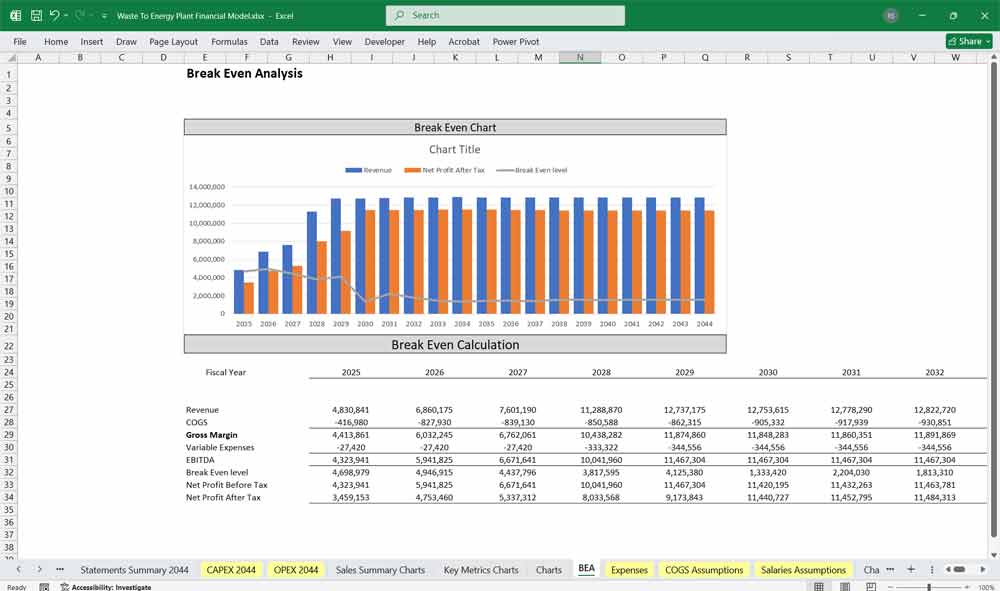
EBITDA & Net Profit
EBITDA = Total Revenue – Operating Costs
Net Profit = EBITDA – Interest – Taxes – Depreciation
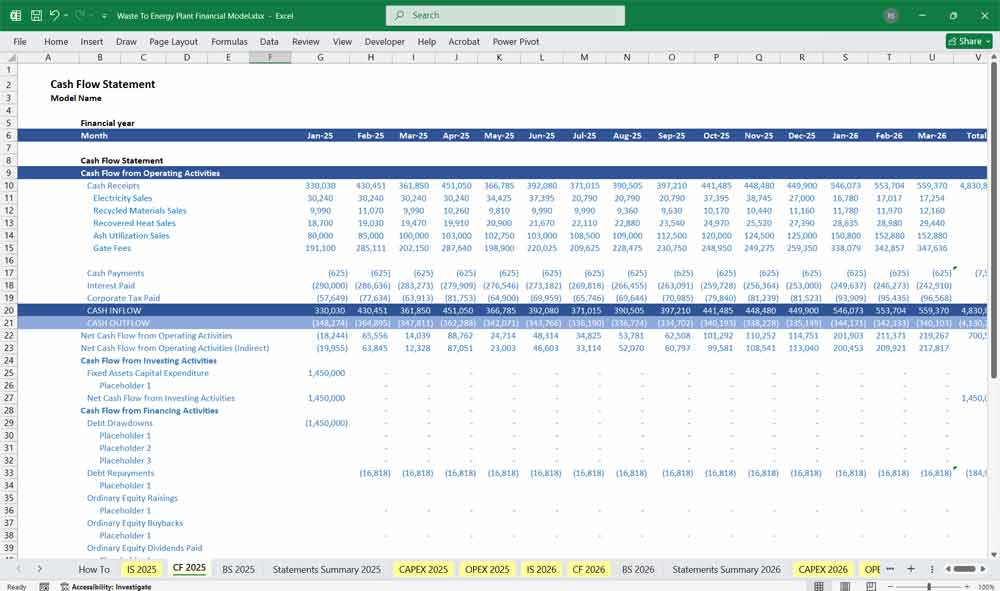
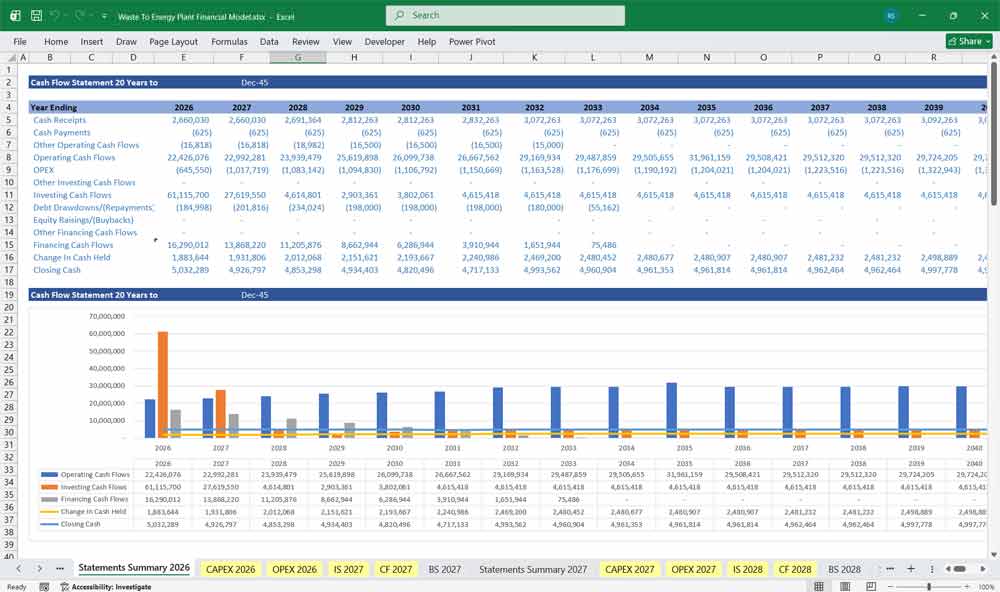
Waste To Energy Plant Cash Flow Statement
The Cash Flow Statement tracks actual cash inflows and outflows, separated into:
Operating Activities
Cash Inflows:
Electricity sales
Recycled materials sales
Recovered heat sales
Ash sales
Cash Outflows:
Waste procurement
Labor & maintenance
Utilities & consumables
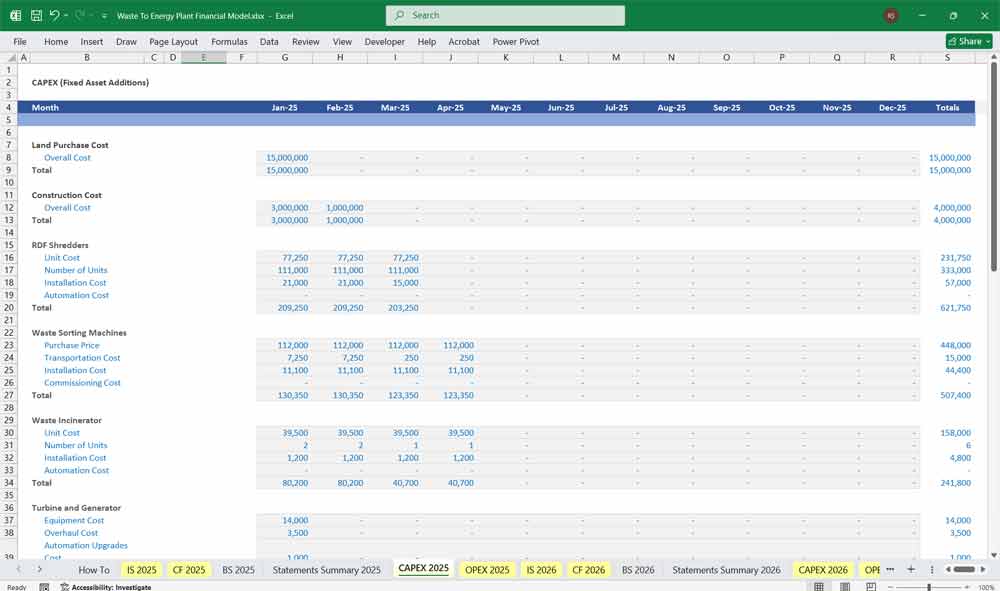
Investing Activities
Capital Expenditures (CapEx):
Plant construction ($500M-$1B for 500-1,000 TPD plant)
Equipment upgrades
Financing Activities
Debt Financing:
Loan drawdowns
Interest payments
Equity Financing:
Investor capital injections
Dividend payments (if applicable)
Free Cash Flow (FCF)
FCF=Operating Cash Flow−CapExFCF=Operating Cash Flow−CapEx
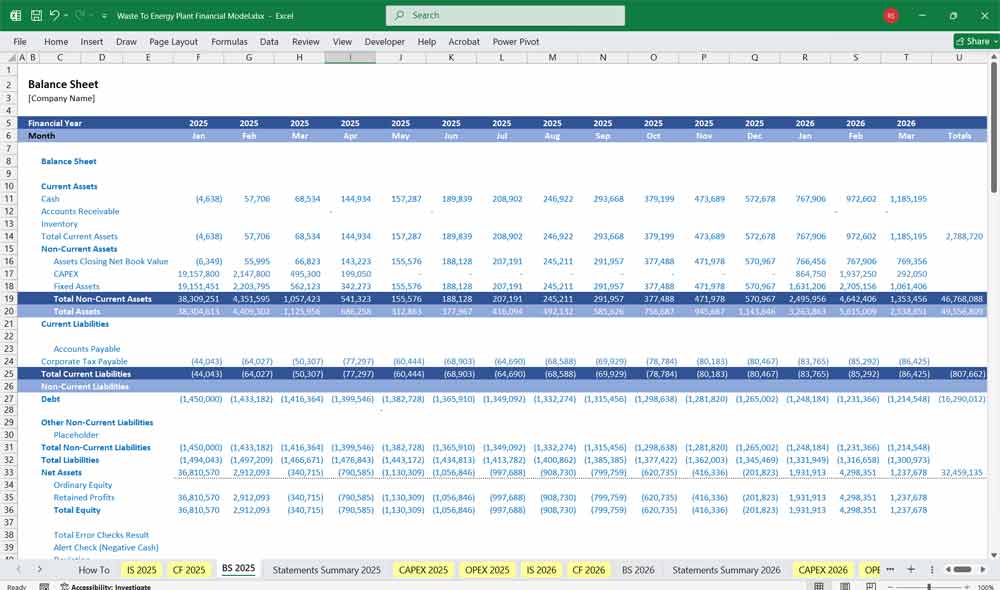
Waste To Energy Plant Balance Sheet
The Balance Sheet provides a snapshot of the plants financial position at a given time.
Assets
Current Assets
Cash & receivables (electricity payments, recycling revenue)
Inventory (recycled materials, ash stock)
Non-Current Assets
Property, Plant & Equipment (PP&E) (WtE plant, machinery)
Accumulated depreciation
Liabilities
Current Liabilities
Accounts payable (waste suppliers, maintenance contractors)
Short-term debt
Non-Current Liabilities
Long-term project debt
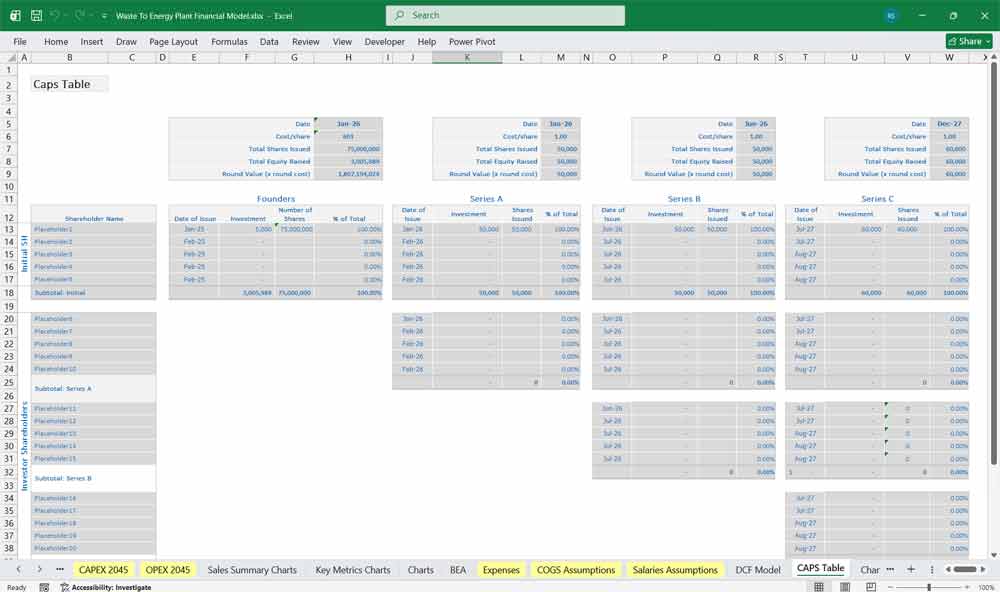
Equity
Shareholder equity (initial capital + retained earnings)
Key Financial Metrics For A Waste To Energy Plant
Net Present Value (NPV)
Discounted cash flows to assess project viability.
Internal Rate of Return (IRR)
Expected annualized return (target >12-15%).
Debt Service Coverage Ratio (DSCR)
Minimum 1.2x to secure financing.
Payback Period
Typically 7-12 years for WtE plants.
Waste to Energy Plant and Electricity Sales Revenue
The primary revenue stream for a Waste-to-Energy (WtE) plant comes from selling electricity generated through waste incineration. The plant converts thermal energy into power, which is either fed into the grid or sold under a Power Purchase Agreement (PPA). Revenue depends on the plant’s capacity (e.g., MWh/year) and the local electricity tariff (e.g., $80–$120/MWh). Factors like grid availability, regulatory incentives (feed-in tariffs), and operational efficiency impact earnings.
Recycled Materials Revenue From Your Waste To Energy Plant
During waste processing, metals (ferrous and non-ferrous) are recovered and sold to scrap dealers or recycling facilities. This provides an additional revenue stream, with prices fluctuating based on commodity markets (e.g., $200–$500/ton for metals). The amount recovered depends on waste composition, typically 5–10% of input volume. Efficient sorting technology maximizes yield, making this a profitable byproduct of WtE operations.
Waste To Energy Plant and Recovered Heat Sales Revenues
Some WtE plants utilize excess heat for district heating or industrial processes, creating another income source. Revenue is generated by selling thermal energy (in GJ or MWh) to nearby factories, greenhouses, or residential heating networks. Pricing varies by region (e.g., $5–$20/GJ), and profitability depends on proximity to heat demand. Combined heat and power (CHP) systems enhance efficiency, making this a key revenue driver in colder climates.
Gaining Ash Utilization Revenues With Your Waste To Energy Plant
Bottom ash from incineration can be processed and sold for construction applications, such as road base or cement production. Revenue depends on ash quality and local demand (e.g., $10–$30/ton). If markets are unavailable, disposal costs (landfill fees) apply instead. Innovative ash treatment (e.g., metal recovery, aggregate production) can turn a waste product into a sustainable income stream, improving the plant’s overall economics.
Revenue from Gate Fees With Your Waste To Energy Plant
A significant revenue stream for Waste-to-Energy (WtE) plants comes from gate fees, which are charges levied on waste suppliers (e.g., municipalities, businesses) for accepting and processing their waste. These fees typically range from $50–$150 per ton, depending on local landfill costs, competition, and regulatory policies. Gate fees provide stable, contracted income, often backed by long-term waste supply agreements, reducing revenue volatility. In some cases, plants may even earn dual revenue—charging gate fees while also profiting from energy and material sales—enhancing overall financial viability. This model ensures a consistent cash flow, helping offset operational costs and improving project bankability.
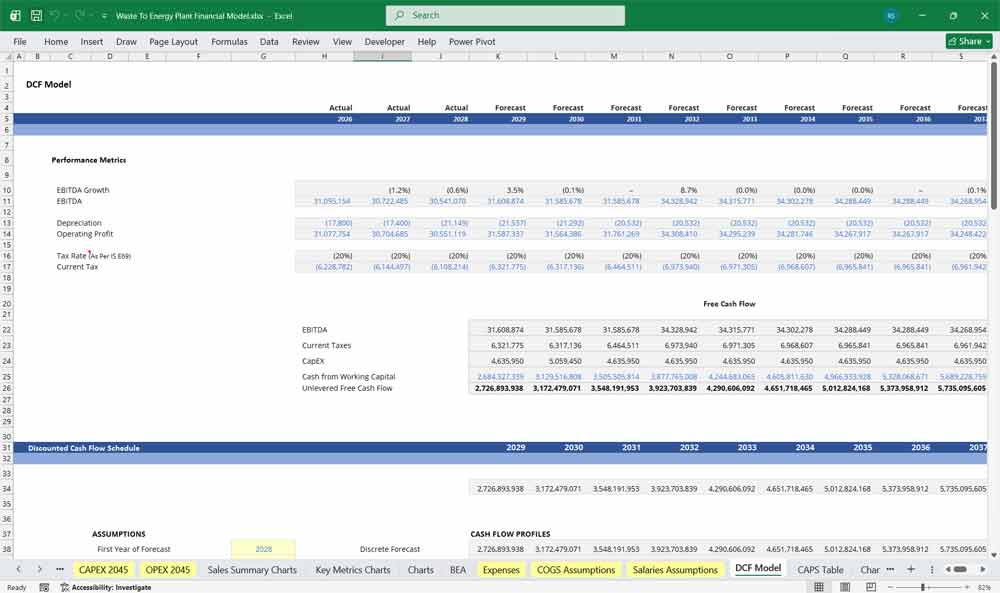
Waste To Energy Plant Discounted Cash Flow (DCF) with Terminal Value, Sensitivity Analysis, and WACC
DCF: Valuing the Dual-Revenue Stream
This 20-year Discounted Cash Flow (DCF) analysis for a Waste-to-Energy (WtE) plant, the valuation is anchored by the revenue revenue model: “tipping fees” collected for processing municipal solid waste and “energy sales” from the resulting electricity or steam. Unlike traditional power plants where fuel is a cost, a WtE DCF treats the feedstock—trash—as a revenue-generating input. The model accounts for high operational complexity and the significant maintenance CapEx required for flue-gas treatment and boiler upkeep, ensuring that the Net Present Value (NPV) reflects the true cost of converting community waste into a circular energy economy.
WACC: Pricing Municipal Stability and Technical Risk
The Weighted Average Cost of Capital (WACC) for a WtE project reflects its hybrid identity as both a public utility and a complex industrial facility. Because these plants are often critical infrastructure for local governments, they frequently benefit from low-cost, long-term debt via Public-Private Partnerships (PPPs), which helps compress the overall WACC. However, the discount rate must still price in the “technical risk” of the combustion technology and potential shifts in environmental policy. A well-calibrated WACC ensures that the 20-year hurdle rate accounts for the stability of municipal contracts while acknowledging the high barriers to entry and operational intensity of the sector.
Sensitivity Analysis: Stress-Testing Trash “Quality” and Tariffs
For a Waste-to-Energy plant, Sensitivity Analysis is the primary tool for navigating the unpredictability of waste streams and energy markets. Analysts use sensitivity tables to see how a 10% drop in the calorific value of the waste (the “energy density” of the trash) impacts steam production and electricity yields. Furthermore, the analysis must stress-test the model against fluctuating tipping fees and the rising cost of carbon emissions. By identifying the break-even point where the plant can no longer compete with local landfills, the sensitivity analysis reveals the project’s resilience to changing recycling habits and evolving “zero-waste” mandates.
Final Notes on the Financial Model
This 20 Year Waste To Energy Plant Financial Model must focus on balancing capital expenditures with steady revenue growth from Electricity Sales, Recycled Materials Sales, Recovered Heat Sales, etc. By optimizing operational costs, power efficiency, and maximizing high-margin services like Eelectricity sales and Gate Services, the model ensures sustainable profitability and cash flow stability.
Download Link On Next Page
Download Link On Next Page