
Virtual Reality DCF Financial Model Template
This 3-Statement Excel Virtual Reality DCF Financial Model Template covers revenue and expenditure streams from development, subscriptions, banner advertising, affiliates etc. With cost structures, and financial statements to forecast the financial health of your company.
Financial Model for a Virtual Reality Software Company
Software Development: Software Development as a Service (SDaaS)
Benefits of MRR Subscription service in software development and distribution:
Flexibility: Teams in different regions can work around the clock, leveraging the expertise of team members during their peak hours
Scalability: The flexibility in scaling resources aligns with non-traditional workflows
Cost-effectiveness: Customers only pay for the result, without the need to assemble a team, pick technologies, or pay for idle time or overtime.
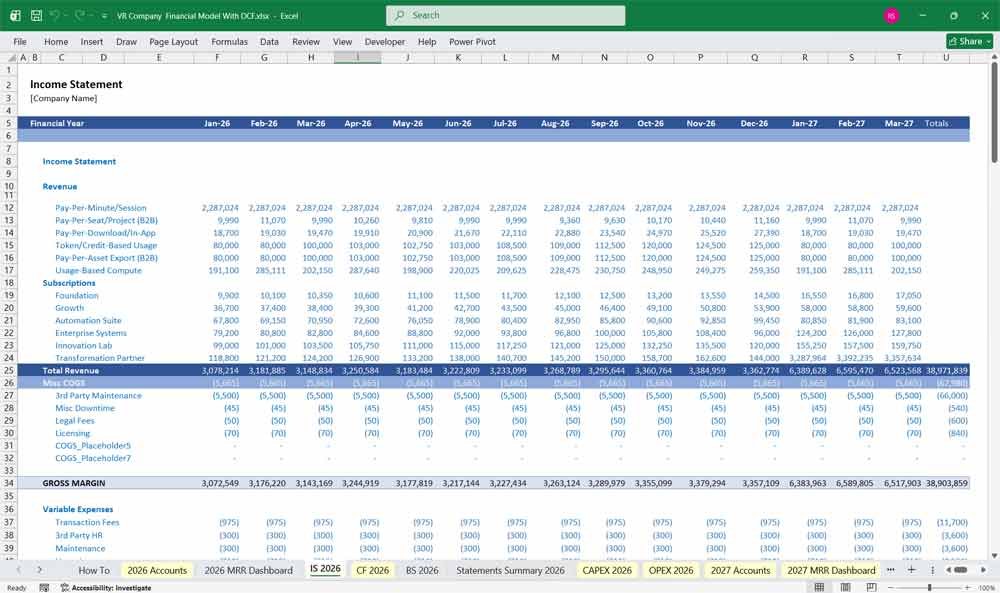
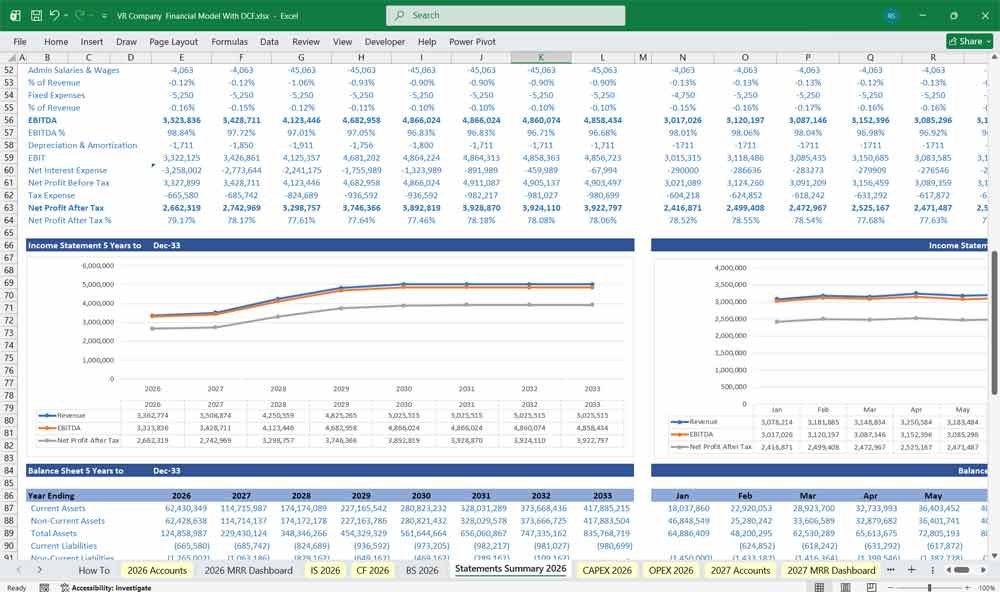
Virtual Reality Income Statement (Profit & Loss Statement)
The Income Statement shows the company’s profitability over a specific period, including revenue sources, operating expenses, and net income.
Revenue Streams
- Direct Software Sales – Sales of VR games and applications via platforms (SteamVR, Oculus Store, PlayStation VR, etc.).
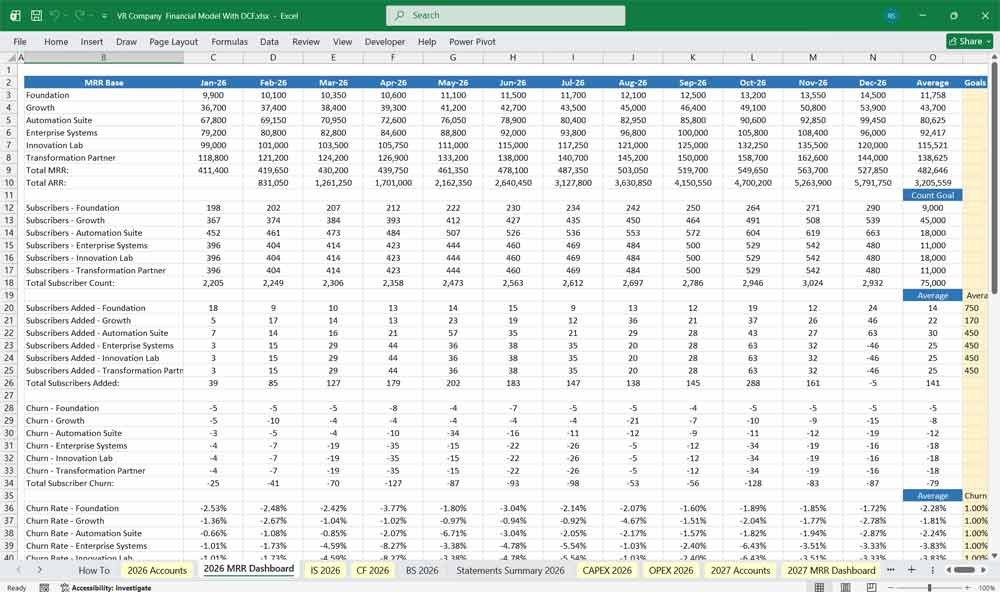
- Subscription Revenue – Recurring revenue from different subscription tiers (Gamer, Developer, Studio, Enterprise, etc.).
- VR Content Licensing – Licensing VR experiences to third parties (businesses, educational institutions, healthcare, etc.).
- Esports & Competitive Gaming Revenue – Sponsorships, tournament fees, advertising, and revenue share from competitions.
- Custom VR Development – Revenue from businesses commissioning custom VR experiences.
- Advertising & Partnerships – In-game advertisements, brand sponsorships, and affiliate marketing.
- Asset & Marketplace Sales – Selling VR assets, environments, or modding tools to developers.
Expenses (Costs & Operating Costs)
Cost of Goods Sold (COGS)
- Server hosting costs for online VR content & multiplayer games
- Revenue share with distribution platforms (Steam, Meta, etc.)
- Licensing fees for third-party engines (Unity, Unreal Engine)
- VR asset creation & acquisition costs
Operating Expenses (OPEX)
- Development Costs – Salaries for developers, designers, and engineers
- Marketing & Advertising – Promotions, influencer partnerships, esports sponsorships
- General & Administrative (G&A) Expenses – Office expenses, software tools, legal, HR
- Customer Support & Community Management – Salaries for support staff and forum moderators
- Research & Development (R&D) – Investment in new VR technology and innovation
Profitability Metrics
- Gross Profit = Revenue – COGS
- Operating Profit = Gross Profit – Operating Expenses
- Net Profit = Operating Profit – Taxes & Interest Expenses
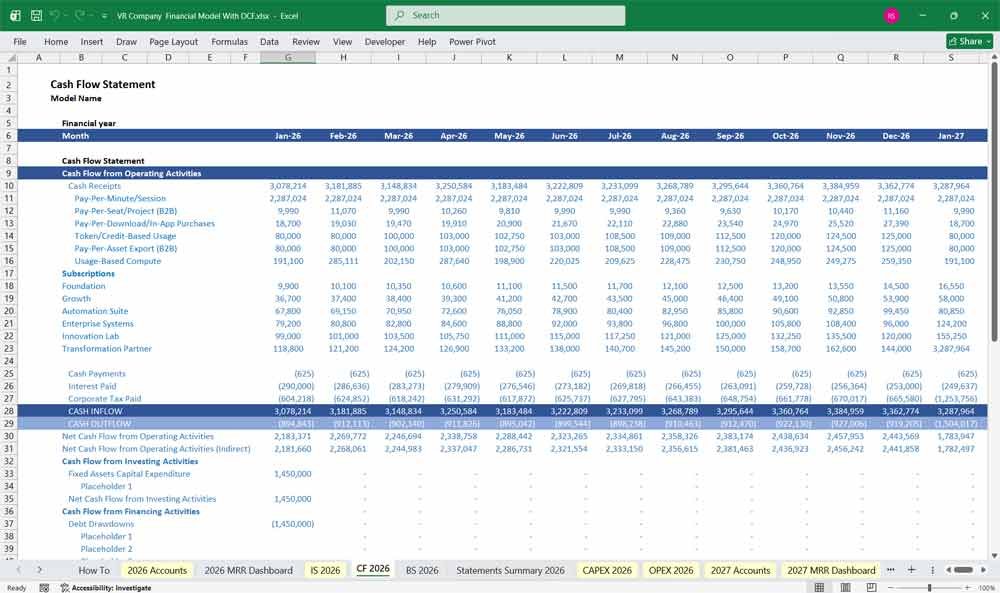
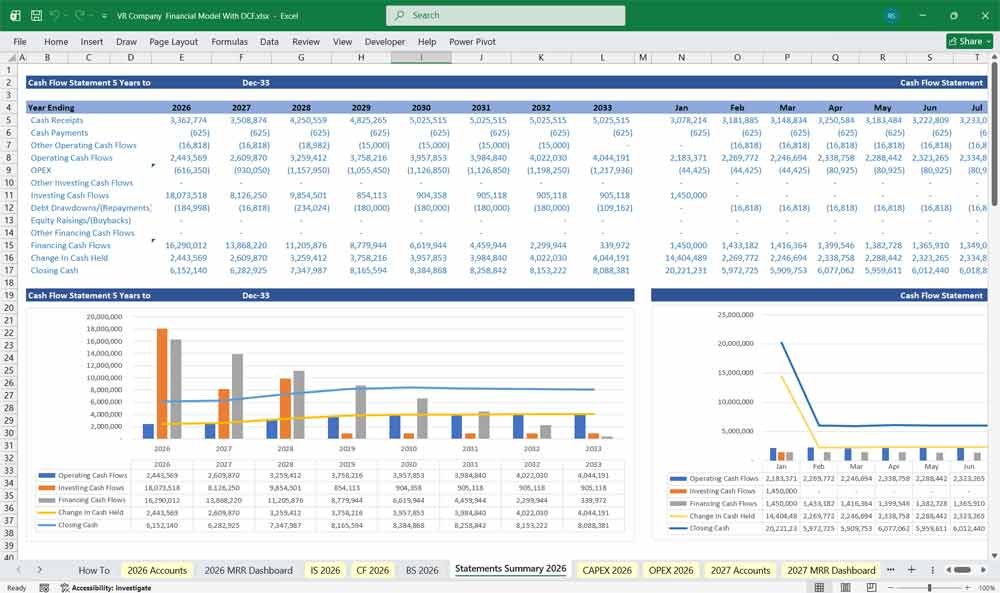
Virtual Reality Cash Flow Statement
The Cash Flow Statement tracks cash movements in and out of the company and ensures financial sustainability.
Operating Cash Flow (Cash Inflows & Outflows from Core Business)
Cash Inflows
- Revenue from VR software & subscriptions
- Payments from licensing deals
- Revenue from esports sponsorships and ticket sales
- Upfront payments from enterprise clients
Cash Outflows
- Salaries for employees and contractors
- Server and hosting costs
- Marketing expenses
- R&D and content production costs
Investing Cash Flow (Asset Purchases & Investments)
Cash Inflows
- Sale of old equipment or intellectual property
- Investment income from acquired companies
Cash Outflows
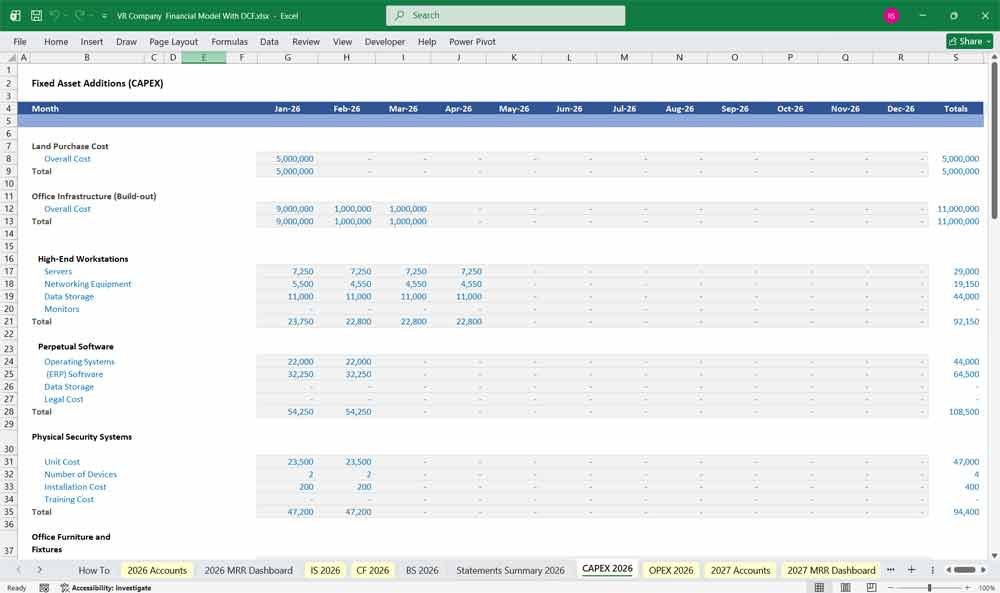
- Purchase of new VR equipment & motion capture tech
- Development of proprietary VR engines or tools
Financing Cash Flow (Funding & Debt Management)
Cash Inflows
- Venture capital investments
- Loans or government grants for VR innovation
- Crowdfunding campaigns
Cash Outflows
- Loan repayments
- Dividends paid to investors
- Buyback of company shares
Key Cash Flow Metrics
- Free Cash Flow (FCF) = Operating Cash Flow – Capital Expenditures
- Cash Burn Rate = Monthly Operating Expenses – Revenue
- Runway = Cash Reserves / Monthly Cash Burn Rate
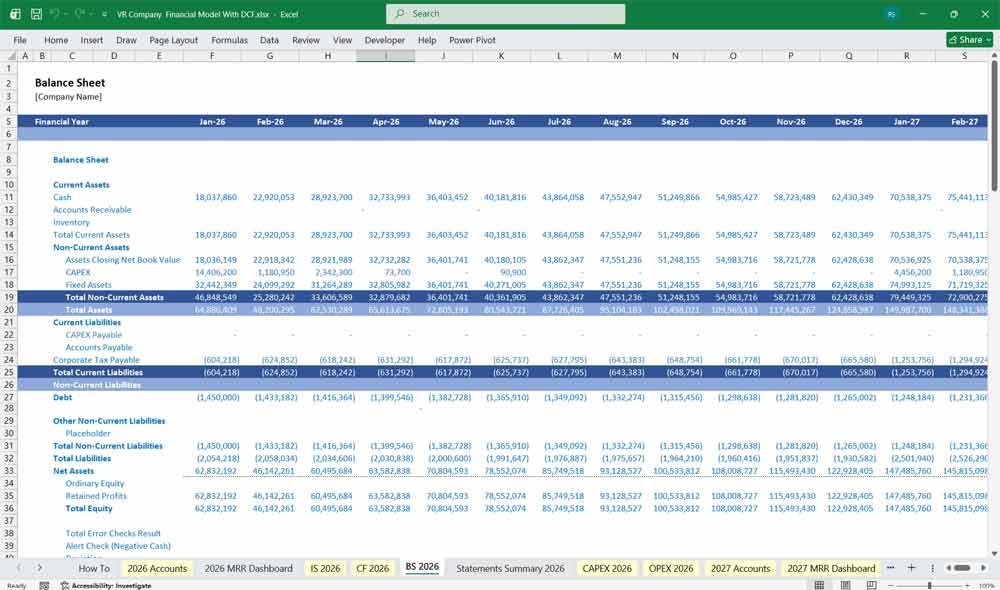
Virtual Reality Balance Sheet
The Balance Sheet provides a snapshot of the company’s financial position at a given time.
Assets (What the Company Owns)
Current Assets
- Cash & Cash Equivalents (cash in bank accounts)
- Accounts Receivable (payments due from customers & platforms)
- Inventory (VR assets, game licenses, digital products)
Non-Current Assets
- Intellectual Property (VR game licenses, proprietary engines)
- VR Equipment & Hardware (motion capture tools, VR headsets)
- Software Development Costs (capitalized software expenses)
Liabilities (What the Company Owes)
Current Liabilities
- Accounts Payable (outstanding payments to suppliers)
- Short-Term Loans (bank loans due within a year)
- Deferred Revenue (prepaid subscriptions, esports entry fees)
Non-Current Liabilities
- Long-Term Debt (venture capital loans, corporate bonds)
- Lease Obligations (office & studio space leases)
Equity (Owner’s Share of the Business)
Shareholder’s Equity
- Paid-in Capital (funds raised from investors)
- Retained Earnings (profits reinvested into the company)
Key Balance Sheet Metrics
- Current Ratio = Current Assets / Current Liabilities (Liquidity Check)
- Debt-to-Equity Ratio = Total Liabilities / Shareholder’s Equity (Financial Leverage)
- Return on Assets (ROA) = Net Income / Total Assets (Profitability Efficiency)
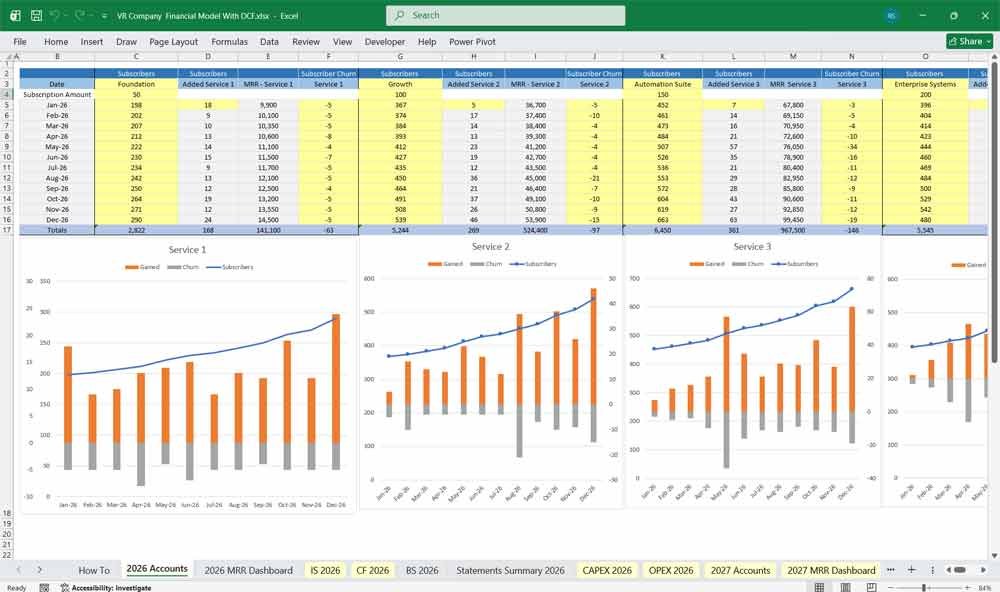
6 Tier Subscription For a Virtual Reality Software Company
1. Free / Trial Virtual Reality Tier (Entry-Level)
- Limited access to sample VR experiences
- Basic VR content player (ad-supported)
- Access to community forums
- Watermarked VR previews
- Monthly newsletter with industry insights
2. Enthusiast Virtual Reality Tier ($10-$25/month)
- Full access to a library of VR experiences
- Offline playback for select content
- Early access to new experiences
- No ads
- Basic customer support
3. Creator Virtual Reality Tier ($50-$100/month)
- Access to VR creation tools (limited export options)
- Use of pre-made assets & templates
- Licensing for non-commercial projects
- Cloud storage for VR content
- Standard customer support
4. Professional Virtual Reality Tier ($250-$500/month)
- Advanced VR production tools & software
- Commercial licensing for VR content
- High-quality export options (4K/8K support)
- Collaboration tools for teams
- Priority customer support
5. Enterprise Virtual Rality Tier ($1,000+/month)
- All Professional features
- Custom VR content production services
- Dedicated cloud hosting for VR projects
- API integrations for business applications
- Dedicated account manager
6. Partner / Studio Virtual Reality Tier (Custom Pricing)
- Co-production & funding for VR projects
- Exclusive distribution & marketing support
- Revenue-sharing on VR content sales
- Custom-built VR solutions for specific industries
- Personalized 24/7 support
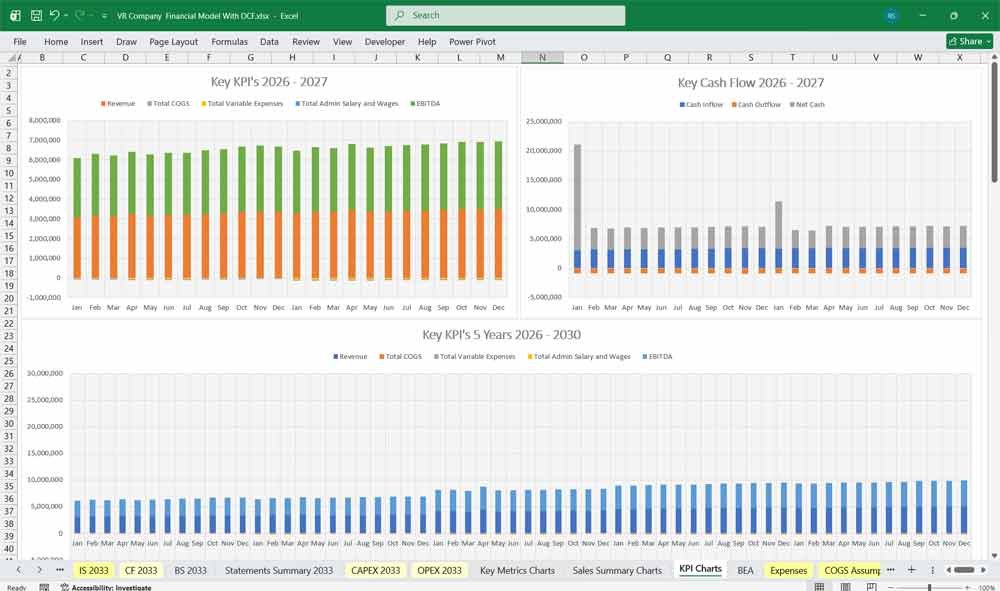
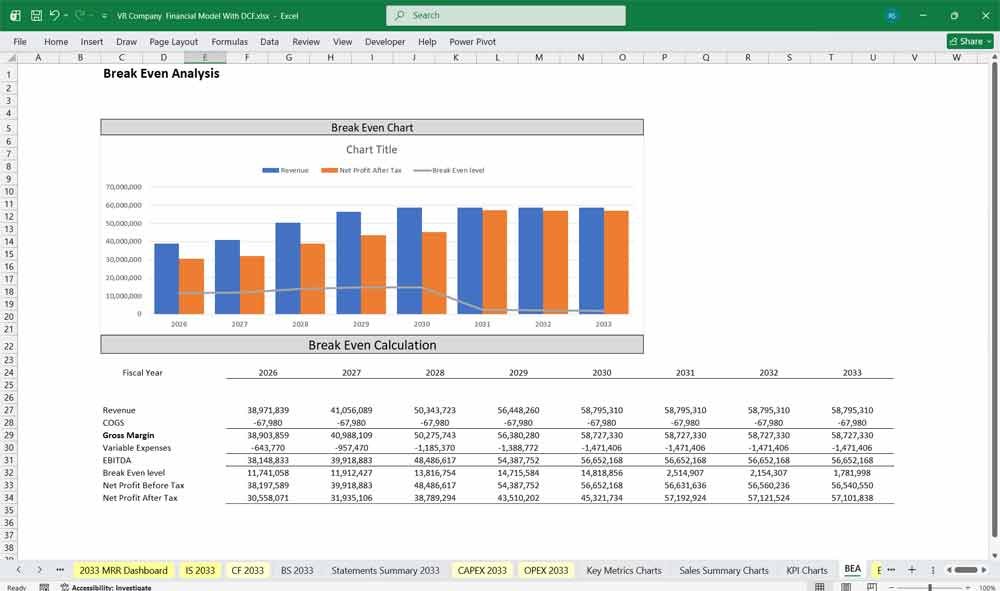
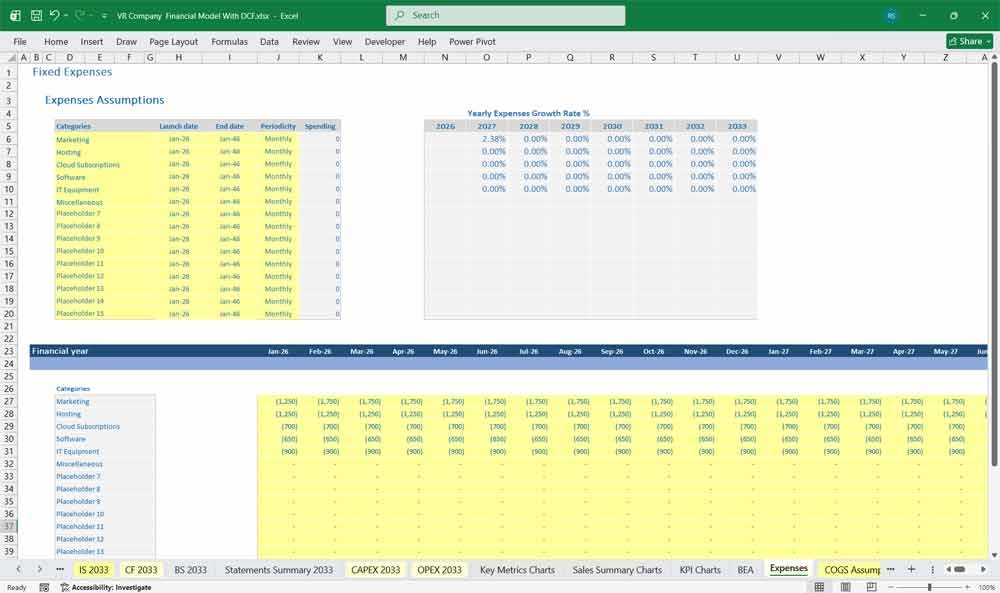
Value Your Virtual Reality Software Company With A DCF
Discounted Cash Flow DCF: Valuing Ecosystem Expansion and Hardware Cycles
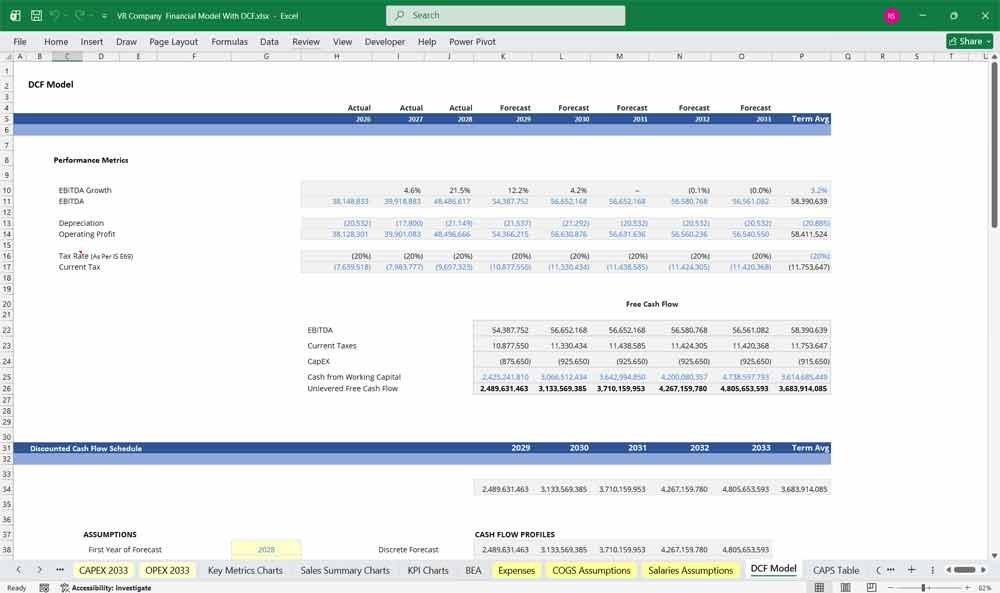
In a 5-year Discounted Cash Flow (DCF) analysis for a Virtual Reality (VR) software company, the valuation tracks an aggressive monetization runway driven by app store sales, enterprise training licenses, and in-experience digital goods. The model projects cash flows offset not by physical manufacturing CapEx, but by immense, front-loaded software research and development (R&D) costs and developer salaries. A compressed 5-year horizon is critical because VR software adoption is tethered to external hardware upgrade cycles—such as the release of lighter, higher-resolution headsets or spatial computing glasses. Consequently, the Terminal Value in Year 5 represents the overwhelming majority of the asset’s total NPV, pricing in the company’s ability to transition from a single hit application into an enduring, platform-agnostic spatial computing ecosystem.
WACC: Pricing Adoption Friction and “Ecosystem Lock-In”
The Weighted Average Cost of Capital (WACC) for a VR software developer sits in a premium range of 13% to 17%, reflecting a business profile defined by steep technological execution risk and early-stage market friction. Because software studios operate with virtually zero physical collateral to back traditional corporate debt, their capital structures are almost entirely dominated by a high Cost of Equity demanded by venture capital or growth equity. The discount rate must factor in a severe “Hardware Reliance and Discretionary Beta.” Investors demand a high hurdle rate to insulate future cash flows from risks like slow mainstream VR adoption, sudden changes in platform fee structures from ecosystem gatekeepers (like Meta or Apple), and rapid shifts in spatial user interface design.
Sensitivity Analysis: Stress-Testing Active Users and Platform Fees
For a VR software company, Sensitivity Analysis is the primary financial tool used to map the line between a viral spatial ecosystem and an obsolete application. Financial analysts use sensitivity tables to model how a 20% contraction in Monthly Active Users (MAUs) or a 15% spike in developer acquisition costs impacts the 5-year net present value. The most vital, industry-specific variables to cross-reference are the Average Monetization Per User (AMPU) and the Platform Take-Rate dictated by VR app marketplaces. If a platform gatekeeper increases its fee cut while user engagement dips, the VR studio’s profit margins evaporate. This sensitivity matrix reveals the exact point where user retention can offset the high fixed costs of building complex 3D environments.
Financial Model Summary & Key Considerations
Revenue Growth Strategy
- Expanding Virtual Reality Software subscription models
- Creating premium esports experiences
- Licensing VR content to corporate clients
Cost Management Strategy
- Optimizing server hosting costs
- Managing content production budgets
- Leveraging automation for customer support
Investment & Financing Strategy
- Securing venture capital for growth
- Diversifying revenue streams to mitigate risk
Download Link On Next Page