Vertical AI SaaS Financial Model in Excel
Planning the finances of an AI SaaS business requires more than a traditional startup spreadsheet. This Vertical AI SaaS Financial Model Excel template is a fully linked, formula-driven 60-month financial model designed specifically for AI-native SaaS companies. Model revenue, AI infrastructure and compute costs, customer growth, sales and marketing, headcount, cash flow, valuation, financing and dilution — all in one professional Excel workbook.
5-Year financial model for a native Vertical AI SaaS Company.
Built for founders, startup finance teams, fractional CFOs and investors, this AI SaaS financial model template gives you a structured five-year operating plan without having to build complex formulas from scratch. Editable, colour-coded assumptions let you quickly adjust pricing, churn, CAC, AI token costs, hiring plans, financing rounds and growth scenarios to match your business.
Traditional SaaS templates will break your AI startup’s valuation because they completely ignore LLM token costs, API calls, and GPU infrastructure scaling. If you are raising capital, you need a forecast that venture capitalists actually trust. Unlike a generic SaaS financial model, this template captures the economics that are unique to Vertical AI SaaS businesses. The AI Infrastructure & Compute COGS schedule models token consumption, prompt and completion tokens, API costs, cost per query and infrastructure scaling per active user. Combined with customer cohort analysis, SaaS unit economics, GTM modelling and a fully integrated three-statement model, it provides a comprehensive financial planning and fundraising tool.
AI SaaS Tab-By-Tab Highlights
1. Cover Page
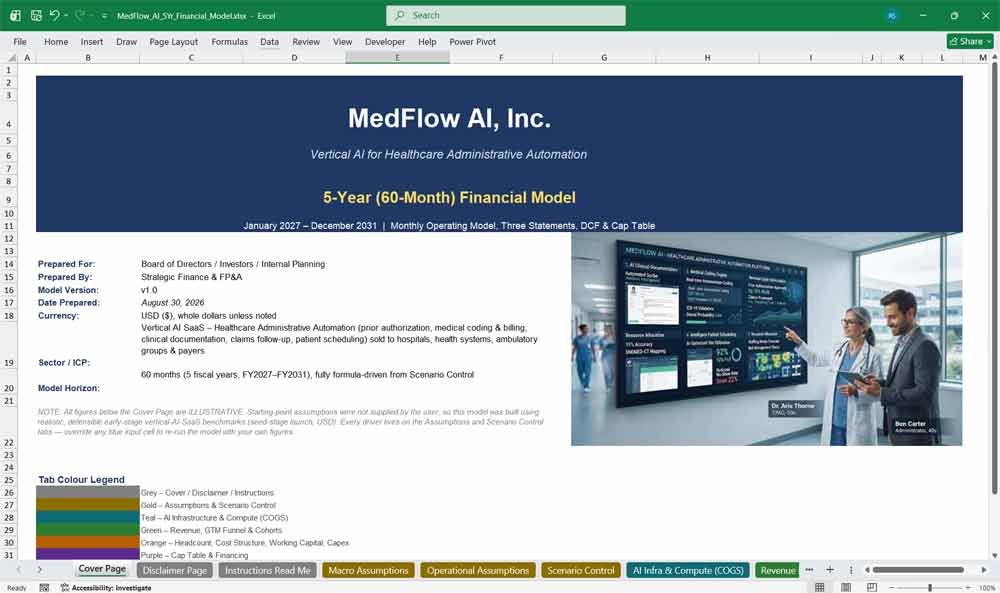
A professional financial model cover page that sets the tone before an investor opens a single formula. It carries your company name, tagline, model version, preparation date, sector/ICP, and model horizon in a clean, board-ready layout — plus a full tab-color legend so anyone opening the workbook for the first time immediately understands how the model is organized.
- Editable company name, tagline, and “prepared for / prepared by” fields for instant white-labeling
- Auto-populating “date prepared” field via formula, so the cover page never goes stale
- Built-in tab-color legend explaining every section of the 24-tab Excel financial model template
- Sets the model horizon (60 months / 5 fiscal years) and currency at a glance
2. Disclaimer Page
A financial model disclaimer and basis-of-preparation page written the way institutional investors expect to see one — covering forward-looking statements, source of assumptions, valuation limitations, and confidentiality. It’s the page that signals this isn’t a back-of-napkin spreadsheet; it’s a professionally scoped investor-ready financial projection template.
- Standard forward-looking-statements language for board decks and fundraising data rooms
- Clear “source of assumptions” section explaining every benchmark input is editable
- Valuation-limitations language covering the DCF and comparable-multiples methodology
- Confidentiality notice ready to adapt for real company use
3. Instructions Read Me
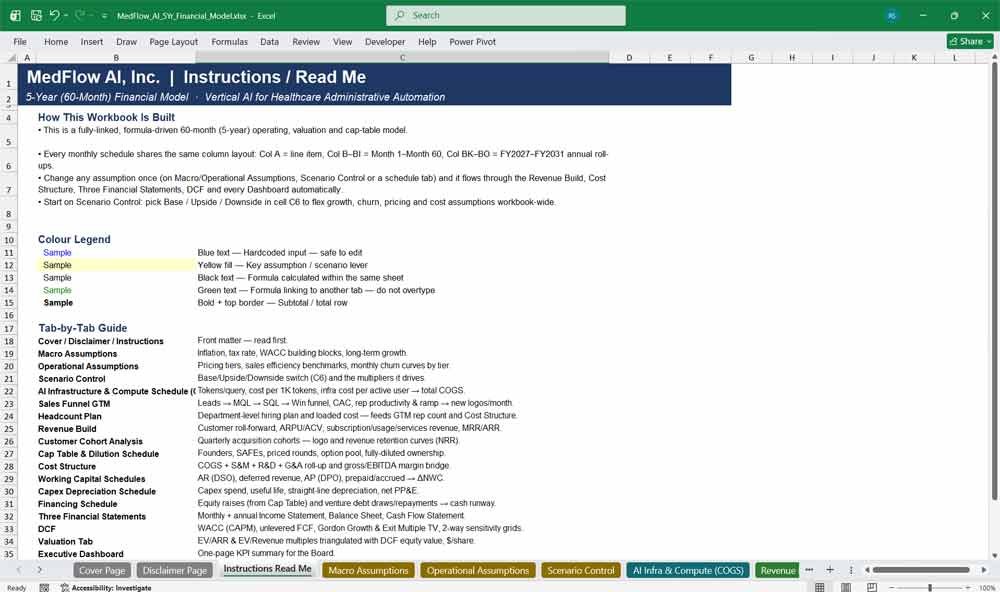
The onboarding tab that turns a 24-tab, thousands-of-formula Excel financial model into something a new user can navigate in minutes. It documents the shared monthly-grid layout, the color-coding convention, and gives a plain-English, tab-by-tab guide to what every schedule does and how it connects to the next.
- Full color-code legend (blue inputs, black formulas, green cross-tab links, bold totals)
- Explains the shared 60-month + 5-year annual roll-up column layout used on every tab
- Tab-by-tab guide summarizing what each of the 24 sheets does in one line
- Points directly to Scenario Control as the single switch that flexes the whole model
Choose the right vertical for a 5-year AI SaaS model for you
This is critical because it dictates your ACV (Annual Contract Value), sales cycle, churn rate, and AI compute costs. This model covers:
- Healthcare / MedTech AI Administrative Automation
We’re currently creating models for:
- LegalTech / Contract Intelligence & Compliance
- PropTech / Commercial Real Estate Underwriting & Asset Management
- InsurTech / Commercial Underwriting & Claims Processing
Require a timeline for these models? or require something different? Contact Us.
Vertical AI Revenue Analysis
4. Macro Assumptions
The macro assumptions tab that anchors every downstream schedule to consistent, defensible economic and valuation inputs — inflation, tax rate, and the full WACC / CAPM input set (risk-free rate, equity risk premium, beta, size premium, cost of debt, target D/E) used later in the DCF, plus useful-life assumptions for the depreciation schedule.
- Single source of truth for inflation and effective tax rate used across the model
- Full CAPM building blocks (risk-free rate, ERP, beta, size premium) feeding the DCF’s WACC calculation
- Cost of debt and target debt/equity ratio for a fully weighted WACC
- Useful-life assumptions (software, equipment, furniture) driving the capex depreciation schedule
5. Operational Assumptions
Where the SaaS pricing and churn model lives: a three-tier pricing table (Starter / Professional / Enterprise) with mix, users-per-account, implementation fee, and annual price-increase inputs, plus a full tenure-based churn curve broken into five discrete age bands and the sales-efficiency benchmarks that drive the GTM funnel.
- Editable 3-tier pricing table with blended-mix weighting built in
- Usage-based pricing input (cost per 1,000 queries) for AI-native, consumption-priced products
- Five-band tenure churn curve (months 1–6, 7–12, 13–24, 25–36, 37+) for realistic cohort decay
- Expansion/upsell rate, seat-growth rate, and target Magic Number / CAC payback / LTV:CAC benchmarks
6. Scenario Control
A single-cell Base / Upside / Downside scenario switch that flexes growth, churn, pricing, and cost assumptions across the entire 60-month model at once — the fastest way to stress-test a SaaS financial model template without touching a single downstream formula.
- One dropdown cell drives growth, churn, pricing, and cost multipliers workbook-wide
- Data-validation dropdown for Base / Upside / Downside case selection
- Model start-date control cell that re-dates every schedule automatically
- Built for board presentations and investor “what-if” questions in real time
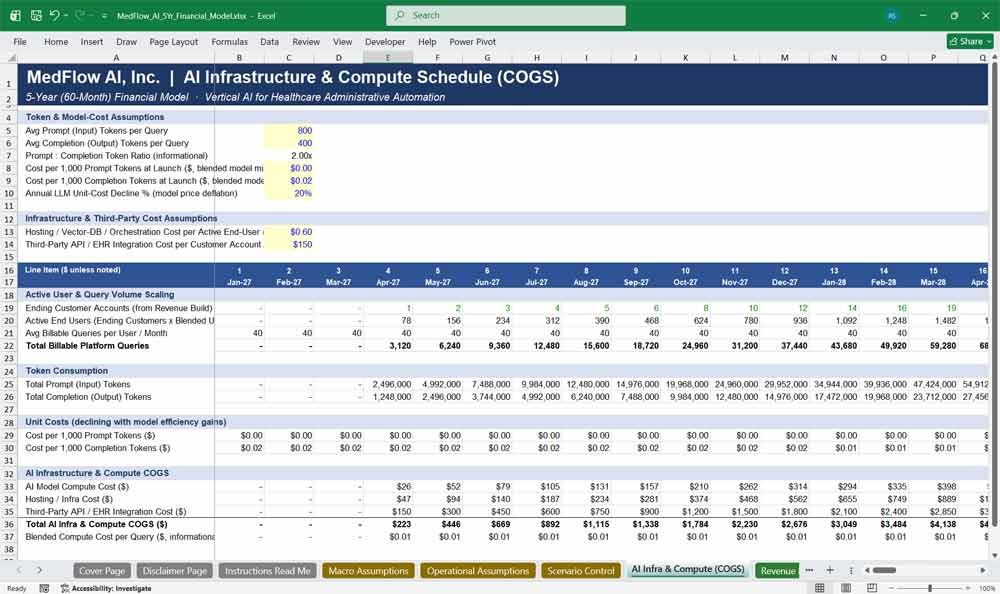
7. AI Infrastructure & Compute Schedule (COGS)
The tab that makes this an AI SaaS financial model template rather than a generic one: a full LLM token cost and compute COGS model covering prompt/completion token consumption per query, cost per 1,000 tokens (with an annual decline curve for model-cost deflation), hosting and third-party infrastructure costs, and infrastructure scaling per active user.
- Token-level cost modeling: prompt tokens, completion tokens, and blended cost per query
- Annual model-cost decline curve, so falling LLM API prices are built into the forecast
- Active-user-driven compute scaling tied directly to the Revenue Build customer count
- Total AI Infrastructure & Compute COGS line feeding gross margin on the Cost Structure tab
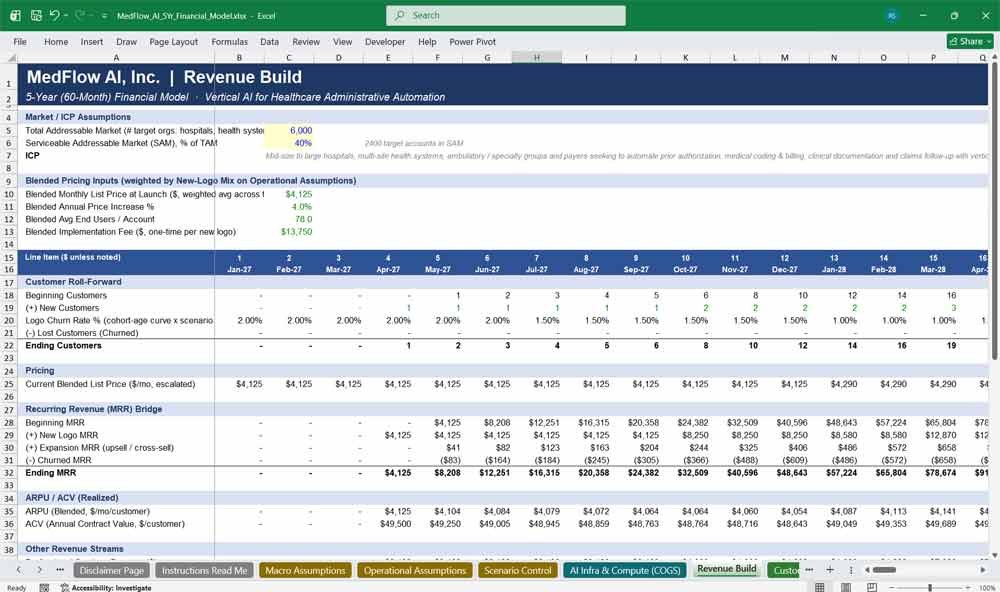
8. Revenue Build
The core SaaS revenue model and MRR/ARR bridge: TAM/SAM sizing, blended pricing, a full monthly customer roll-forward (beginning, new, churned, ending), and a complete MRR bridge (beginning, new-logo, expansion, churned, ending MRR) alongside subscription, usage-based, professional services, and implementation revenue streams.
- Full customer roll-forward and MRR bridge, both fully reconciled and audit-checked
- Blended ARPU and ACV calculated live from realized pricing and customer counts
- Four distinct revenue streams: subscription, usage-based, professional services, implementation
- Monthly MRR and annualized ARR summary feeding every dashboard in the workbook
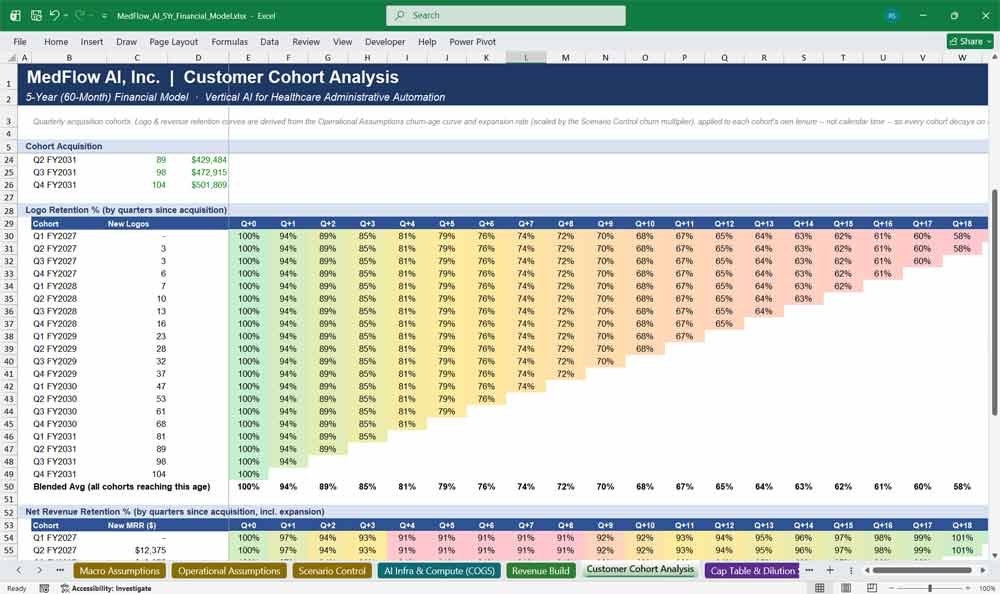
9. Customer Cohort Analysis
A quarterly-cohort retention and NRR analysis — twenty acquisition cohorts tracked on identical, tenure-based logo-retention and net-revenue-retention curves, visualized as color-scaled retention triangles. Essential for any SaaS investor deck that needs to show retention isn’t just an assumption, it’s a modeled curve.
- 20 quarterly acquisition cohorts, each tracked on the same tenure-based decay curve
- Logo retention % triangle and Net Revenue Retention (NRR) % triangle, color-coded for readability
- Blended average retention and NRR rows that feed the KPI Dashboard and Charts tab directly
- Purely tenure-based (not calendar-based) so every cohort behaves consistently
Vertical AI SaaS Cost Structures
10. Cap Table & Dilution Schedule
A complete startup cap table and SAFE dilution model: founders, a pre-seed SAFE (with valuation cap and discount), and priced Seed through Series C rounds, each with its own option-pool top-up — rolling up into a fully-diluted ownership summary and a monthly fully-diluted share count.
- Founders, Pre-Seed SAFE (cap + discount), and priced Seed/A/B/C rounds fully modeled
- Option pool top-ups at every round, automatically diluting existing holders
- Fully-diluted ownership % summary by round, checked to sum to exactly 100%
- Monthly fully-diluted share count that feeds the Valuation tab’s implied $/share
11. Sales Funnel GTM
A full SaaS sales funnel and CAC model: leads → MQLs → SQLs → wins, sales cycle length, rep productivity and ramp time, blended and trailing-12-month CAC, and effective ramped AE capacity — the mechanics behind every new logo in the Revenue Build.
- Full Leads → MQL → SQL → Win funnel with editable conversion rates by fiscal year
- AE ramp-time modeling: effective ramped headcount, not just raw rep count
- New logos calculated as the lesser of funnel-driven demand and rep capacity supply
- Blended and trailing-12-month CAC, tied directly to total sales & marketing spend
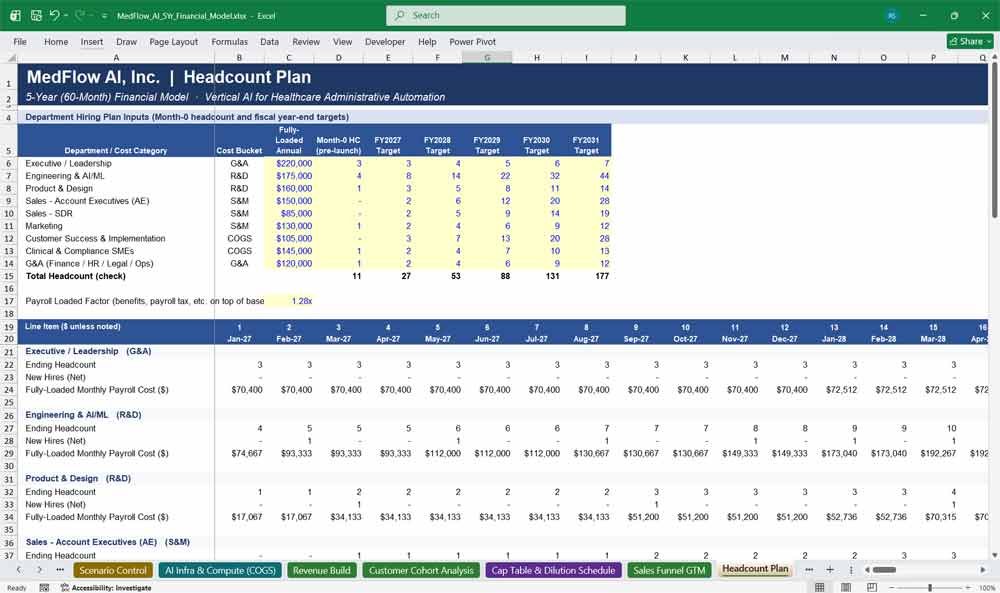
12. Headcount Plan
A department-level startup hiring plan and payroll cost model covering nine functional departments across Engineering, Product, Sales, Marketing, Customer Success, Clinical/Domain Experts, and G&A, with smooth month-by-month interpolation from today’s headcount to each fiscal year’s target.
- Nine departments modeled individually, each with its own starting headcount and 5-year targets
- Smooth monthly interpolation between annual hiring targets (no unrealistic step-jumps)
- Fully-loaded cost per role, rolling up into COGS, S&M, R&D, and G&A category totals
- Feeds both the GTM tab’s rep-capacity model and the Cost Structure tab directly
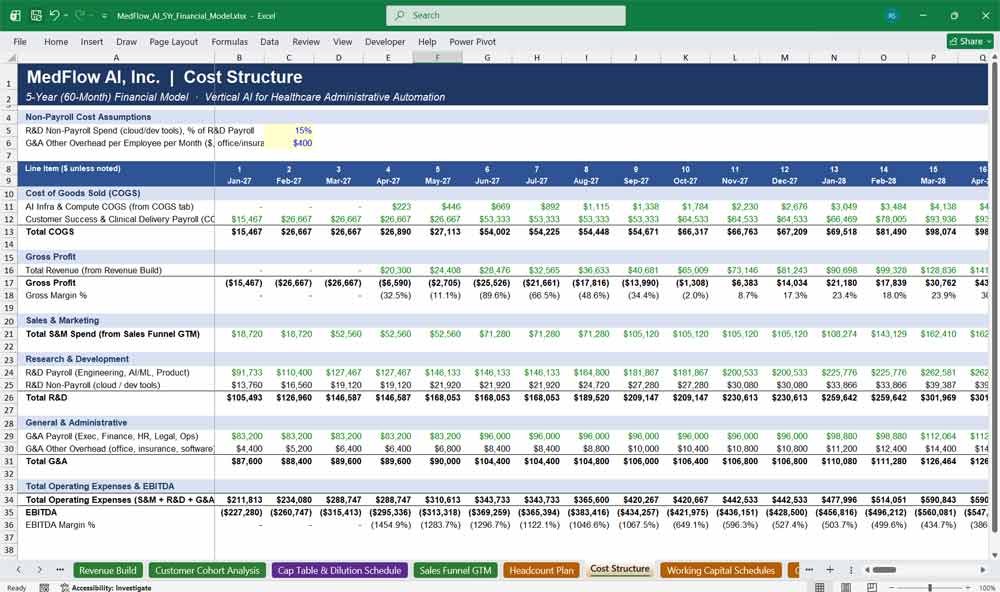
13. Cost Structure
The SaaS cost structure and EBITDA bridge: total COGS, gross profit and gross margin, sales & marketing, R&D, and G&A rolled up from Headcount, GTM, and COGS, down to EBITDA and EBITDA margin — the tab that turns revenue and headcount into a bottom line.
- Full COGS-to-EBITDA bridge, fully linked from Headcount, GTM, and the AI Infra COGS tab
- Gross margin and EBITDA margin calculated live, month by month and by fiscal year
- Clean separation of payroll vs. non-payroll spend within each cost category
- Audit-checked so Opex and EBITDA always foot exactly to their components
14. Working Capital Schedules
A complete working capital and NWC schedule: accounts receivable (DSO-driven), deferred revenue, prepaid expenses, accounts payable (DPO-driven), and accrued liabilities, rolling up into net working capital and its cash-flow-statement impact.
- DSO- and DPO-driven AR and AP schedules, fully editable assumption inputs
- Deferred revenue modeled directly off the MRR balance for SaaS-realistic billing timing
- Prepaid and accrued balances tied to opex and payroll respectively
- Net working capital and ΔNWC feed directly into the cash flow statement and DCF
15. Capex Depreciation Schedule
A capex and depreciation schedule with dynamic, trailing-window straight-line depreciation — equipment capex scaled to new hires, capitalized software development spend, and a full gross PP&E, accumulated depreciation, and net PP&E roll-forward.
- Equipment capex automatically scaled to new headcount each month
- Capitalized software development spend as a % of R&D payroll
- Dynamic trailing-window depreciation that responds automatically to useful-life assumption changes
- Full gross PP&E → accumulated depreciation → net PP&E roll-forward
16. Financing Schedule
A startup financing and venture debt schedule combining equity raises (linked live from the Cap Table) with a modeled venture debt facility — draw, interest-only period, and straight-line repayment — the schedule that determines whether the company ever runs out of cash.
- Equity raises pulled live from the Cap Table’s round-by-round input table
- Modeled venture debt draw with an interest-only period followed by straight-line repayment
- Monthly interest expense calculated off the actual beginning debt balance
- Total financing cash flow feeding directly into the cash flow statement
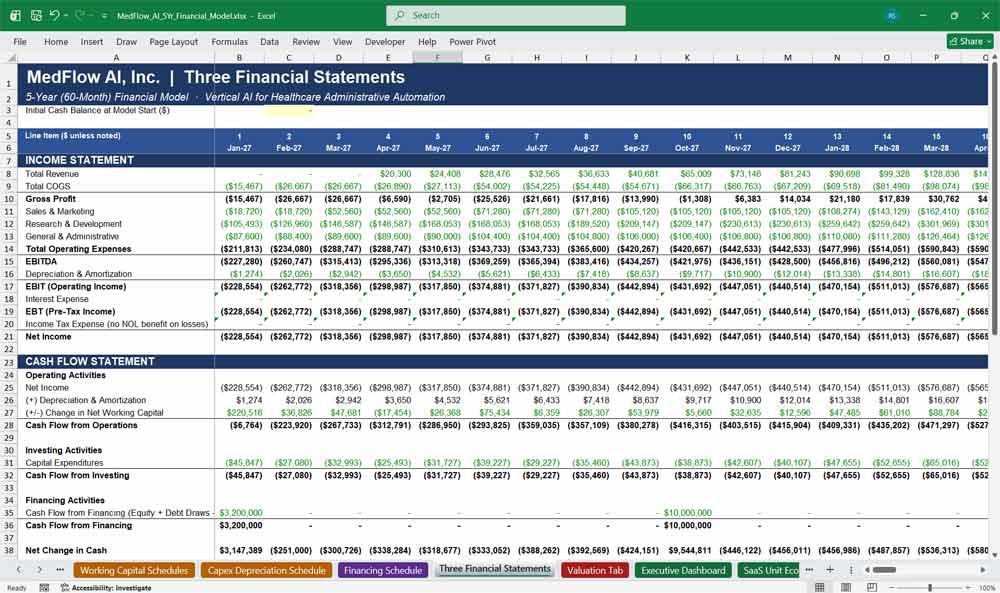
17. Three Financial Statements
A fully-integrated three-statement financial model: monthly and annual Income Statement, Balance Sheet, and Cash Flow Statement, built entirely from the upstream schedules — with a built-in balance check confirming Total Assets equals Total Liabilities plus Equity in every single month.
- Complete Income Statement from Revenue down through Net Income
- Cash Flow Statement (operating, investing, financing) reconciling to the Balance Sheet cash balance
- Full Balance Sheet with a built-in monthly balance-check row (verified to $0 every period)
- The single source every valuation, dashboard, and audit check in the workbook pulls from
AI SaaS Economics & Valuations
18. Valuation Tab
A SaaS valuation and comparable-multiples template that triangulates value across five methods — DCF (Gordon Growth and Exit Multiple), EV/ARR, and EV/Revenue — into a valuation football field, complete with implied enterprise value, implied equity value, and implied price per fully-diluted share.
- Illustrative comparable-multiple ranges (Low / Median / High) for EV/ARR and EV/Revenue
- Valuation football field combining DCF and multiples-based methods in one table
- Implied enterprise value, net cash/debt adjustment, and implied equity value per method
- Implied $/share calculated off the Cap Table’s live fully-diluted share count
19. Executive Dashboard
A one-page board-ready executive dashboard summarizing the entire 5-year plan — headline KPI cards and a full annual summary table — built for the first slide of every board deck and investor update.
- KPI cards for revenue, ARR, headcount, cash, and EBITDA at a glance
- Full 5-year annual summary table pulling from Revenue, Cost, and Financial Statements
- Designed to be screenshotted directly into a board deck or investor update
- Every figure fully linked — refresh the model and the dashboard updates automatically
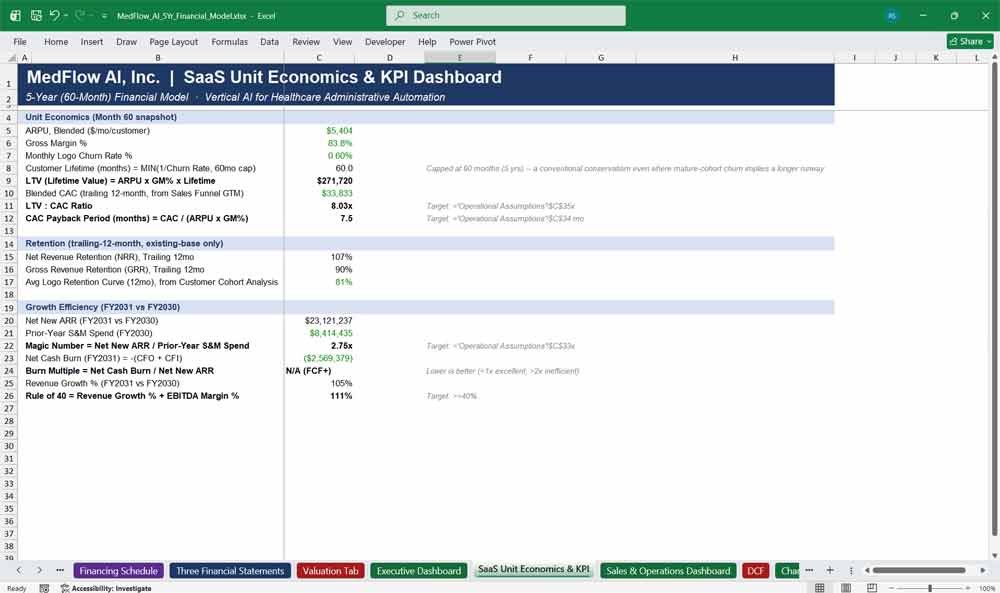
20. SaaS Unit Economics & KPI Dashboard
The SaaS unit economics dashboard every investor asks for: LTV:CAC ratio, Magic Number, Burn Multiple, Net and Gross Revenue Retention, CAC Payback Period, and Rule of 40 — all calculated live from the Revenue Build, GTM, and Cohort Analysis tabs.
- LTV:CAC ratio with lifetime capped at a realistic maximum, avoiding inflated multiples
- Magic Number and CAC Payback Period benchmarked against the Operational Assumptions targets
- Trailing-12-month Net Revenue Retention (NRR) and Gross Revenue Retention (GRR)
- Burn Multiple with a built-in “FCF-positive” guard so the metric never misleads once profitable
21. Sales & Operations Dashboard
A sales ops dashboard tracking funnel conversion rates, pipeline coverage, and rep productivity trends over time — the operating view that sits between the GTM model and the Headcount Plan.
- Full funnel conversion rates (Lead→MQL→SQL→Win) visualized by fiscal year
- Rep productivity trends across the AE and SDR teams
- Headcount-by-department summary table for quick GTM capacity checks
- Built to support weekly or monthly sales-ops review cadences
22. DCF
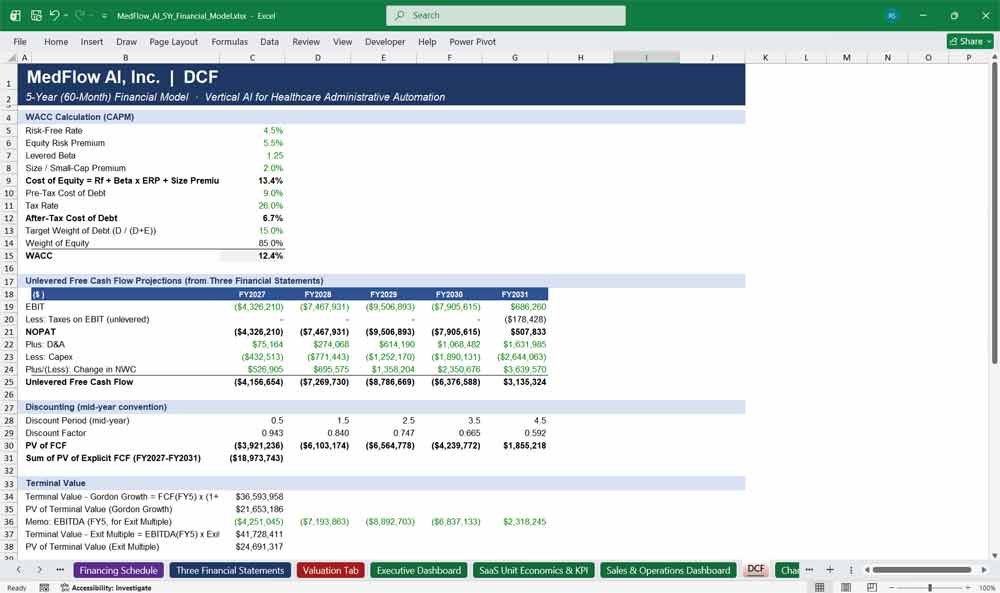
A rigorous DCF valuation template with a full CAPM-based WACC calculation, unlevered free cash flow pulled directly from the three financial statements, dual terminal-value methods (Gordon Growth and Exit Multiple), and two independent two-way sensitivity grids (WACC × Terminal Growth, and Exit Multiple × ARR CAGR).
- Full WACC build via CAPM: risk-free rate, beta, equity risk premium, size premium, after-tax cost of debt
- Unlevered free cash flow computed directly from the Income Statement, Capex, and Working Capital schedules
- Terminal value calculated two ways: Gordon Growth and Exit EV/EBITDA multiple
- Two independent two-way sensitivity tables for stress-testing valuation assumptions
23. Charts & Infographics
Five native, fully-linked Excel charts that turn the model’s numbers into a financial model infographic — ARR growth, revenue mix by fiscal year, cash balance over time, headcount by department, and the blended cohort retention curve — every chart redraws automatically when an assumption changes.
- ARR growth chart tracking monthly recurring revenue scaled to an annual run-rate
- Stacked revenue-mix chart by fiscal year across all four revenue streams
- Cash balance line chart for at-a-glance runway visibility
- Headcount-by-department and cohort-retention-curve charts, both fully data-linked
24. Audit Error Check Page
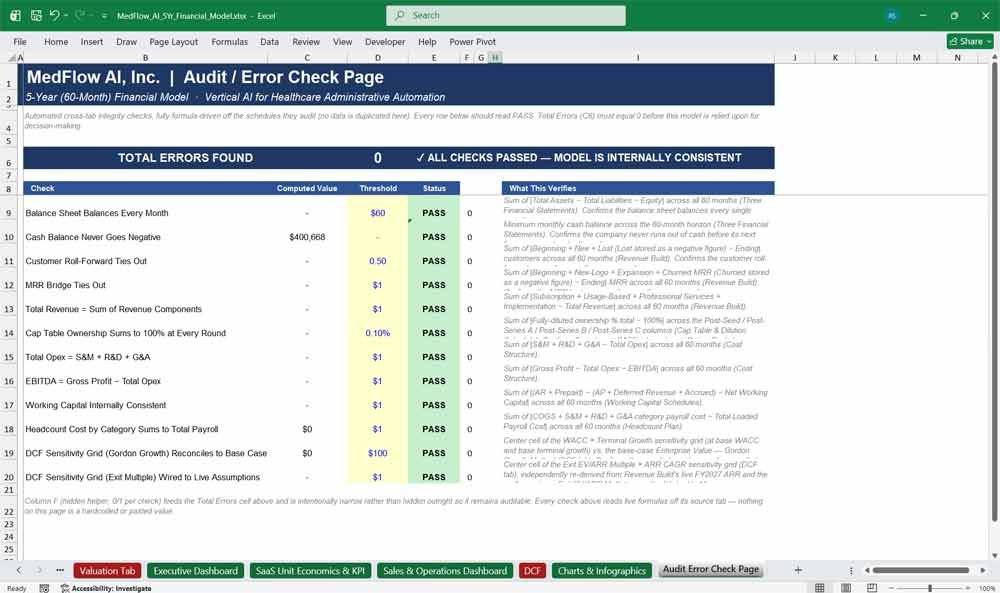
A built-in financial model audit and error-checking page running twelve automated, formula-driven integrity checks — balance sheet balancing, cash never negative, customer and MRR roll-forward tie-outs, cap table ownership summing to 100%, and DCF sensitivity-grid reconciliation — rolling up into a single Total Errors cell that reads zero.
- Twelve live, cross-tab integrity checks with a single “Total Errors” summary cell
- Balance sheet balance check across all 60 months (Assets = Liabilities + Equity)
- Cash-never-negative check confirming the model never implies running out of runway
- Cap table ownership, revenue build, MRR bridge, and DCF sensitivity-grid tie-out checks
Why Buy This Model?
Building a sophisticated AI SaaS financial model in Excel from scratch can take significant time and requires complex formula logic across revenue, AI compute costs, customer cohorts, sales capacity, headcount, working capital, financing, valuation and financial statements. This ready-built Vertical AI SaaS Financial Model gives you that structure in one integrated workbook, so you can focus on your business assumptions rather than building the underlying spreadsheet architecture. With editable inputs, scenario controls, AI-specific COGS modelling, investor-focused SaaS KPIs, valuation analysis, cap table functionality and automated audit checks, it provides a practical starting point for financial forecasting, fundraising, board reporting and five-year business planning.
Vertical AI SaaS Frequently Asked Questions (FAQ)
What exactly do I get when I buy this financial model template?
You get a single, fully-linked Microsoft Excel workbook (.xlsx) with 24 interconnected tabs covering everything from assumptions and revenue build through the three financial statements, DCF valuation, cap table, and board-ready dashboards. There’s no software to install and nothing pulls from an external database — the moment you open the file, all 60 months of projections, every chart, and every KPI dashboard are already built and ready to edit.
Do I need to be a trained financial analyst or know how to build Excel formulas to use this?
No. Every input you’re expected to change is color-coded in blue with a yellow highlight, and the Instructions Read Me tab walks through exactly what each of those cells controls. You never need to write or edit a formula yourself — change an assumption (pricing, churn, headcount, a financing round) in its input cell, and every downstream tab, chart, and dashboard recalculates automatically.
This model is built around a healthcare AI SaaS example — can I actually use it for my own industry?
Yes, that’s the point of the template. The healthcare/MedTech numbers are just the illustrative example filled into the model so every formula and chart has realistic data to display out of the box. Every industry-specific figure — your pricing tiers, your ICP and TAM, your churn curve, your compute/token costs, your headcount plan — lives in an editable input cell, so you can swap in your own vertical’s assumptions without touching a single formula.
Will investors and VCs actually accept this as a real financial model, or is it just a template?
It’s built to the same standard institutional investors expect from a fundraising data room: a fully-integrated three-statement model, a CAPM-based DCF with terminal value calculated two separate ways, a cap table that reconciles ownership to exactly 100% at every round, and a built-in Audit Error Check Page that automatically verifies the balance sheet balances every month. Nothing in the model is hardcoded — every number traces back to a documented, editable assumption, which is exactly what a diligence-minded investor will want to stress-test.
How is the AI infrastructure and compute cost (COGS) actually modeled — is it realistic for an AI-native product?
The AI Infrastructure & Compute schedule models cost the way an AI-native SaaS company actually incurs it: token consumption per query (split into prompt and completion tokens), cost per 1,000 tokens with a built-in annual decline curve for falling model prices, hosting and third-party infrastructure spend, and compute cost scaling with active users. This is the piece a generic, non-AI SaaS financial model template simply doesn’t have.
Does this work in Google Sheets, or only in Microsoft Excel?
The model is built and tested in Microsoft Excel and is delivered as a native .xlsx file, which is the safest format for preserving formulas, formatting, and native charts. It can be uploaded to Google Sheets, but some Excel-specific formulas and the native embedded charts may not convert perfectly — for full fidelity (and to keep every formula and chart working exactly as built), we recommend opening it in Excel or a compatible desktop spreadsheet application.
Can I change the 5-year time horizon, the start date, or extend the model further out?
Yes. The model start date is a single input cell on the Scenario Control tab, and every date header across all 24 tabs recalculates from it automatically — so you can shift the entire 60-month projection to any start month without touching anything else. Extending the horizon beyond 5 years or 60 months requires adding columns following the existing monthly-grid pattern, which the Instructions tab documents in detail.
Does the cap table handle SAFEs and priced equity rounds, or just simple share counts?
Both. The Cap Table & Dilution Schedule models founders’ shares, a pre-seed SAFE with its own valuation cap and discount, and priced Seed through Series C rounds — each with its own option-pool top-up — and rolls all of it up into a fully-diluted ownership summary and a monthly fully-diluted share count, which then feeds the implied price-per-share on the Valuation tab.
How do I know the formulas are actually correct and nothing is hardcoded?
The workbook ships with its own built-in Audit Error Check Page — twelve automated, formula-driven integrity checks covering balance sheet balancing, cash never going negative, customer and MRR roll-forward tie-outs, cap table ownership summing to 100%, and DCF sensitivity-grid reconciliation, all rolling up into a single Total Errors cell. Open the file and that cell reads zero, meaning every cross-tab link in the model already reconciles.