
Textile Financial Model Excel Template
Textile Manufacturer Financial Model Template (Excel) — Planning a spinning, weaving, dyeing, or finishing operation? This fully-integrated textile manufacturer financial model gives founders, CFOs, and investment analysts a ready-to-use Excel template built specifically for the textile and apparel manufacturing industry. With two years of historical monthly financials and a five-year monthly forecast, this financial model template turns raw production assumptions into a bankable, presentation-ready plan — no more rebuilding spreadsheets from scratch every fundraising round or budget cycle.
Financial Model for a Textile Manufacturer
Unlike generic financial model templates, this Excel model is engineered around the real mechanics of textile manufacturing: installed capacity and machine-hour utilization by production line, yarn-to-greige-to-finished-fabric process flow, raw material consumption ratios, and manufacturing overhead. Twenty fully linked tabs carry you from production assumptions through a complete three-statement model — income statement, balance sheet, and cash flow — to a discounted cash flow (DCF) valuation, scenario analysis, and an executive dashboard. Every formula is transparent, editable, and colour-coded, so you can trace any number back to its source assumption in seconds.
Whether you’re raising capital, preparing a business plan, valuing an acquisition target, or simply building a monthly operating budget, this textile industry financial model saves weeks of spreadsheet-building time. It’s built for real-world use: the balance sheet ties out to the penny across all 84 forecast months, the debt schedule and capex roll-forward are fully dynamic, and a built-in scenario switch lets you flip between base, upside, and downside cases instantly. Download it, plug in your own numbers, and have a fully functioning textile manufacturing financial model in minutes, not months.
Why Buy This Textile Model?
Building a textile manufacturing financial model from scratch takes an experienced analyst days, if not weeks — and most templates on the market are generic three-statement shells that ignore the operational realities of a spinning, weaving, dyeing, and finishing business. This model closes that gap. It is purpose-built around production capacity, machine utilization, process yield, and raw material cost structures specific to textile manufacturing, so the numbers you present to lenders, investors, or your own board actually reflect how a mill operates. Every formula flows from a single assumptions tab, every schedule is fully dynamic, and the balance sheet balances automatically across every one of 91 monthly and annual periods — meaning you spend your time refining the story and the strategy, not debugging broken links and circular references. Buy once, customize endlessly: swap in your own capacity, pricing, and cost assumptions and the entire model — statements, valuation, dashboard, and all — recalculates instantly.
Tab-By-Tab Guide
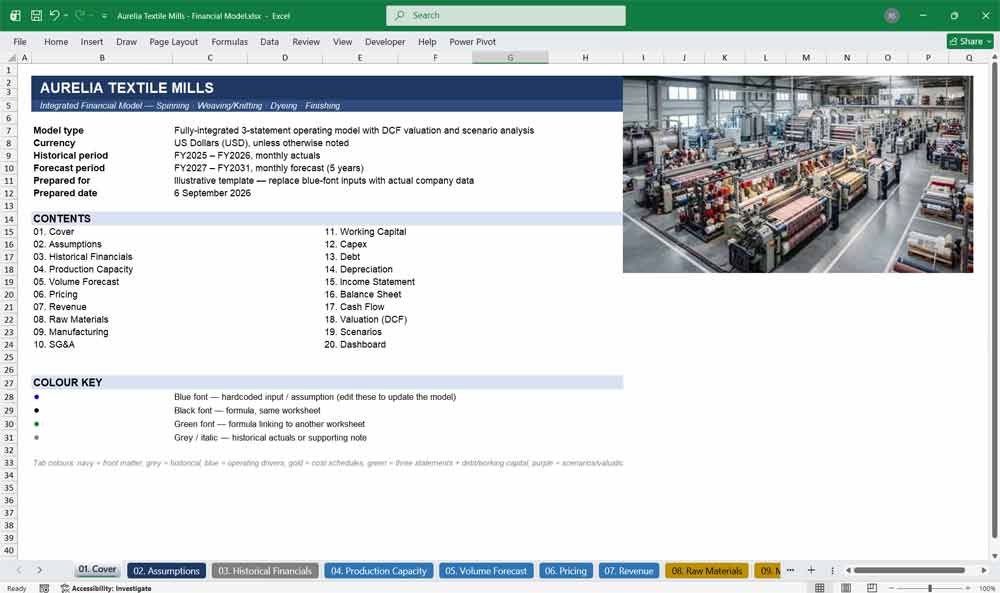
01. Cover
This cover tab introduces the textile manufacturing financial model with company details, model scope, and a colour-coded navigation key. It’s the professional first impression for investors, lenders, and partners reviewing your financial model template — clean, branded, and instantly orientating for any reader.
- Full 20-tab table of contents with clickable structure
- Colour-key legend explaining input, formula, and link conventions
- Editable company name, model scope, and date fields
- Sets a professional, investor-ready tone from page one
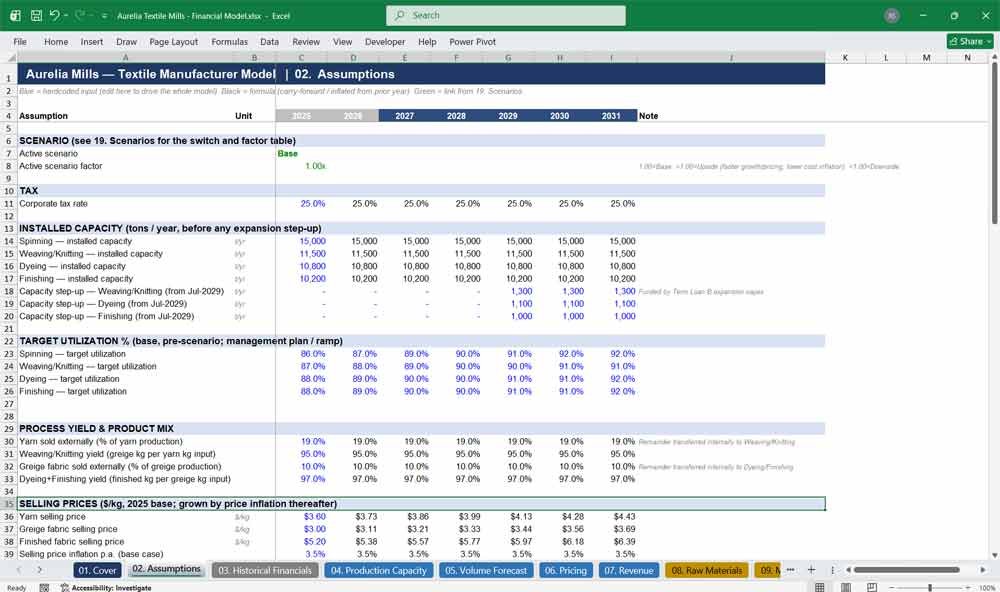
02. Assumptions
The assumptions tab is the engine room of this Excel financial model — every growth rate, price, cost ratio, and financing term lives here. Change one blue input cell and the entire textile manufacturing model, from production volumes to valuation, recalculates automatically across all 91 periods.
- 100+ editable, colour-coded input assumptions in one place
- Covers pricing, raw materials, labor, utilities, working capital, and debt
- Built-in scenario factor and monthly seasonality index
- Single source of truth — no hidden hardcoded numbers anywhere
Textile Manufacturer Financials & Forecasts
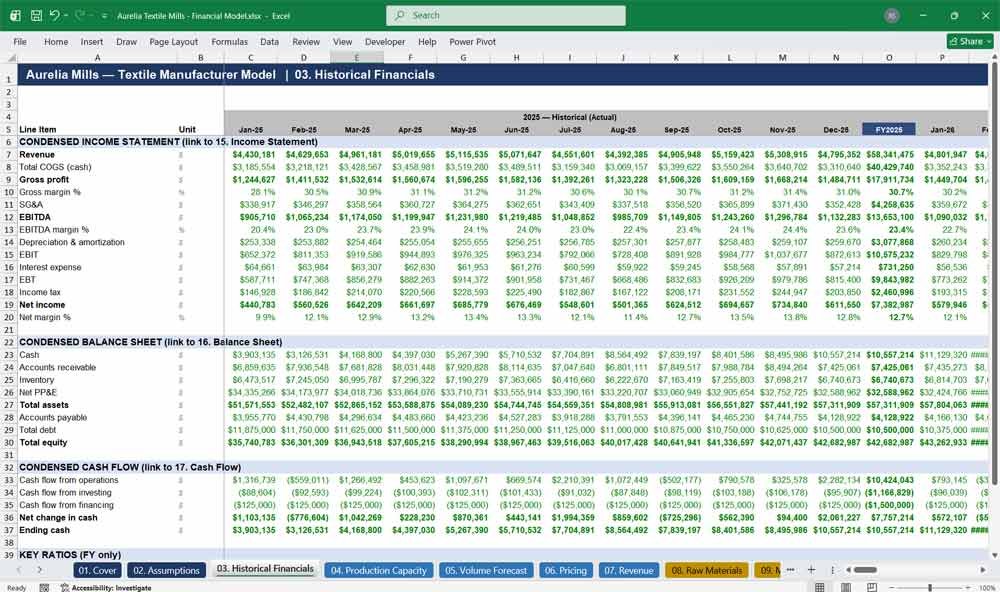
03. Historical Financials
Track two full years of monthly historical actuals — income statement, balance sheet, and cash flow — condensed into one clear view. This historical financials tab benchmarks past performance against your forecast, giving lenders and investors the trend context every credible financial model needs.
- Two years of monthly historical P&L, balance sheet, and cash flow
- Automatically linked to the core financial statements (no re-entry)
- Includes revenue growth, current ratio, and debt/EBITDA KPIs
- Instant historical-vs-forecast credibility for due diligence
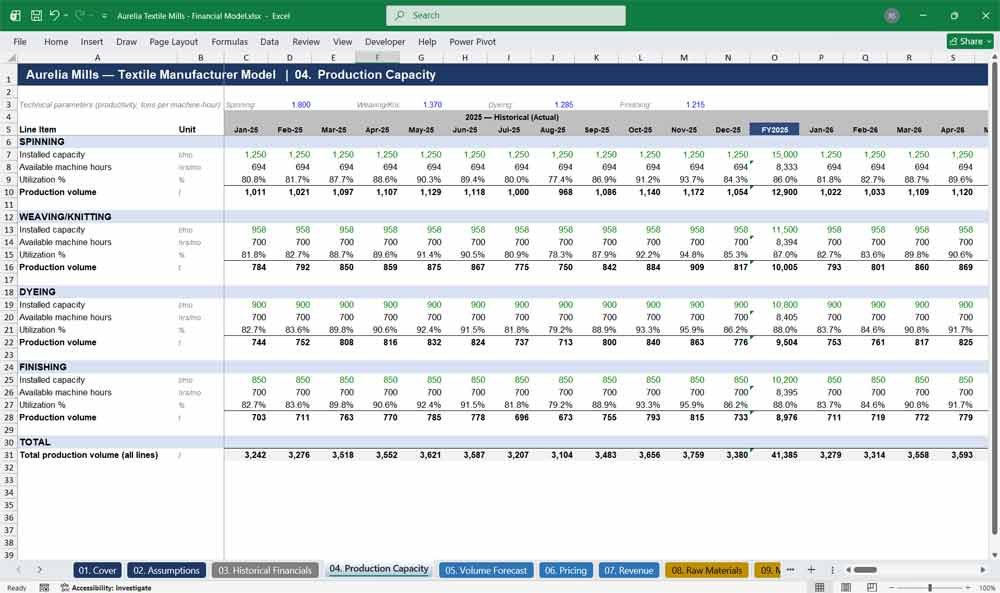
04. Production Capacity
Model installed capacity, available machine hours, and utilization percentage by production line — spinning, weaving/knitting, dyeing, and finishing. This production capacity planning tab drives every downstream volume and revenue figure in the textile manufacturing financial model with full monthly granularity.
- Capacity, machine hours, utilization %, and output by process line
- Supports capacity expansion step-ups funded by new debt
- Monthly seasonality built into utilization forecasting
- Total production volume roll-up across all four process lines
05. Volume Forecast
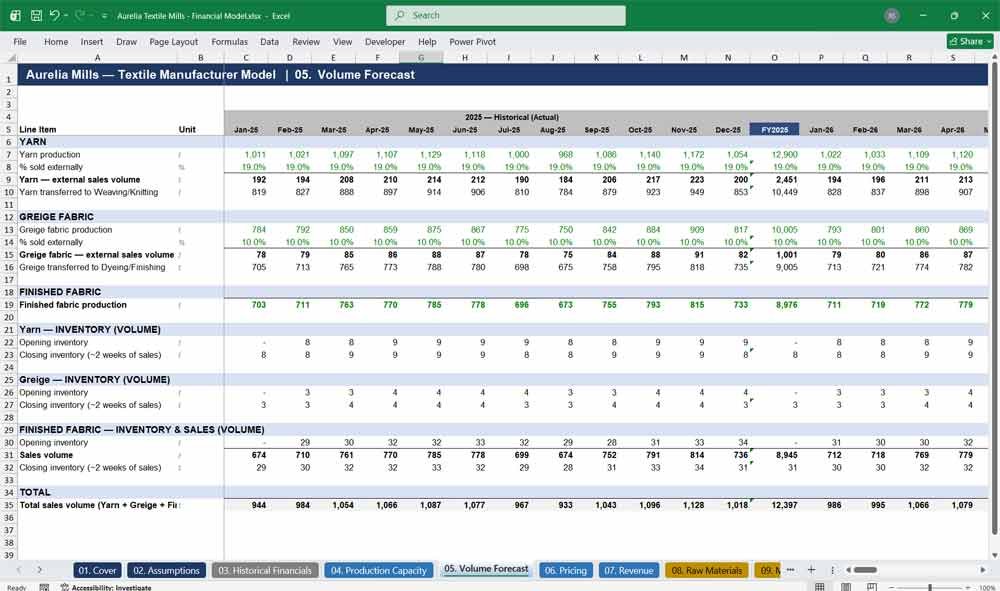
This volume forecast tab maps the real textile production flow — yarn, greige fabric, and finished fabric — including internal transfers, external sales splits, and inventory movements. It’s the physical-volume backbone connecting production capacity to pricing and revenue in this financial model.
- Full process-flow logic: yarn → greige fabric → finished fabric
- External sales vs. internal transfer splits by product stage
- Monthly opening/closing inventory volume roll-forward
- Total sales volume feeding directly into the revenue tab
06. Pricing
A dedicated pricing tab tracks $/kg selling prices for yarn, greige fabric, and finished fabric, inflated year over year and adjustable by scenario. This keeps pricing assumptions transparent and separate from volume, a best-practice structure in any manufacturing financial model template.
- Separate $/kg pricing by product line for full transparency
- Automatic annual price inflation, scenario-adjustable
- Fully linked into the revenue calculation tab
- Easy to override with your own real-world pricing data
Textile Manufacturing Revenues & Cash Flow
07. Revenue
The revenue tab multiplies sales volume by price for every product line, rolling up to total revenue with a live revenue mix breakdown. This is where your textile manufacturing model turns operational assumptions into the top line investors and lenders scrutinize first.
- Revenue by product line: yarn, greige fabric, finished fabric
- Live revenue mix % by product for portfolio analysis
- Monthly and annual (FY) revenue views side by side
- Fully formula-driven — zero hardcoded revenue figures
08. Raw Materials
This raw materials tab calculates cotton and polyester consumption, dyes and chemicals, and packaging costs using editable consumption ratios and waste percentages. Essential for any textile or apparel manufacturing financial model where fiber cost volatility drives margin more than almost any other line.
- Cotton/polyester consumption modeled via fiber-blend and waste ratios
- Dyes, chemicals, and packaging costs by production stage
- Editable $/kg commodity pricing with inflation built in
- Total raw material cost feeds directly into COGS
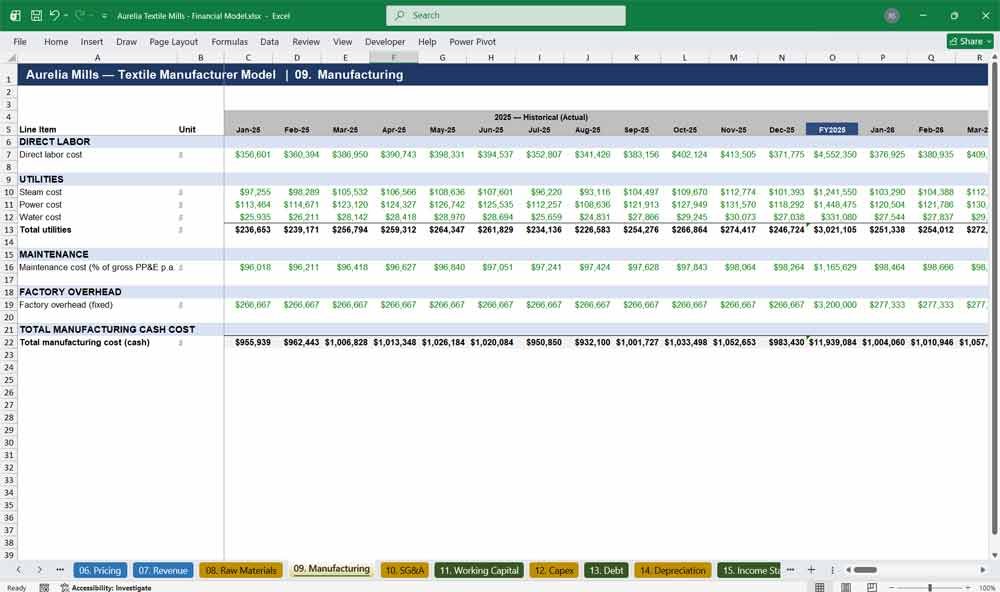
09. Manufacturing
Labor, steam, power, water, maintenance, and factory overhead are all modeled here on a per-kg-produced basis. This manufacturing cost tab gives operators and investors a clear view of conversion cost economics — critical for benchmarking mill efficiency in any textile financial model.
- Labor and utility costs modeled per kilogram produced
- Maintenance cost dynamically linked to gross PP&E balance
- Fixed factory overhead with annual inflation
- Total manufacturing cost rolls straight into cost of goods sold
10. SG&A
Selling, marketing, and administrative costs are modeled as a clean mix of revenue-linked and fixed expenses. This SG&A tab keeps overhead assumptions simple, auditable, and easy to benchmark against industry norms for any textile or manufacturing business plan.
- Selling and marketing expense modeled as % of revenue
- Fixed admin & G&A costs with annual inflation
- Fully separated from manufacturing cost for clean margin analysis
- Feeds directly into EBITDA on the income statement
11. Working Capital
Accounts receivable, inventory, and accounts payable are driven by editable DSO, DIO, and DPO day assumptions. This working capital tab automatically calculates the cash impact of growth — a feature many financial model templates skip entirely, but every serious lender or investor will ask about.
- Days-based AR, inventory, and AP calculations (DSO/DIO/DPO)
- Separate raw material and finished goods inventory tracking
- Automatic month-over-month change in net working capital
- Directly powers the cash flow statement
12. Capex
Track maintenance capex and large expansion projects — like new weaving or dyeing lines — in one place. This capex tab feeds the depreciation schedule and cash flow statement automatically, making capacity-expansion scenarios easy to model and present to financing partners.
- Maintenance capex modeled as % of revenue
- Discrete expansion capex projects by production line and year
- Fully linked to the depreciation and cash flow tabs
- Supports modeling growth-stage manufacturing investment plans
13. Debt
Model existing and new term loans with automatic drawdown, straight-line amortization, and interest calculated on rolling balances. This debt schedule tab is built for lenders and investors who want to see exactly how expansion capex is financed and repaid over time.
- Two independently amortizing term loan schedules
- Automatic new-loan drawdown tied to expansion capex timing
- Interest calculated on average monthly balances (no circular errors)
- Current vs. long-term debt split feeds the balance sheet
14. Depreciation
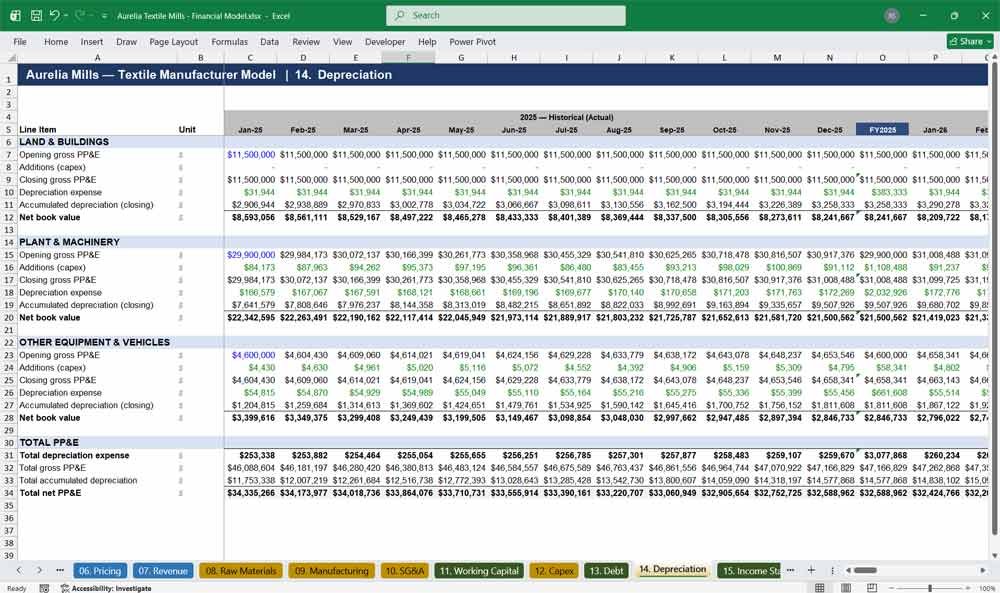
A full fixed-asset roll-forward by asset class — land & buildings, plant & machinery, other equipment — calculates monthly depreciation and net book value. This depreciation schedule tab keeps your textile manufacturing financial model’s balance sheet and income statement fully synchronized.
- Roll-forward by three distinct asset classes with useful lives
- Monthly gross PP&E, accumulated depreciation, and net book value
- Automatically incorporates new capex additions each period
- Total depreciation expense flows straight into the income statement
15. Income Statement
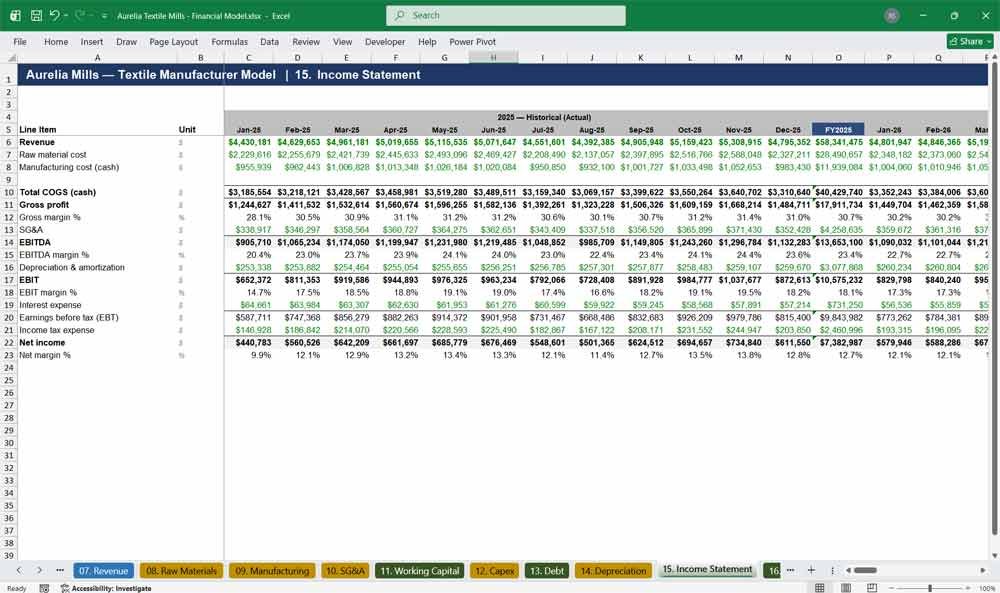
A complete monthly and annual income statement — revenue through net income — fully linked to every operating schedule in the model. This income statement tab is the financial centerpiece any textile manufacturing financial model template needs to satisfy lenders, investors, and boards.
- Revenue, COGS, gross profit, EBITDA, EBIT, and net income
- Margin percentages calculated automatically at every level
- 84 months plus 7 annual (FY) columns, fully formula-driven
- Zero hardcoded figures — everything traces to assumptions
16. Balance Sheet
A fully dynamic balance sheet that ties out automatically — assets equal liabilities plus equity — across every single monthly and annual period. This balance sheet tab is stress-tested and error-checked, giving buyers of this financial model template real confidence in the numbers.
- Automatic balance check across all 91 periods (verified to $0)
- Full current and long-term asset/liability classification
- Retained earnings roll-forward tied directly to net income
- Built for lender and investor scrutiny
17. Cash Flow
An indirect-method cash flow statement covering operating, investing, and financing activities, fully reconciled to the balance sheet’s cash balance every month. This cash flow tab shows exactly how working capital, capex, and debt financing decisions affect liquidity in your textile manufacturing model.
- Operating, investing, and financing cash flow fully itemized
- Automatic working capital change calculation from the balance sheet
- Beginning and ending cash roll-forward, month over month
- Reconciles perfectly to the balance sheet cash line
Key Financial Metrics for a Textile Manufacturer
18. Valuation (DCF)
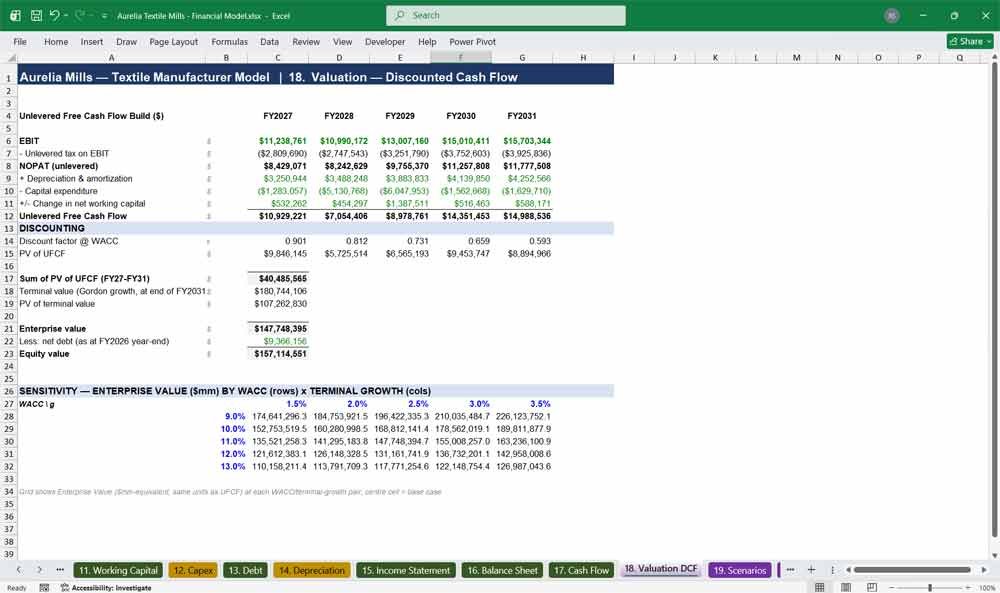
A discounted cash flow valuation built on unlevered free cash flow, with a live WACC and terminal growth sensitivity grid. This DCF valuation tab turns your textile manufacturing financial model into a real valuation tool for M&A, fundraising, or exit planning.
- Unlevered free cash flow build from EBIT through to FCF
- Enterprise value and equity value bridge with net debt
- 5×5 WACC / terminal growth sensitivity table
- Ideal for fundraising, M&A, and exit-planning conversations
19. Scenarios
A one-click Base / Upside / Downside scenario switch instantly recalculates growth, pricing, and cost inflation across the entire model. This scenario analysis tab lets you stress-test your textile manufacturing plan and present a range of outcomes, not just a single forecast.
- One-cell dropdown scenario switch (Base / Upside / Downside)
- Instantly recalculates revenue, EBITDA, and net income by year
- Transparent factor table so the logic is never a black box
- Ideal for board decks and investor sensitivity discussions
20. Dashboard
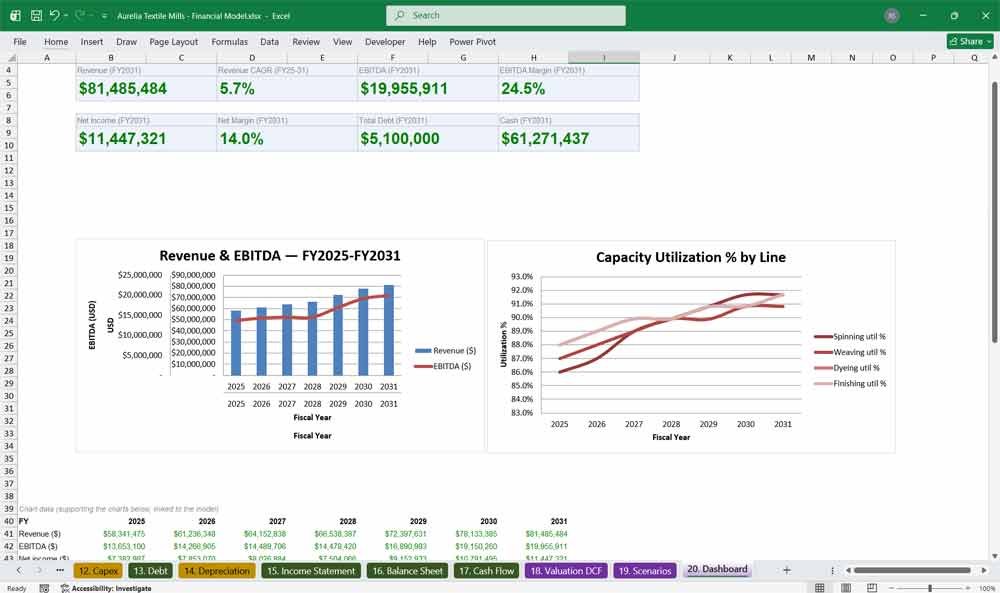
A visual, chart-driven dashboard summarizing revenue, EBITDA, margins, debt, and capacity utilization trends at a glance. This executive dashboard tab turns 20 tabs of detailed modeling into a single page any stakeholder can understand in under a minute.
- KPI tiles for revenue, EBITDA, net income, debt, and cash
- Revenue & EBITDA trend chart across the full 7-year horizon
- Capacity utilization trend chart by production line
- Debt vs. cash trend chart for balance-sheet-health storytelling
Textile Manufacturer Model Faq
Is this model fully editable, or are the formulas locked?
Every cell is fully unlocked and editable. All input assumptions are colour-coded blue so you always know exactly what to change, and every formula is visible and traceable — nothing is hidden, password-protected, or hardcoded behind the scenes.
Do I need advanced Excel or financial modeling experience to use this?
No. The model is built with a clear colour-coding system (blue = input, black = formula, green = cross-tab link) and a tab-by-tab structure that flows logically from assumptions to output, so anyone comfortable with basic spreadsheets can update it confidently.
Will this work with my own company’s numbers, or is it locked to the example data?
The example figures are fully illustrative and meant to be replaced. Update the Assumptions tab with your own capacity, pricing, cost, and financing data, and every one of the 20 tabs — including the statements, valuation, and dashboard — recalculates automatically.
Does the model include a valuation, or just financial statements?
Both. In addition to a full three-statement model (income statement, balance sheet, cash flow), it includes a discounted cash flow valuation tab with enterprise value, equity value, and a WACC/terminal-growth sensitivity table — ready for fundraising or M&A conversations.
Can I use this for a business plan or investor pitch?
Yes — it was built specifically for that use case. The monthly and annual layout, scenario switch, and executive dashboard are designed to support fundraising decks, lender packages, board presentations, and business plan submissions.
Does it cover the full textile production process, or just generic manufacturing?
It’s built specifically around textile manufacturing: spinning, weaving/knitting, dyeing, and finishing, with the yarn-to-greige-to-finished-fabric process flow, fiber consumption ratios, and conversion cost structure unique to the industry — not a generic manufacturing template with labels swapped.
What Excel version or software do I need to open this?
The file is a standard .xlsx workbook compatible with Excel 2016 and later, Excel 365, and most spreadsheet software. It can also be opened in Google Sheets, though native charts may need minor reformatting after import.
Can I extend the forecast beyond five years, or change the historical period?
Yes. Because every schedule uses consistent formula logic across periods, you can extend the timeline by copying the existing monthly formulas into additional columns, or adjust the historical/forecast split to match your own reporting calendar.
Does the balance sheet actually balance, or will I need to fix circular references?
The balance sheet is fully tested and balances to zero across all 91 monthly and annual periods. The debt and interest schedules are built to avoid circular references entirely, so there’s no need for iterative calculation settings.
What if I only need part of the model, like just the three statements or just the valuation?
The model is fully modular — you can delete or hide any tabs you don’t need (for example, the DCF or dashboard) without breaking the tabs you keep, since every schedule references upstream tabs directly rather than depending on the whole file.
Key Takeaways for the Financial Model
This Textile Manufacturer financial model provides a comprehensive framework for analyzing the financial performance of the manufacturing process. This template is built using Excel and should be updated regularly to reflect actual performance and changing market conditions.