
Steel Plant Financial Model Template
This Steel Plant Financial Model is a fully-built, formula-driven Excel template for anyone evaluating, financing, or presenting a greenfield BF-BOF steel plant — from construction through twenty years of operations and terminal value. Built for project finance teams, investment analysts, corporate development groups, and engineering-to-business consultants, the steel plant financial model covers the complete project lifecycle in one linked workbook: three years of monthly construction, a twelve-month commissioning and ramp-up phase, five years of monthly operations with annual roundups, fifteen years of annual operations, and a terminal value period. Every number flows from a single set of assumptions, so the entire model recalculates automatically the moment you change an input.
Financial Model for a Steel Plant
Unlike static steel industry Excel templates that hardcode dates and figures, this financial model uses a dynamic date engine: change the construction start date once, on the Assumptions tab, and every calendar year, monthly period, and annual label across all eighteen tabs updates instantly — no manual re-dating, no broken links, no year-one placeholders. The workbook models a full nine-product mix (HRC, rebar, billet, plates, beams, sheets, tubes, wire, and byproduct scrap sales), each with its own price, market mix, and volume, alongside raw material costs (iron ore, coking coal, scrap, alloys, limestone), operating costs, a ten-category construction capex breakdown, working capital, a fully integrated three-statement model (P&L, cash flow, balance sheet), a construction-to-amortization debt schedule, fixed assets and depreciation, and a complete valuation suite.
Whether you’re preparing a feasibility study, raising project debt or equity, running a board presentation, or teaching corporate finance, this steel plant financial model gives you a bank-grade DCF valuation, IRR and NPV analysis, MOIC, payback period, and three built-in sensitivity tables (WACC × terminal growth, steel price × utilization, capex × opex) — all built on live formulas you can audit, adjust, and extend. Every input cell is clearly marked, every tab is color-coded, and every figure is traceable back to its source assumption, making this one of the most transparent, granular, and fully editable steel industry financial models available.
Why Buy This Model
Building an integrated steel plant financial model from scratch — one that correctly links construction phasing across ten distinct capex categories, a nine-product revenue mix, ramp-up production, escalating raw material costs, debt amortization, depreciation, working capital, and a defensible DCF valuation — typically takes an experienced financial modeler several weeks. This template gives you that same institutional-grade structure in minutes, with every formula fully unlocked and editable, no macros or hidden logic, and a dynamic date engine and product/capex granularity that most steel and mining models on the market simply don’t have. You’re not buying a static spreadsheet of numbers; you’re buying a working financial engine you can drop your own capacity, product mix, pricing, and capex assumptions into and trust the outputs — whether that output is a lender information memorandum, an investment committee paper, an academic case study, or your own internal go/no-go decision.
Tab-by-Tab Breakdown
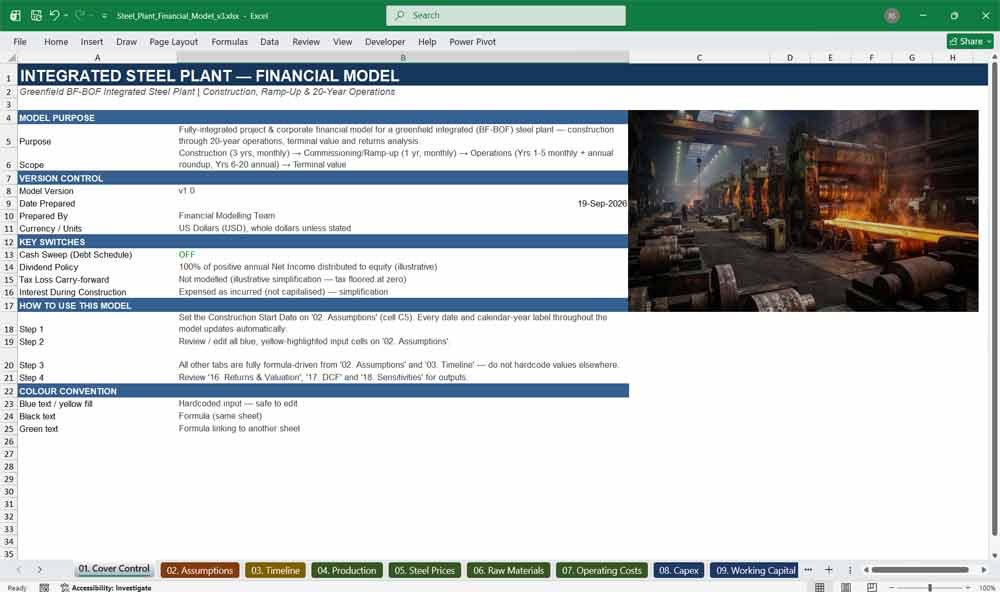
01. Cover Control
A steel plant financial model cover page built for investor and lender review — model purpose, version control, currency, units, and key switches in one place. Gives reviewers instant context before they open a single formula, which matters for feasibility studies, due diligence packs, and project finance presentations.
- One-click orientation: purpose, scope, and phase structure summarized up front
- Documents currency (USD), units, and model version for audit trail
- Explains the colour convention (input vs. formula vs. cross-sheet link) used throughout
- Lists key switches (e.g., cash sweep on/off) so reviewers know what’s toggled
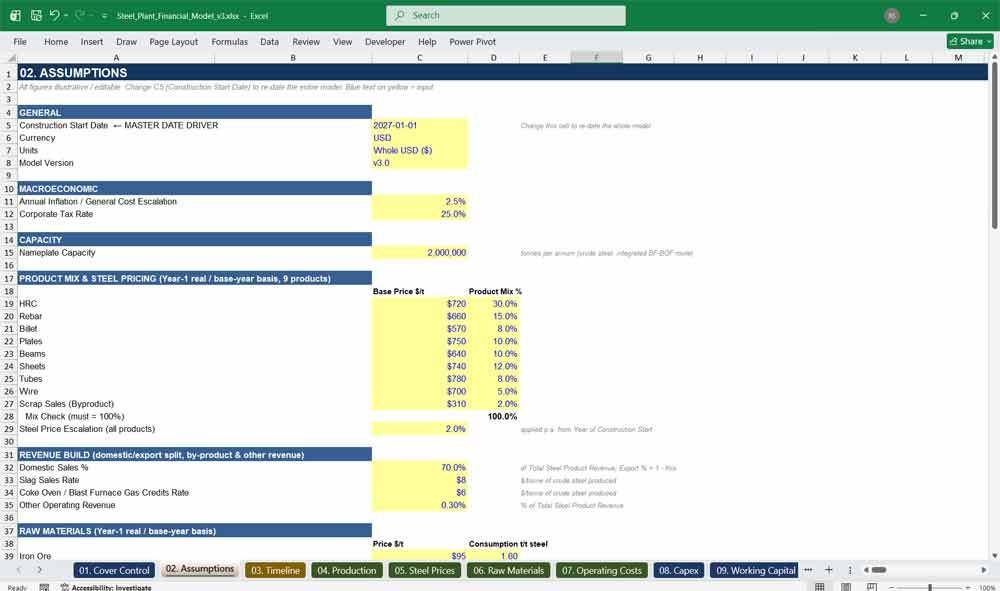
02. Assumptions
The control panel of the entire steel plant financial model — every macro, product price and mix, raw material, capex-category, financing, and valuation input lives here, including the single Construction Start Date cell that re-dates the whole workbook. Change one number and production, pricing, and financing all update automatically.
- Single master Start Date drives every date across all 18 tabs
- Nine-product pricing and mix table (HRC, rebar, billet, plates, beams, sheets, tubes, wire, scrap sales) with a live mix-check
- Ten-category construction capex input block, from blast furnace to HPC infrastructure
- Inflation, tax, WACC, and terminal growth rate inputs in one block
Steel Plant Operating Costs
03. Timeline
The formula-driven date engine behind the model’s horizontal timeline — converts one start date into 129 correctly-sequenced periods spanning construction, commissioning, monthly and annual operations, and terminal value, all labelled with real calendar years instead of generic “Year 1” placeholders.
- Fully dynamic EDATE-based calendar — no hardcoded dates anywhere
- Real calendar-year labels (2027, 2028…) throughout, not “Year 1 / Year 2”
- Phase, period type, and operating-year tagging for every column
- Built-in phase duration summary for quick QA of the model structure
04. Production
Capacity, utilization, and product-mix planning for the steel plant, translating nameplate capacity and a ramp-up curve into monthly and annual crude steel volumes across all nine products. Essential for any steel production financial model where output mix — not just price — drives the investment case.
- Nameplate capacity linked directly to Assumptions for one-click sensitivity testing
- Editable ramp-up curve during commissioning and annual utilization thereafter
- Automatic mix split into HRC, rebar, billet, plates, beams, sheets, tubes, wire, and scrap sales volumes
- Days-in-period tracking supports accurate monthly-to-annual reconciliation
05. Steel Prices
Product-level steel pricing with compounding annual escalation across all nine products, plus a blended realized price weighted by production mix — the pricing engine that feeds Revenue, Working Capital, and the DCF valuation throughout the steel plant financial model.
- Independent base prices and escalation for HRC, rebar, billet, plates, beams, sheets, tubes, wire, and scrap sales
- Escalation compounds automatically from the construction start date
- Blended realized price recalculates instantly if any product’s mix or price changes
- Fully linked forward into Revenue and Working Capital tabs
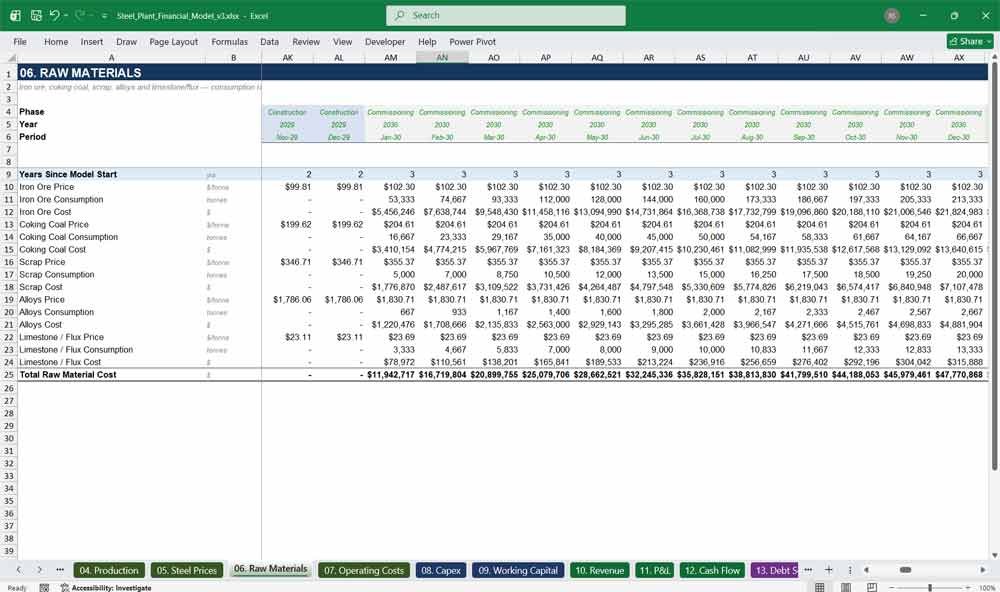
06. Raw Materials
A complete raw material cost build for an integrated BF-BOF steel plant — iron ore, coking coal, scrap, alloys, and limestone — each with its own consumption rate, escalating price, and total cost, giving lenders and investors full visibility into input cost risk.
- Five major raw materials modeled individually, not lumped together
- Consumption rates (tonnes per tonne of steel) fully editable per material
- Independent price escalation assumption separate from general inflation
- Total raw material cost flows straight into P&L and the DCF tab
07. Operating Costs
Energy, labour, maintenance, consumables, logistics, and fixed overheads modeled as a true operating cost base for the steel plant, each escalating with inflation and scaling correctly with production volume — critical for realistic EBITDA margins in any steel industry financial model.
- Six distinct cost categories, each independently editable
- Labour modeled by headcount and salary, not a single lump sum
- Maintenance costs tied to total construction capex, not just revenue
- All costs escalate with inflation and prorate correctly across monthly and annual periods
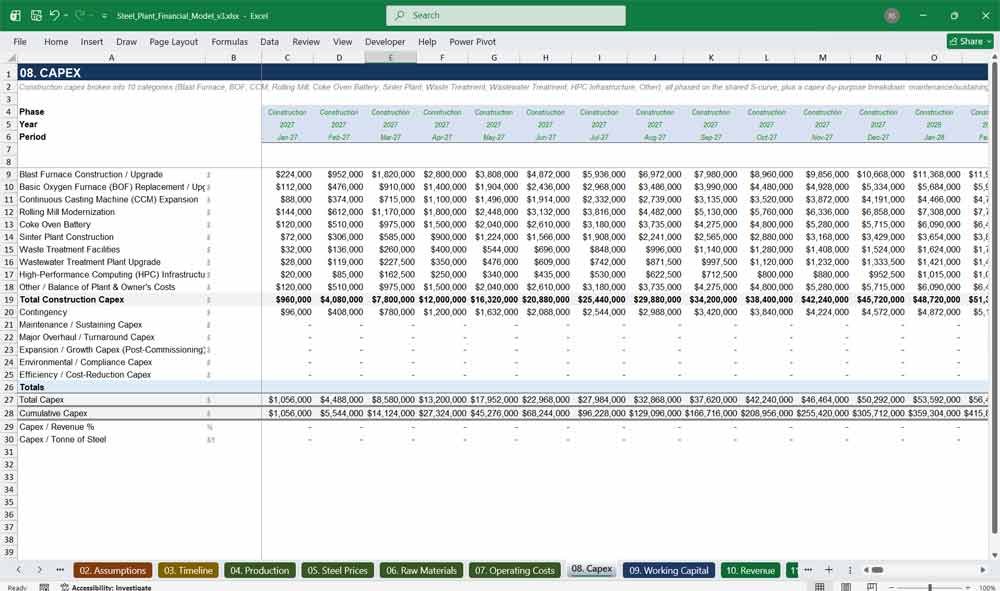
08. Capex
Construction capex broken into ten distinct, real-world categories — blast furnace, BOF, continuous casting, rolling mill, coke oven battery, sinter plant, waste and wastewater treatment, HPC infrastructure, and other balance-of-plant costs — each phased on an S-curve across 36 months, plus contingency, sustaining capex, and periodic major replacement spend.
- Ten editable capex line items matching how EPC contractors and lenders actually scope a steel plant build
- Shared, editable phasing curve applied consistently across all ten categories
- Automatic contingency calculation on top of the ten-category construction total
- Sustaining and replacement capex tied to revenue and asset life, cumulative capex tracked automatically
Steel Plant Financial Statements
09. Working Capital
Receivables, inventory, and payables driven by days-outstanding assumptions, converting revenue and cost timing into a realistic net working capital position and cash impact — a step most simplified steel plant models skip, but which materially affects cash flow and returns.
- Separate day-count assumptions for receivables, inventory, and payables
- Automatically reconciles between monthly detail and annual roundup periods
- Change in NWC flows directly into Cash Flow and the DCF
- Fully formula-driven — no manual working capital overrides required
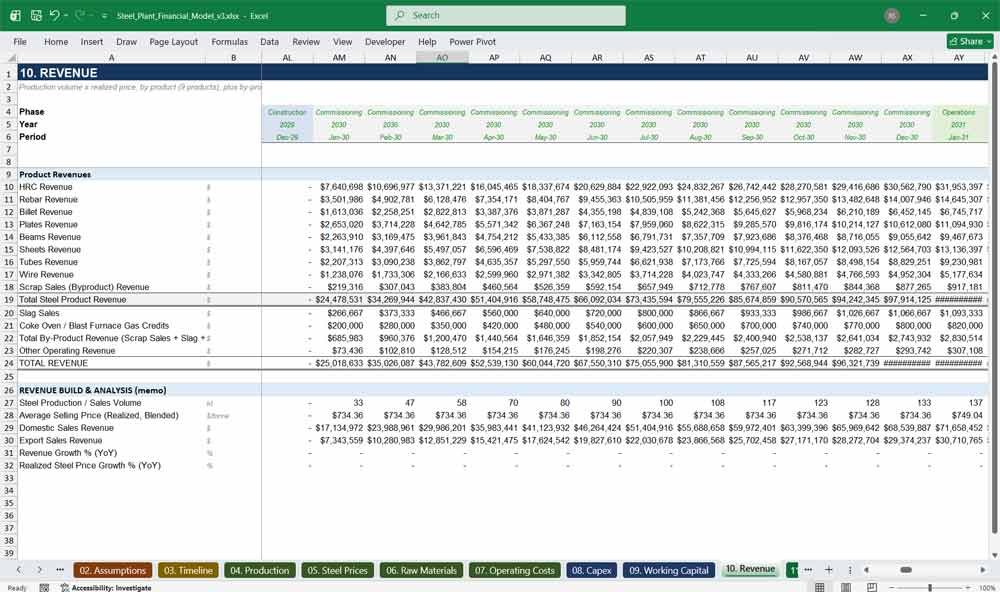
10. Revenue
Production volume multiplied by realized price, by product, rolled up into total steel plant revenue across all nine product lines — the top line that anchors every downstream statement in the model, from EBITDA through to Enterprise Value.
- Revenue built bottom-up by product (HRC, rebar, billet, plates, beams, sheets, tubes, wire, scrap sales), not as a single blended figure
- Automatically reflects ramp-up, utilization, mix, and pricing assumption changes
- Fully reconciled between monthly detail and annual summary periods
- Single source of truth referenced by nine other tabs
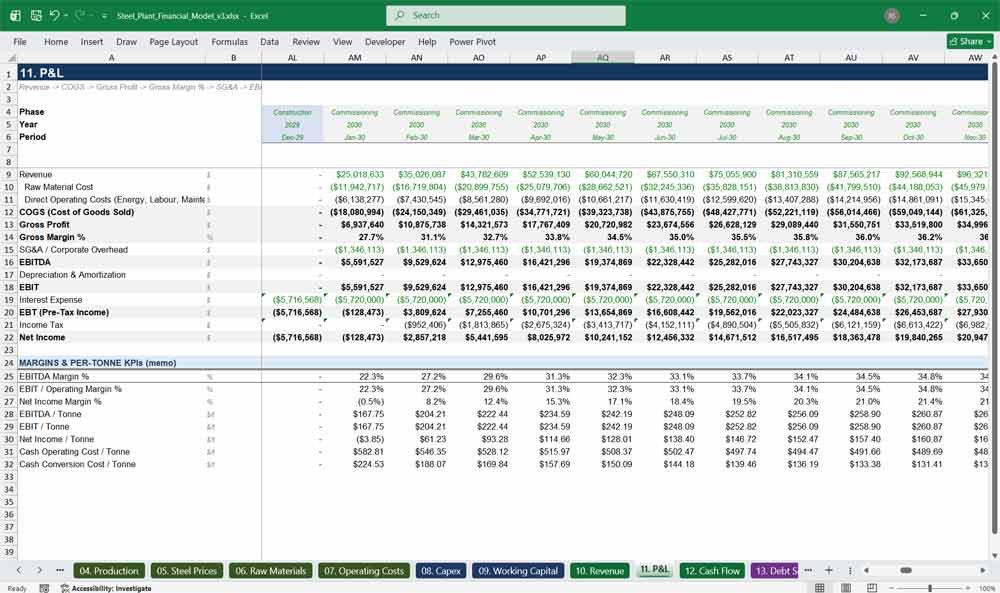
11. Income Statement (P&L)
A complete income statement for the steel plant — Revenue through EBITDA, EBIT, EBT, and Net Income — fully integrated with production, pricing, cost, depreciation, and interest assumptions elsewhere in the model, giving a realistic, audit-ready profitability build.
- Clean EBITDA-to-Net-Income bridge with every line independently traceable
- Automatically reflects raw material, opex, D&A, and interest assumptions
- Tax computed on positive EBT only, with no manual overrides needed
- Feeds directly into Cash Flow, Balance Sheet, and Returns tabs
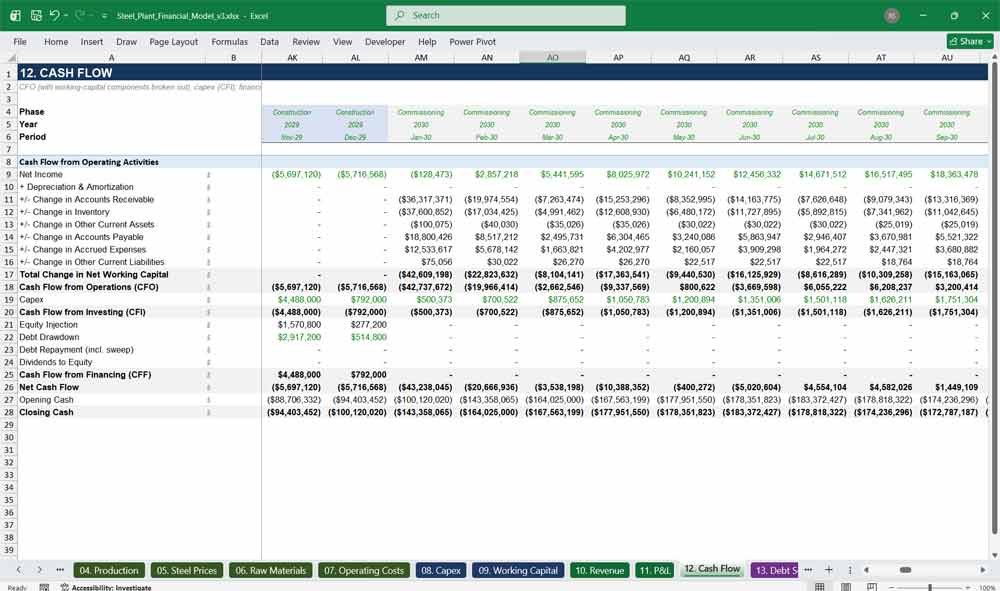
12. Cash Flow
Operating, investing, and financing cash flow fully reconciled into a rolling cash balance — including equity injections, debt drawdowns, repayments, and a dividend policy — making this one of the few steel plant financial models with a genuinely integrated cash engine.
- CFO, CFI, and CFF built from first principles, not shortcuts
- Debt drawdowns and equity injections automatically match capex phasing
- Dividend policy pays out positive annual net income to equity
- Opening and closing cash roll forward correctly across 129 periods
13. Debt Schedule
Construction-period debt drawdown, interest accrual, and straight-line amortization from commercial operations date, complete with a DSCR calculation — the debt mechanics investors and lenders expect to see in any credible steel plant project finance model.
- Debt drawn automatically in line with construction capex phasing
- Interest accrues monthly during construction and annually thereafter
- Straight-line amortization from COD over an editable tenor
- Built-in DSCR (CFADS ÷ debt service) for lender-style covenant testing
14. Fixed Assets D&A
A full gross PP&E roll-forward with straight-line depreciation from commercial operations date, tracking additions, accumulated depreciation, and net book value — giving the balance sheet and DCF valuation a defensible, fully-linked fixed asset base.
- Gross PP&E automatically accumulates every dollar of capex, on schedule
- Straight-line depreciation from COD over an editable useful life
- Accumulated depreciation and net PP&E roll forward without manual input
- Directly feeds P&L, Cash Flow, Balance Sheet, and DCF tabs
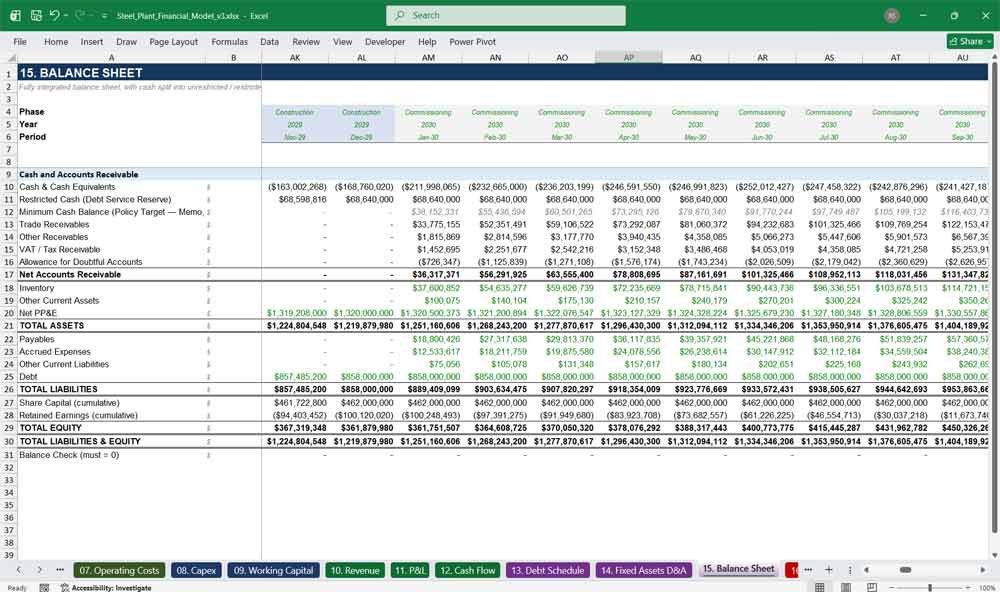
15. Balance Sheet
A fully integrated balance sheet — cash, receivables, inventory, and net PP&E against payables, debt, and equity — that balances to zero in every single period across the entire 20-year model, proving the structural integrity of the underlying financial model.
- Assets, liabilities, and equity all formula-linked, with no plug entries
- Built-in balance check row confirms Assets = Liabilities + Equity every period
- Share capital and retained earnings roll forward automatically
- The clearest evidence this steel plant financial model is genuinely integrated
Key KPIs and Sensitivities Model
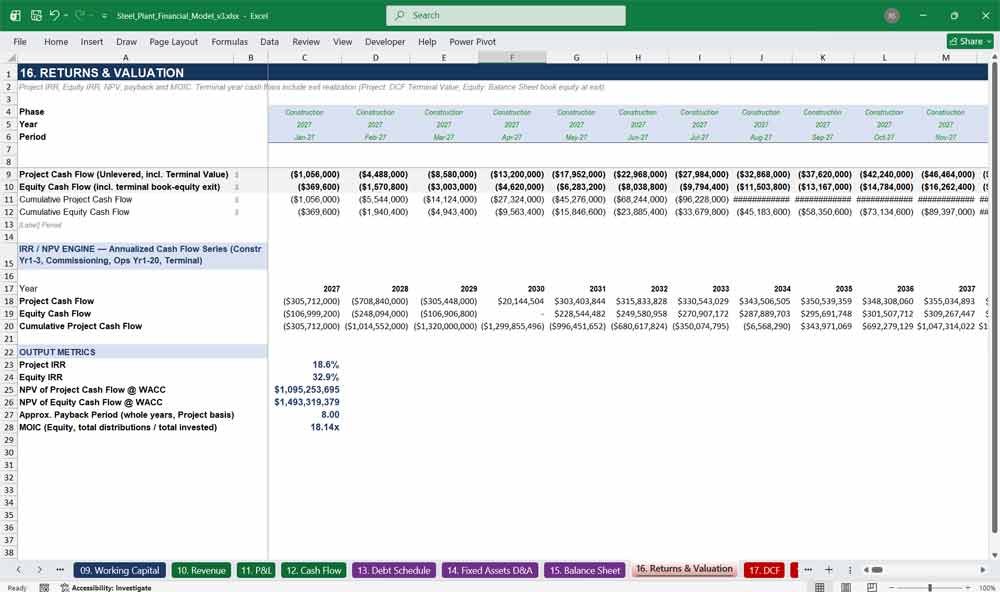
16. Returns & Valuation
Project IRR, Equity IRR, NPV, MOIC, and payback period, calculated from a clean annualized cash flow series that spans construction through terminal value — the tab investors and lenders will turn to first when assessing the deal.
- Separate Project IRR and Equity IRR, reflecting the impact of leverage
- NPV of both project and equity cash flows at WACC
- Approximate payback period and MOIC calculated automatically
- Annualized cash flow engine avoids the pitfalls of mixed monthly/annual periods
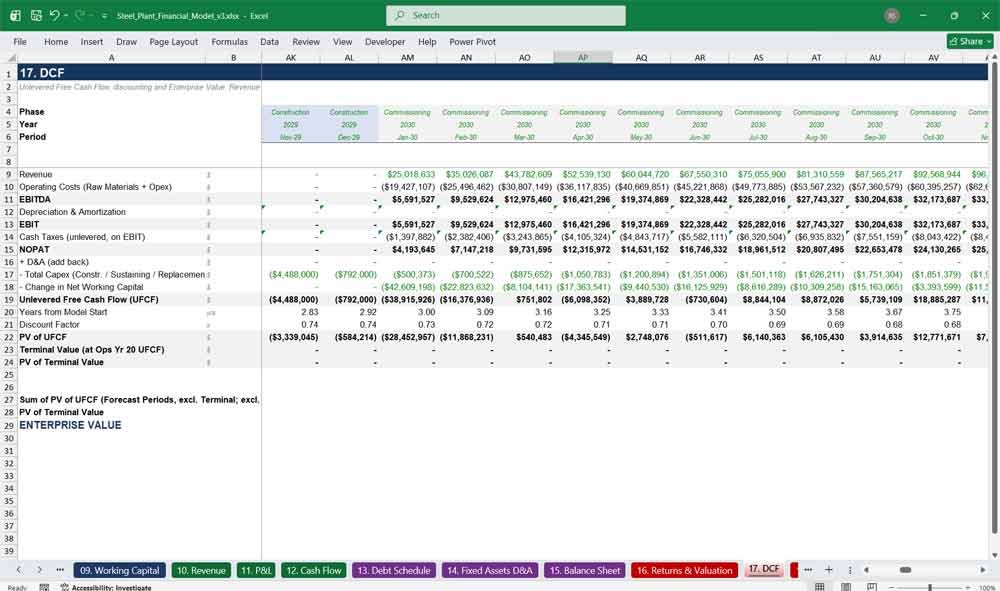
17. DCF
A textbook unlevered discounted cash flow: Revenue through EBITDA, EBIT, NOPAT, Unlevered Free Cash Flow, discount factors, and Enterprise Value with an explicit Gordon Growth terminal value — the valuation backbone of the entire steel plant financial model.
- Standard NOPAT-to-UFCF build, fully auditable line by line
- Explicit discount factor and PV of UFCF for every period
- Terminal value computed from final-year UFCF using the Gordon Growth formula
- Enterprise Value cross-checks exactly against the Returns and Sensitivities tabs
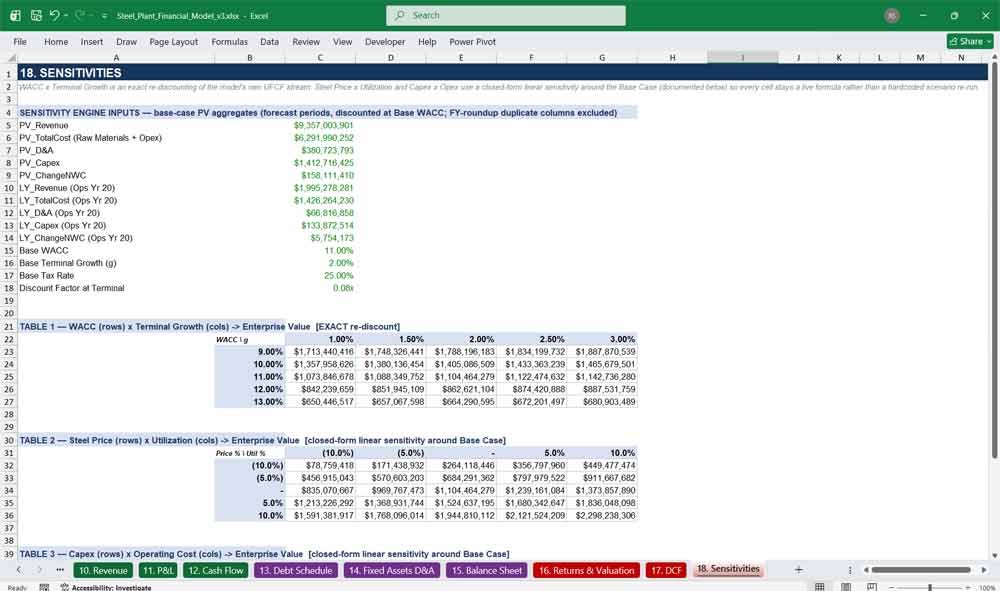
18. Sensitivities
Three built-in sensitivity tables — WACC × terminal growth, steel price × utilization, and capex × opex — turning a single-point valuation into a defensible range, exactly what investment committees and lenders ask for before committing capital.
- WACC × terminal growth table is an exact re-discounting of model cash flows
- Steel price × utilization and capex × opex tables stress-test margin risk
- Every cell is a live formula, not a hardcoded scenario snapshot
- Base-case cell in every table reconciles exactly to the DCF Enterprise Value
Steel Plant Frequently Asked Questions
Is this steel plant financial model actually editable, or are the formulas locked?
Every cell is fully unlocked and editable — there’s no password protection, no hidden macros, and no black-box calculations. Input cells are clearly marked in blue text on a yellow fill so you always know exactly what’s safe to change, and every formula is visible and auditable in the formula bar.
What Excel version do I need to open this file?
The model is a standard .xlsx file built with formulas compatible with Excel 2016 and later (including Microsoft 365), and it also opens correctly in LibreOffice Calc and Google Sheets. No add-ins, plugins, or macros are required.
If I change the construction start date, does everything else really update automatically?
Yes. Every date, calendar year, and period label across all 18 tabs is driven by a single Start Date cell on the Assumptions tab using live date formulas — change that one cell and the entire model, including the timeline, financing schedule, and valuation, re-dates itself instantly.
How many products does the model cover, and can I change the product mix?
The model ships with nine products built in — HRC, rebar, billet, plates, beams, sheets, tubes, wire, and byproduct scrap sales — each with its own editable price, escalation, and mix percentage on the Assumptions tab. A live mix-check confirms your percentages sum to 100%, and production, pricing, and revenue all recalculate automatically across every tab the moment you adjust the mix.
Does the model break construction capex down by category, or is it just one lump sum?
Capex is broken into ten real-world construction categories — blast furnace construction/upgrade, BOF replacement/upgrade, continuous casting machine expansion, rolling mill modernization, coke oven battery, sinter plant construction, waste treatment facilities, wastewater treatment plant upgrade, HPC infrastructure, and other balance-of-plant costs — each independently editable and phased on a shared, editable S-curve, so you can model exactly where your capital is going rather than a single opaque construction line.
Can I use this for a different plant capacity or steel-making route?
Yes. Capacity, utilization, product mix, pricing, and the ten capex categories are all input cells on the Assumptions tab, so you can rescale the model for a different tonnage plant in minutes. The raw material and cost structure is built for an integrated BF-BOF route; adapting it toward a scrap-based EAF operation mainly means adjusting the raw material mix and consumption rates.
Is this suitable for an actual investor pitch, lender submission, or feasibility study?
The model is structured the way project finance teams and lenders expect to see a steel plant investment presented — fully integrated three-statement financials, a construction-to-amortization debt schedule with DSCR, a proper unlevered DCF, category-level capex detail, and sensitivity analysis. You should still replace the illustrative assumptions with your own project-specific figures before relying on it for a live financing or investment decision.
Does the model include a working three-statement build (P&L, cash flow, balance sheet)?
Yes, and it’s genuinely integrated, not just three separate tabs. The balance sheet includes a built-in check row that confirms Assets equal Liabilities plus Equity in every one of the model’s 129 periods, from month one of construction through the terminal value period.
How is the debt schedule modeled — is there a cash sweep?
Debt draws down in line with construction capex, accrues interest monthly during construction and annually thereafter, and amortizes on a straight line from the commercial operations date over an editable tenor, with a built-in DSCR calculation. A cash sweep switch is included but ships off by default (documented on the Cover Control tab) to keep the model free of circular references — you can extend it if you need dynamic sweep behaviour.
What does the Sensitivities tab actually show?
Three 5×5 tables: WACC against terminal growth rate, steel price against utilization, and capex against operating costs, each showing the resulting Enterprise Value. The WACC/growth table is an exact recalculation of the model’s own cash flows; the other two use a documented closed-form sensitivity method so every cell stays a live formula rather than a static, hardcoded scenario.
Do the assumptions in the model reflect real-world steel industry figures?
The model ships with realistic, illustrative placeholder assumptions for capacity, product pricing and mix, raw material costs, the ten capex categories, and financing terms so you can see a fully working example the moment you open it. You should replace these with your own project’s figures — every input lives on the Assumptions tab and is clearly marked for editing.
Final Notes on the Financial Model
20 Year Financial Model for a Steel Plant
- Scenario Analysis: Create best-case, base-case, and worst-case projections.
- Break-even Analysis: Determine sales volume required to cover fixed & variable costs.
- Sensitivity Analysis: Assess how changes in raw material costs, pricing, or demand impact profitability.
This structured model helps help any steel plant show broad market spectrum of revenues, offering the right balance between cost, production capacity, support, and customization at each subscription level.
Download Link On Next Page
Download Link On Next Page