
Sports Nutrition Financial Model Template
This 20-Year, 3-Statement Excel Sports Nutrition Manufacturer Financial Model Template includes revenue streams from 80 product lines and order subscriptions, with cost structures, Discounted Cash Flow (DCF) with Terminal Value, Sensitivity Analysis, WACC, NPV, IRR, and financial statements to forecast the financial health of your sports nutrition company.
20-Year Financial Model for a Sport Nutrition Manufacturer
This very extensive 20 Year Nutrition Model involves detailed revenue projections, cost structures, capital expenditures, and financing needs. This model provides a thorough understanding of the financial viability, profitability, and cash flow position of your business.
Includes: 20x Income Statements, Cash Flow Statements, Balance Sheets, CAPEX sheets, OPEX Sheets, Statement Summary Sheets, and Revenue Forecasting Charts with the specified revenue streams, BEA charts, sales summary charts, employee salary tabs and expenses sheets. Over 130 Excel Spreadsheets of financial data to monitor.
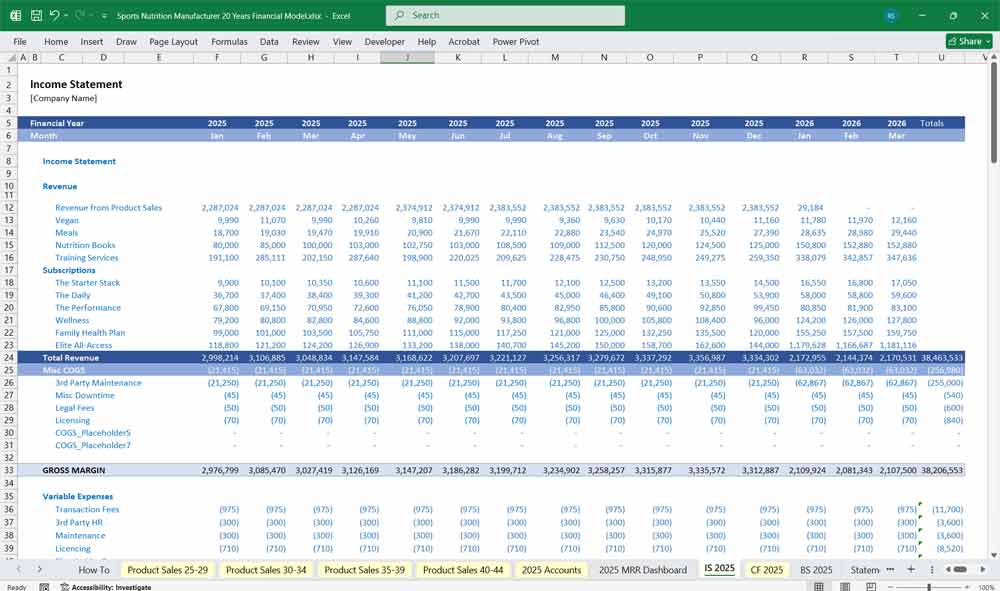
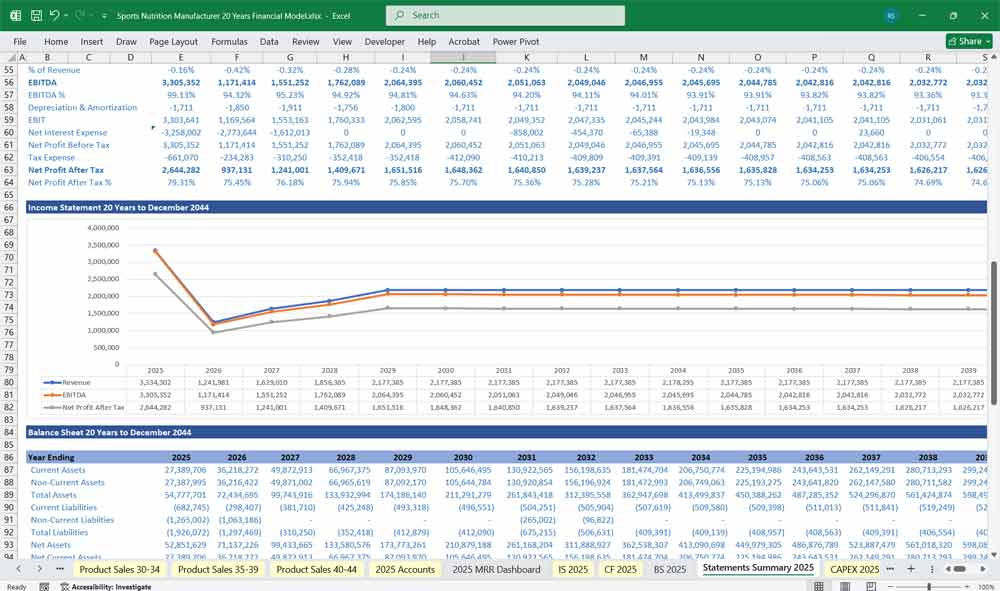
Income Statement (P&L)
The income statement projects revenues, costs, and profits over a specific period (monthly and annually).
A. Revenues
Product Sales by Category
Protein Powders
Energy Drinks & Shots
Performance Snacks & Bars
Vitamins & Supplements
Sales Channels
Direct-to-Consumer (e-commerce, brand website, subscriptions)
Retail (sports stores, supermarkets, gyms)
Wholesale/Distributors
International Sales
B. Cost of Goods Sold (COGS)
Raw Materials (whey protein, plant-based protein, amino acids, sweeteners, flavorings, packaging materials)
Manufacturing Costs (contract manufacturing or in-house plant operations, utilities, depreciation of equipment)
Logistics & Freight-in (cost to bring raw materials into the factory)
Quality Assurance & Compliance
➡ Gross Profit = Revenues – COGS
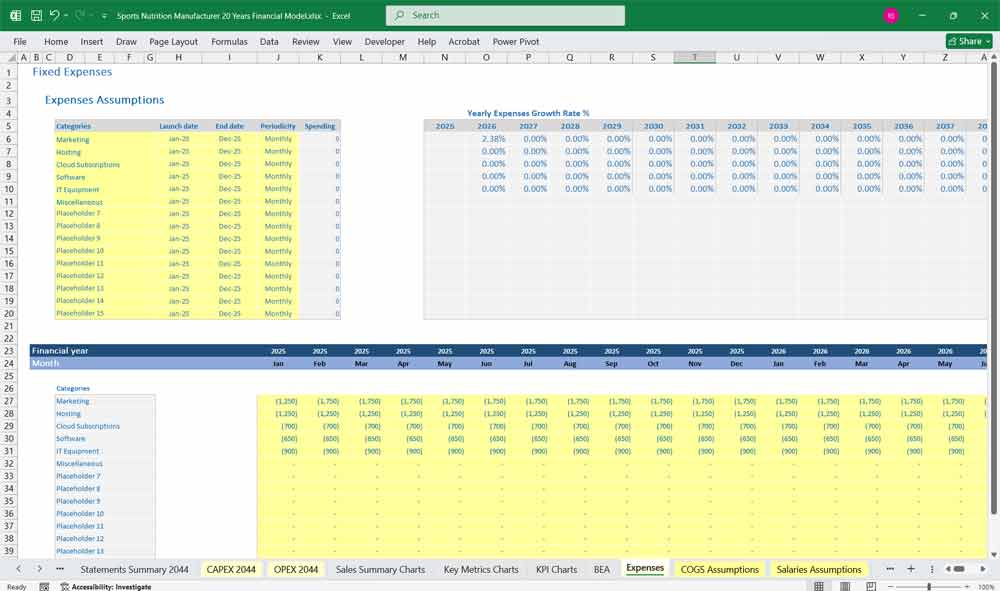
C. Operating Expenses (OPEX)
Selling & Marketing
Athlete Sponsorships & Influencer Deals
Digital Advertising (Google, Facebook, Instagram, TikTok)
Sampling Programs, Events, and Expos
Distribution & Logistics (freight-out, warehousing, fulfillment fees)
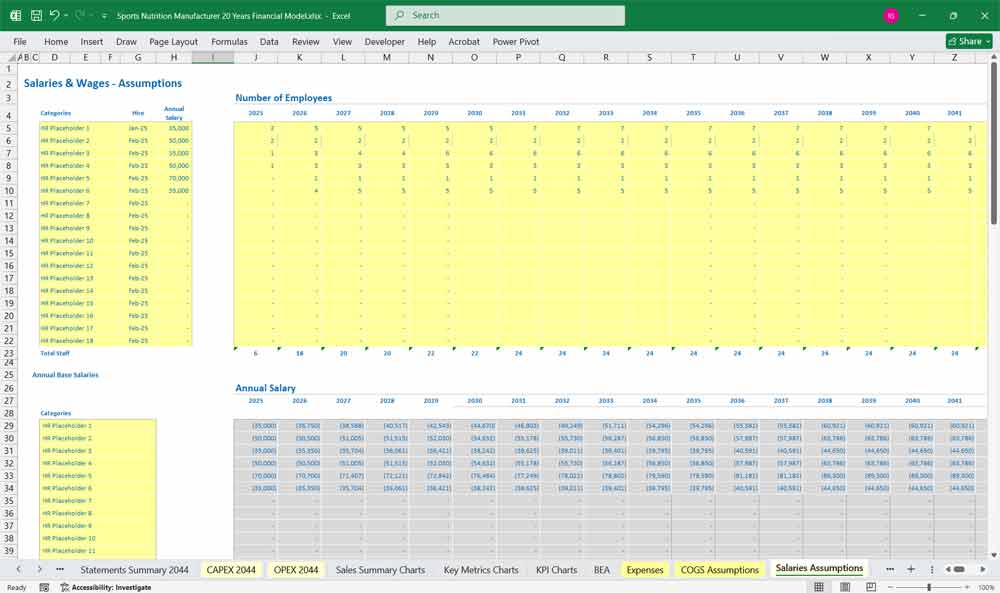
General & Administrative (G&A)
Salaries & Wages (management, R&D, admin staff)
Rent, Insurance, Office Expenses
IT Systems, ERP/CRM, Software Licenses
Research & Development (R&D)
New product formulation
Testing, certifications (e.g., NSF, Informed Sport)
EBITDA = Gross Profit – OPEX
D. Other Expenses
Depreciation & Amortization (manufacturing equipment, product formulation costs)
Interest Expense (on loans, working capital lines of credit)
Taxes
Net Income = EBITDA – D&A – Interest – Taxes
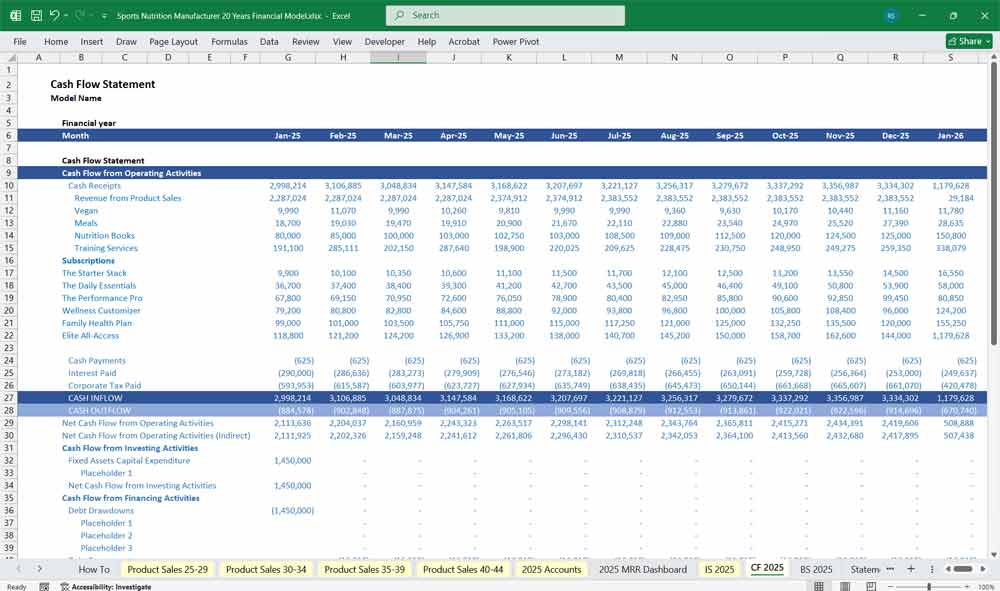
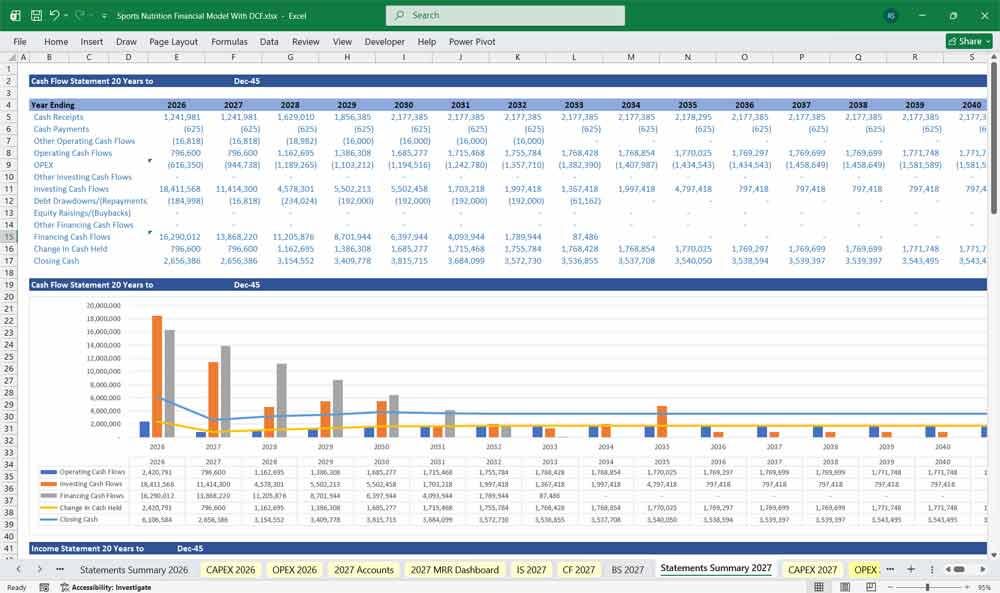
Sports Nutrition Manufacturer Cash Flow Statement
The cash flow statement translates profits into actual liquidity, showing how cash moves through operations, investments, and financing.
A. Cash Flow from Operations
Net Income (from income statement)
Non-Cash Adjustments
Depreciation & Amortization
Changes in Inventory Valuation
Changes in Working Capital
Accounts Receivable (customer payments timing, wholesale contracts)
Inventory (raw materials & finished goods buildup)
Accounts Payable (supplier credit terms)
Accrued Expenses (marketing campaigns, wages payable)
Operating Cash Flow = Net Income + Non-Cash Adjustments ± Working Capital Changes
B. Cash Flow from Investing
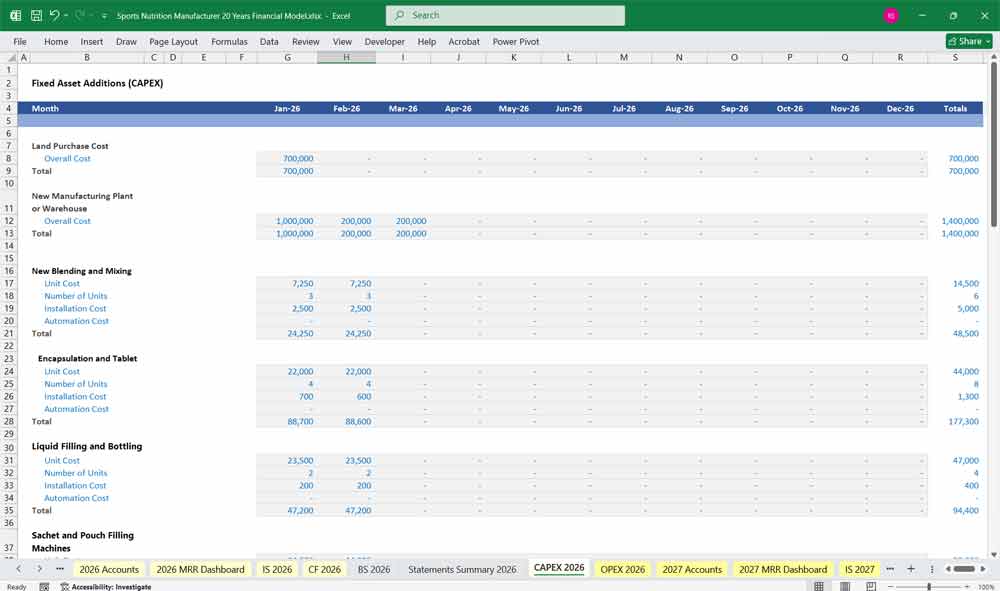
Capital Expenditures (CapEx)
New manufacturing equipment
R&D lab setup
Warehouse expansion
Intangible Investments
Trademark/Brand Development
New product formulations
Acquisitions/Investments (if expanding via buying smaller nutrition brands)
Investing Cash Flow = Cash Outflows (CapEx, acquisitions) – Cash Inflows (asset sales, if any)
C. Cash Flow from Financing
Debt Issuance or Repayment (bank loans, working capital lines, bonds)
Equity Financing (venture capital, IPO proceeds, private placement)
Dividend Payments or Share Buybacks (if mature stage)
Financing Cash Flow = New Financing – Repayments – Dividends
D. Net Change in Cash
Total Cash Flow = Operating CF + Investing CF + Financing CF
Closing cash balance rolled into the Balance Sheet.
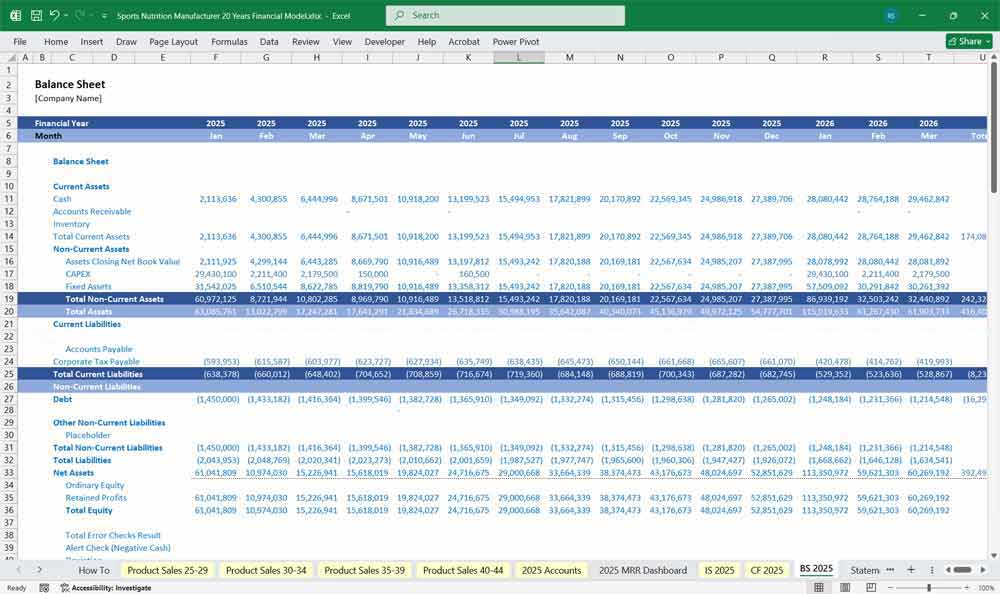
Sports Nutrition Manufacturer Balance Sheet
The balance sheet represents the company’s financial position at a point in time.
A. Assets
Current Assets
Cash & Cash Equivalents
Accounts Receivable (from retail partners, distributors, and online payment processors)
Inventory
Raw Materials (protein bases, packaging, additives)
Work-in-Progress
Finished Goods (products ready for shipment)
Prepaid Expenses (insurance, advertising contracts)
Non-Current Assets
Property, Plant & Equipment (manufacturing equipment, warehouses, offices)
Intangibles (patents, trademarks, product formulations, brand value)
Investments (subsidiaries, joint ventures, equity stakes in distributors)
B. Liabilities
Current Liabilities
Accounts Payable (suppliers, co-manufacturers)
Accrued Expenses (salaries payable, marketing campaign accruals)
Short-Term Debt (working capital loans, credit lines)
Non-Current Liabilities
Long-Term Debt (bank loans, bonds)
Lease Liabilities (warehouses, equipment financing)
Deferred Tax Liabilities
C. Equity
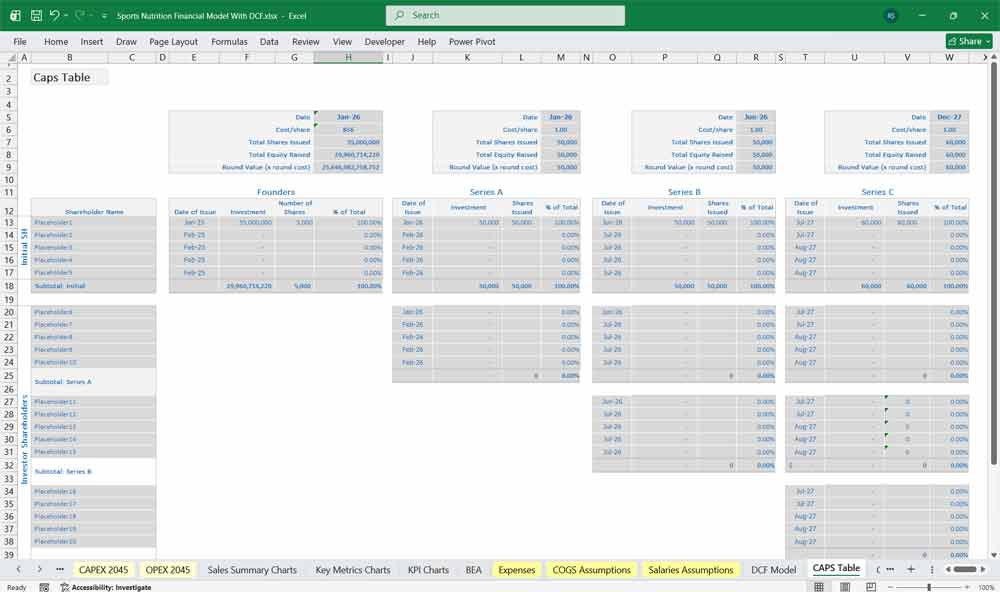
Paid-In Capital (from founders, investors, private equity)
Retained Earnings (accumulated profits reinvested into business)
Other Reserves (currency translation, revaluation reserves if applicable)
Assets = Liabilities + Equity
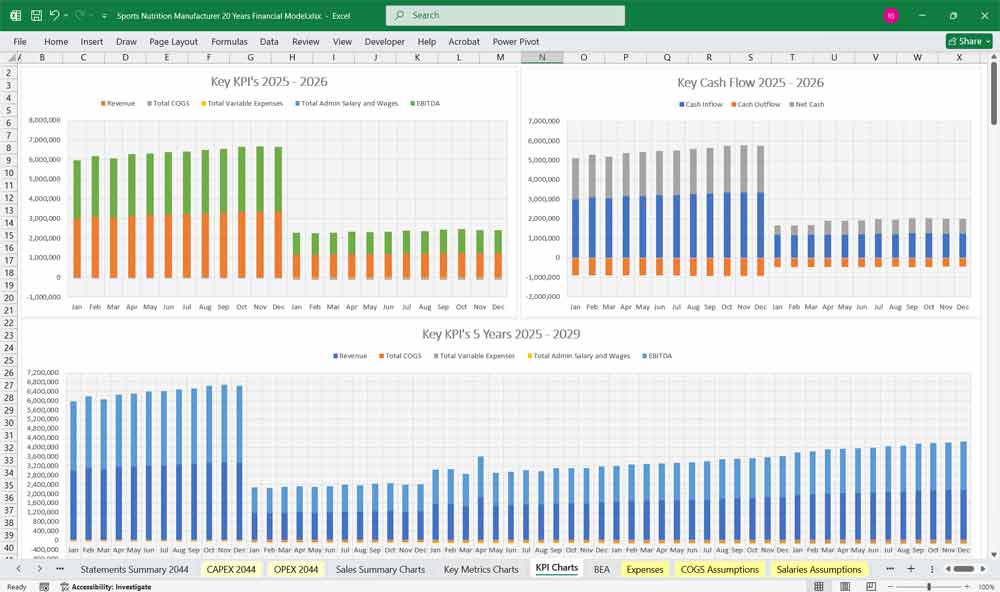
Key Financial Metrics for a Sports Nutrition Manufacturer
Revenue Metrics
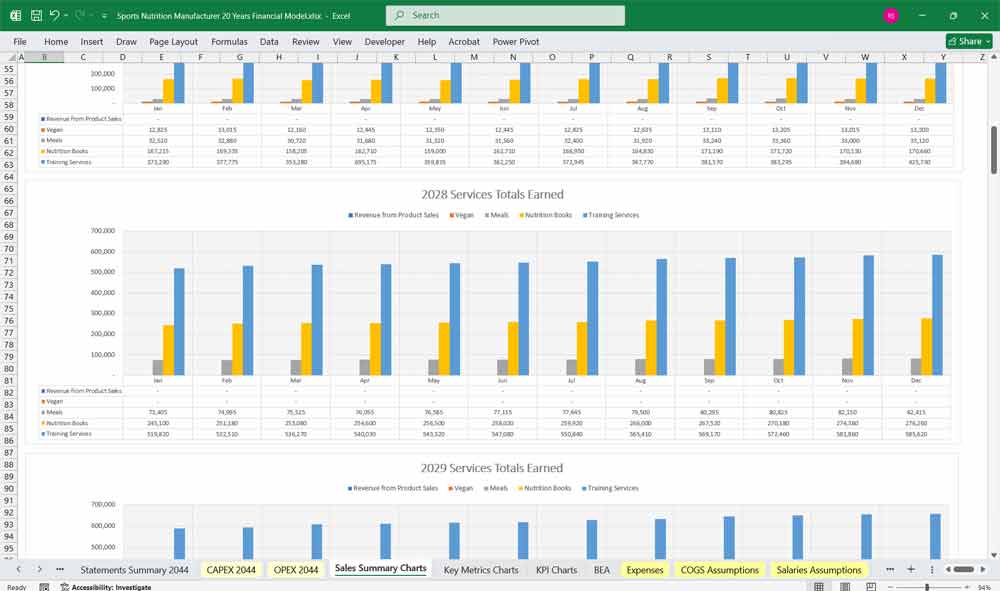
Monthly Recurring Revenue (MRR): Predictable income from ongoing services like colocation, cloud hosting, or managed services.
Annual Recurring Revenue (ARR): Yearly equivalent of MRR, providing a long-term revenue outlook.
Revenue per sale from 80 product lines: Income generated per item sale.
Cost Metrics
Capital Expenditure (CapEx): Initial investment in New Blending and Mixing Machinery and Sachet and Pouch Filling Machines, etc.
Operational Expenditure (OpEx): Ongoing costs, Personnel Costs, Wholesale Supplies and Materials.
Cost per Sale: Total cost of item and distribution of saleable items.
Power Usage Effectiveness (PUE): Ratio of total energy used to energy delivered to Manufacturing equipment (lower PUE = better efficiency).
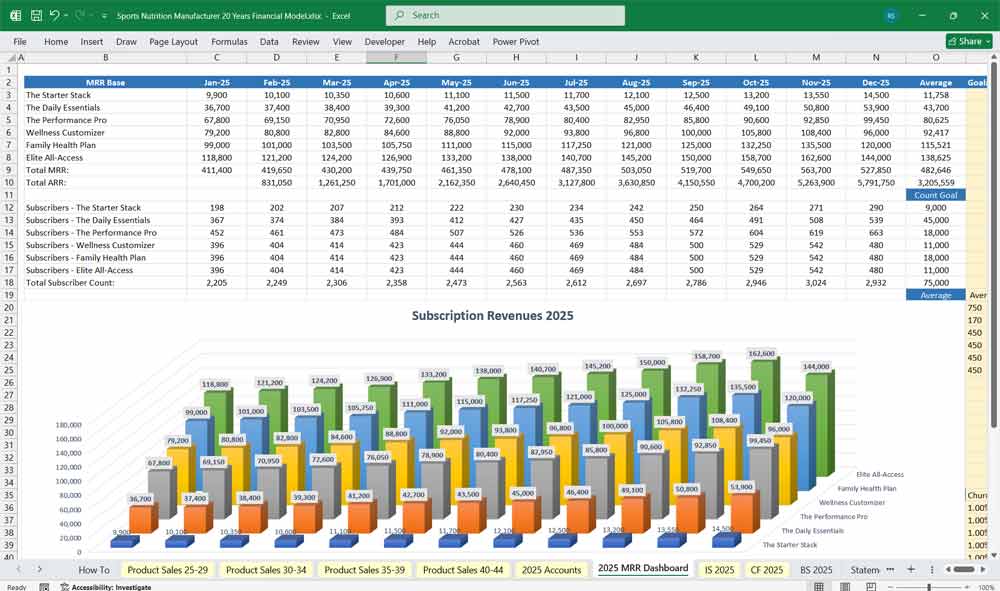
6 Subscription Tier Ideas for a Sports Nutrition Supplements Manufacturer
Here are six subscription tier ideas for a nutrition supplements manufacturer, designed to offer value to different types of customers. Already added to the model, but all are fully editable.
1. The Starter Stack
This tier is perfect for new customers or those looking for a simple, single-product subscription. It’s an easy entry point to get people familiar with your products without a high commitment.
Pricing: One product subscription, such as a monthly supply of protein powder or a multivitamin.
Benefits: A small discount (e.g., 10%) on the single product, flexible delivery dates, and a welcome guide.
Bonus Idea: Offer a “starter kit” with a shaker bottle or pill organizer for the first shipment.
2. The Daily Essentials
Targeting customers who want to cover their basic nutritional needs. This tier bundles a few complementary, everyday supplements.
Pricing: A bundle of 2–3 core products, like a multivitamin, fish oil, and a probiotic.
Benefits: A more significant discount (e.g., 15–20%) on the bundled products, plus educational content on the benefits of each supplement.
Bonus Idea: Include a “cheat sheet” with suggested timing for each supplement.
3. The Performance Pro
This tier is designed for serious athletes and fitness enthusiasts who need a comprehensive stack to support their training goals.
Pricing: A premium bundle of 4–5 specialized products, such as protein powder, pre-workout, creatine, and BCAAs.
Benefits: A substantial discount (e.g., 25%), early access to new products, and a complimentary “Pro-Level” workout or nutrition guide.
Bonus Idea: Offer a limited-edition t-shirt or gym bag with the first delivery.
4. The Wellness Customizer
For customers who want a tailored approach to their health. This tier allows them to build their own supplement stack from a curated selection.
Pricing: Tiered pricing based on the number of products selected (e.g., choose any 3 for X price, any 5 for Y price).
Benefits: The flexibility to change products each month based on their needs, plus a free one-on-one consultation with a registered dietitian or nutritionist once a year.
Bonus Idea: Provide a short quiz on the website to help them select their initial product combination.
5. The Family Health Plan
This tier is perfect for households where multiple people use supplements. It provides a convenient and cost-effective way to get products for the entire family.
Pricing: A bulk subscription with a larger quantity of popular products or the option to mix and match from a family-friendly selection.
Benefits: The best per-unit price, an exclusive “Family Health” e-book with recipes and wellness tips, and free shipping.
Bonus Idea: Include a kid-friendly product, like a chewable vitamin, as a first-shipment bonus.
6. The Elite All-Access
This is your top-tier offering for the most loyal and high-value customers. It provides the ultimate convenience and exclusive benefits.
Pricing: A premium monthly fee that includes a custom selection of products.
Benefits: All products at cost or a massive discount, a dedicated account manager, quarterly check-ins with a nutrition expert, and exclusive access to new and limited-run products before anyone else.
Bonus Idea: Offer a branded subscription box with premium packaging and a personalized note each month.
Additional Considerations in the Model
Scenario Analysis: Seasonal sales spikes (New Year fitness goals, summer, competition seasons).
Sensitivity Analysis: Impact of raw material cost swings (e.g., whey protein prices), marketing spend efficiency, and distribution margin shifts.
KPIs for Sports Nutrition Industry:
Gross Margin % (key driver due to raw material volatility)
Marketing Spend as % of Sales
Inventory Turnover (shelf-life sensitivity of products)
Customer Acquisition Cost (CAC) & Lifetime Value (LTV) for D2C
EBITDA Margin
Benefits of a 20-year financial model For A Sports Nutrition Company
provides long-term visibility into the growth trajectory of a sports nutrition manufacturer. It allows the company to project revenues across different product categories—such as protein powders, energy drinks, and supplements—while accounting for changing consumer preferences and evolving distribution channels. By extending the time horizon, management can better anticipate when to expand production capacity, enter new markets, or diversify product lines.
Better Capital Planning For Your Sports Nutrition Company
Such a model also helps in capital planning and investment decisions. A manufacturer may require significant upfront spending on production facilities, equipment, and R&D. A 20-year outlook enables the business to assess when these investments will pay off and how to balance them with financing strategies. It also provides clarity on when external funding, whether through equity or debt, may be needed to support growth without straining liquidity.
Long Term View For Sports Nutrition Manufacturing
From a risk management perspective, a long-term model allows the company to test various scenarios such as raw material cost fluctuations, supply chain disruptions, or regulatory changes. By running sensitivity analyses, management can understand how resilient the business is under different market conditions. This foresight helps in developing contingency strategies and building financial buffers to safeguard against volatility in the sports nutrition industry.
20 Years of Sports Nutrition Manufacturing Projections
Finally, a 20-year model is a powerful tool for stakeholder communication. Investors, lenders, and strategic partners often require detailed financial projections to evaluate the company’s long-term viability. Presenting a robust model demonstrates credibility, professionalism, and strategic foresight, enhancing the company’s ability to secure financing and partnerships. For a sports nutrition manufacturer, this can mean the difference between incremental growth and scaling into a globally recognized brand.
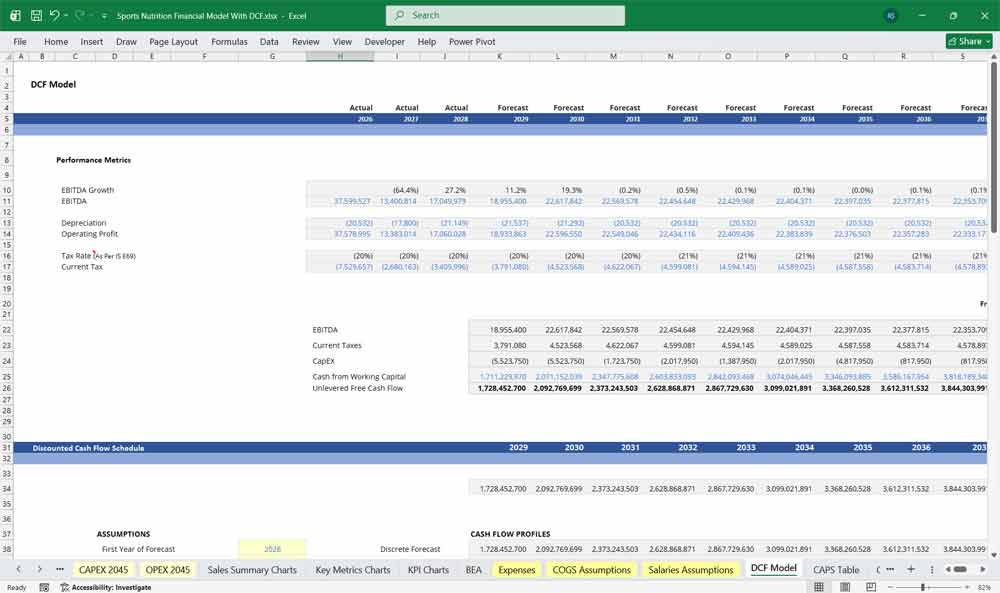
Valuing Your Sports Nutrition Manufacturing With A DCF
DCF: Valuing the “Active Lifestyle” Recurring Revenue
This 20-year Discounted Cash Flow (DCF) analysis for a sports nutrition manufacturer, the valuation is a forecast of brand loyalty, product innovation, and the secular growth of the wellness economy. The model projects cash flows derived from high-volume sales of protein powders, amino acid supplements, and ready-to-drink (RTD) functional beverages, balanced against CapEx for automated powder-blending silos, high-speed bottling lines, and cleanroom packaging facilities. Because consumer switching costs are relatively low, the DCF must factor in steady, aggressive OpEx for influencer marketing and retail slotting fees to defend market share. The Terminal Value usually carries significant weight, reflecting the company’s ability to transition from a niche fitness brand into a mainstream lifestyle portfolio with stable, predictable subscription revenue through direct-to-consumer (DTC) channels.
WACC: Pricing Consumer Staples and the “Whey and Formulation Beta”
The Weighted Average Cost of Capital (WACC) for a sports nutrition manufacturer typically represents the company’s blended cost of debt and equity financing. For a sports nutrition manufacturer, WACC is influenced by competitive pressure, changing consumer preferences, regulatory oversight on health claims, and reliance on brand reputation. Companies with strong recurring demand and diversified product portfolios may benefit from lower financing costs, while emerging brands may face higher investor return expectations.
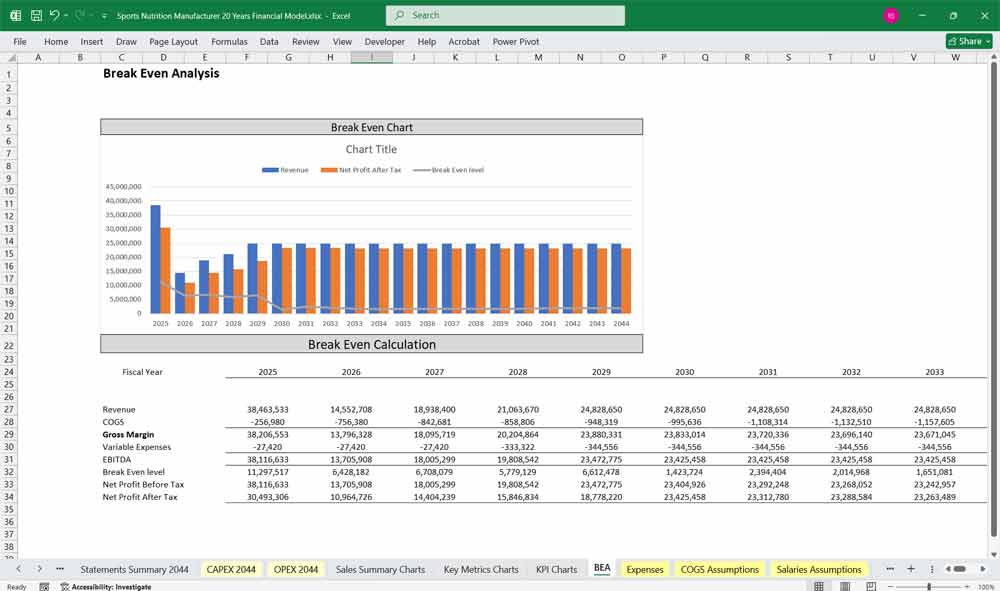
Sensitivity Analysis: Stress-Testing the “Protein-to-Flavor” Spread
For a sports nutrition firm, Sensitivity Analysis is the primary tool for measuring margin elasticity in a highly competitive, inflation-sensitive retail environment. Financial analysts use sensitivity tables to see how a 20% spike in raw whey or plant-protein isolate costs or a 10% compression in wholesale distributor margins impacts the net present value. A highly specific variable to stress-test is the “DTC vs. Wholesale” channel mix; selling directly to consumers online yields significantly higher gross margins but leaves the business highly vulnerable to sudden spikes in social media advertising costs. By identifying the exact break-even point where raw ingredient inflation intersects with pricing power, the sensitivity analysis reveals whether the manufacturer is a market leader capable of passing costs onto consumers or a vulnerable private-label supplier.
Final Notes on the Financial Model
This 20 Year Sports Nutrition Financial Model must focus on balancing capital expenditures with steady revenue growth from diversified product lines. By optimizing operational costs, and power efficiency, and maximizing high-margin services, the model ensures sustainable profitability and cash flow stability.
Download Link On Next Page
Download Link On Next Page