
Social Media Marketing Financial Model Template
This Social Media Marketing Agency Financial Model is a professional Excel template for agency founders, marketing consultants, investors and finance teams. It builds a complete 5-year monthly financial forecast with an annual roundup for each year. Every figure traces back to the marketing funnel, from impressions to clicks, leads and paying clients. You get an integrated P&L, cash flow statement and balance sheet, plus the metrics every digital agency is judged on: CAC, ROAS, LTV, LTV:CAC, CPL, CPC, CPM, CTR, MRR and ARR. It is built for anyone raising capital, applying for a bank loan or planning growth.
Financial model for a Social Media Marketing Agency
Revenue is built bottom-up across seven services: retainers, paid advertising management, social media management, content creation, influencer marketing, consulting and performance-based fees. Each service has its own pricing, new client wins, churn and annual price increases. Channel-level funnels cover Facebook, Instagram, TikTok, LinkedIn, YouTube and X. They turn your ad budget and content plan into new customers, so you can see how changes to CPMs, conversion rates or ad spend affect revenue, cash and valuation.
The model follows lender- and investor-ready conventions. Blue inputs, black formulas and green links show at a glance what is safe to edit, and a dedicated checks tab confirms the balance sheet balances every month. Cost of Revenue is kept separate from operating expenses, so gross margin reflects true delivery economics. Change one start date and all 60 months re-date automatically. Toggle between Base, Upside and Downside scenarios to stress-test your social media agency business plan in seconds.
What’s Inside: Tab-by-Tab Overview
01. Cover Dashboard
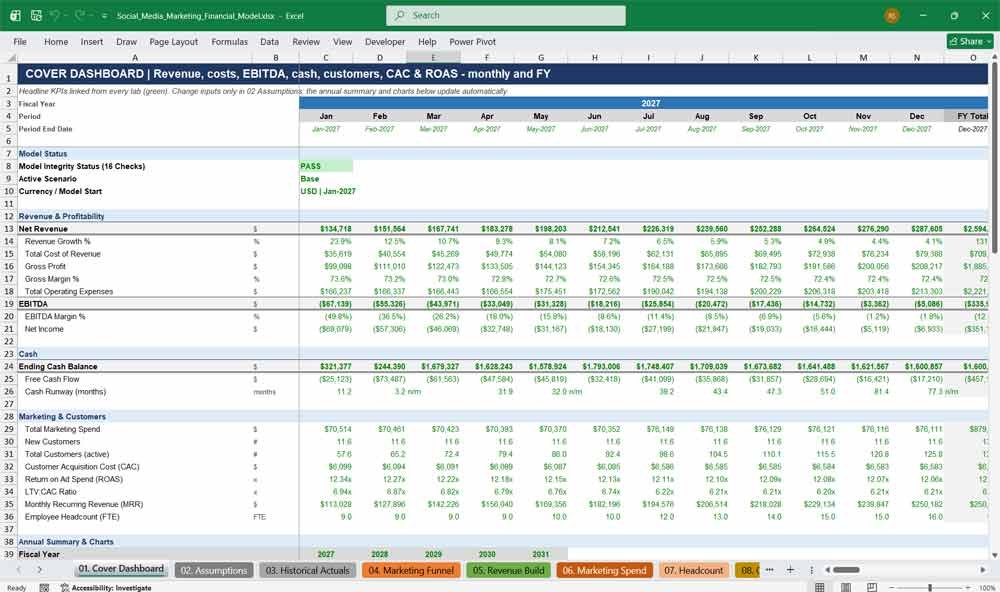
The executive dashboard summarises your social media agency’s performance on one page. Net revenue, gross profit, EBITDA, net income, cash, CAC, ROAS and LTV:CAC are shown monthly and annually. Built-in charts and a live model-integrity status suit investors.
- Monthly and fiscal-year KPI summary for 2027–2031
- Revenue, gross profit and EBITDA chart, plus cash balance and customer growth charts
- Model integrity (PASS/REVIEW) and active scenario shown at the top
- Hyperlinked tab directory and colour legend
02. Assumptions
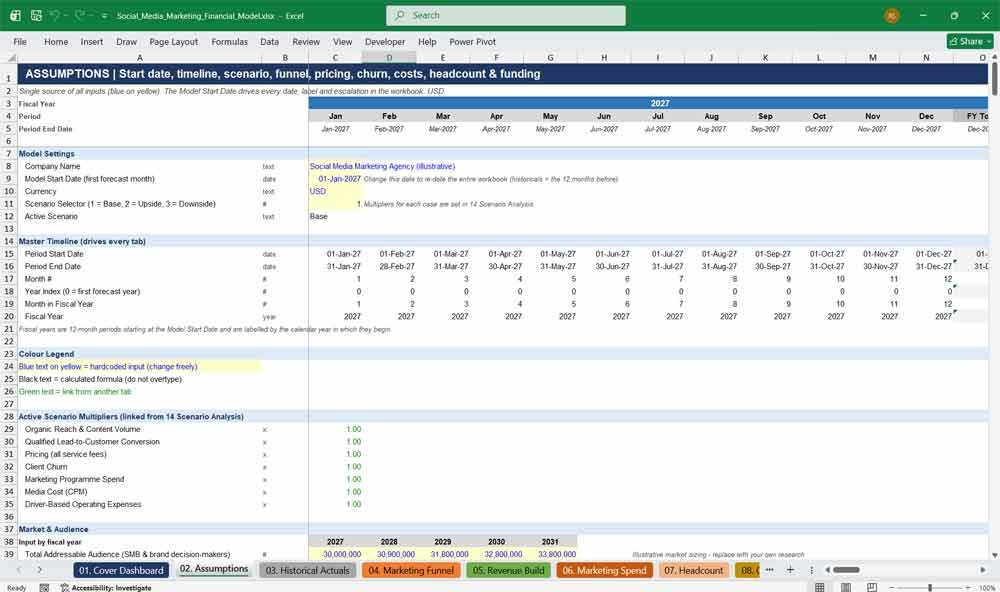
One central assumptions tab controls the entire agency financial model. Set your start date, pricing, churn, funnel conversion rates, CPMs, ad budgets, headcount plan, operating costs, working capital, tax and funding. Every input is clearly marked, documented and editable.
- A single Model Start Date re-dates every tab, label and escalation automatically
- Channel CPM, CTR, click-to-lead and organic reach settings for six social platforms
- Headcount roster with hire month, FTE and salary; hire dates update automatically
- Operating expense drivers: fixed $/month, % of revenue, $ per employee and annual escalation
- Funding events: equity round, term loan, acquisitions, dividends and share buybacks
Social Media Marketing Spend & revenue
03. Historical Actuals
Import twelve months of historical actuals to anchor your forecast in real performance. Add past revenue by service, costs, marketing results, active clients and the closing balance sheet. The final month automatically seeds every opening balance in the forecast.
- Monthly P&L, marketing funnel and client counts for the prior year
- Full month-end balance sheet with a built-in balance check
- Opening cash, receivables, payables, debt, equity and fixed assets feed the forecast
- Clearly marked placeholder data, ready to replace with your management accounts
04. Marketing Funnel
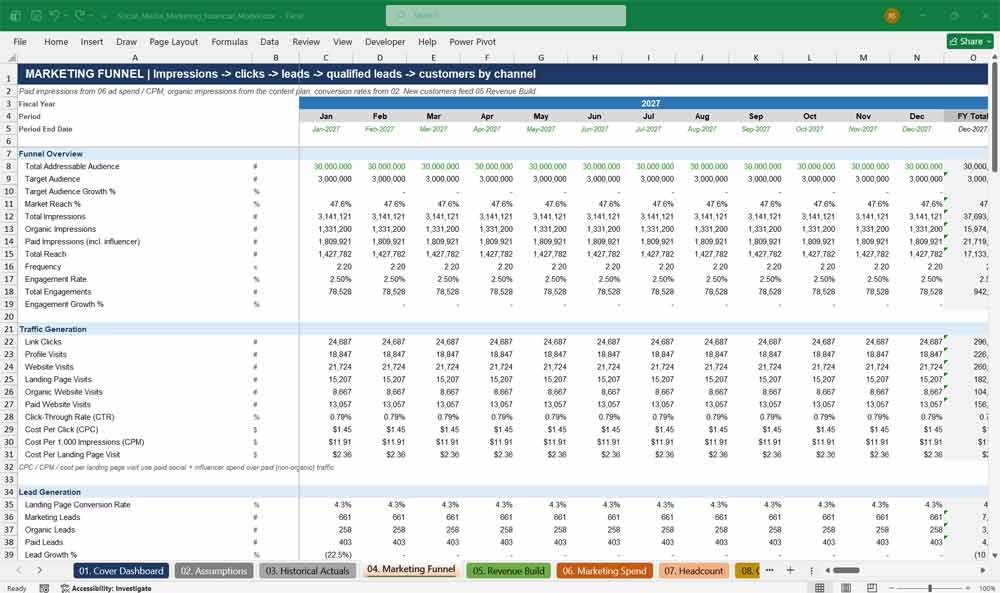
A full-funnel social media marketing model converts ad spend and content into customers. It tracks impressions, reach, engagement, clicks, website visits, leads, qualified leads and new customers. Paid and organic results are split for every social channel.
- Funnel overview: addressable audience, target audience, reach, frequency and engagement rate
- Traffic, lead generation and customer acquisition stages with CTR, CPC, CPM and CPL
- Channel funnels for Facebook, Instagram, TikTok, LinkedIn, YouTube and X
- Content funnel (reels, stories, short- and long-form video, blogs) and influencer funnel
- Funnel economics: LTV, LTV:CAC, marketing ROI and ROAS
05. Revenue Build
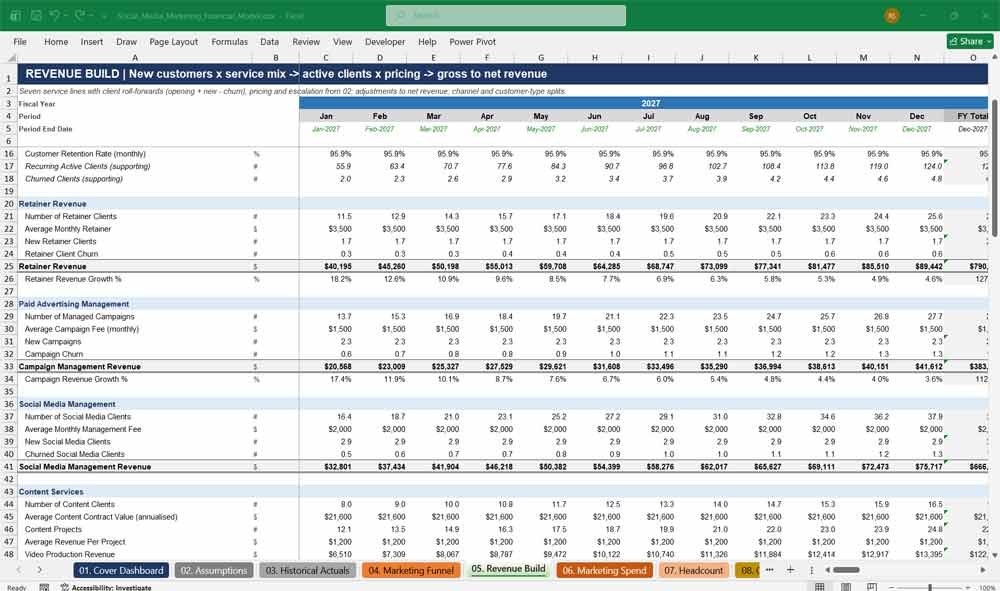
Bottom-up agency revenue forecasting across seven service lines. New customers are allocated by service mix, then tracked as active clients with churn and pricing. It includes MRR, ARR, ARPU, revenue adjustments, and revenue by channel and customer type.
- Client wins, churn and active clients for retainers, campaigns, social media management, content and more
- Content revenue split into video, graphic design and copywriting; consulting into strategy, audit and training
- Influencer management fees and commission revenue; performance fees on attributed client revenue
- Discounts, promotions, refunds, credits and bad debt bridge gross revenue to net revenue
- Built-in reconciliation checks on the channel and customer-type splits
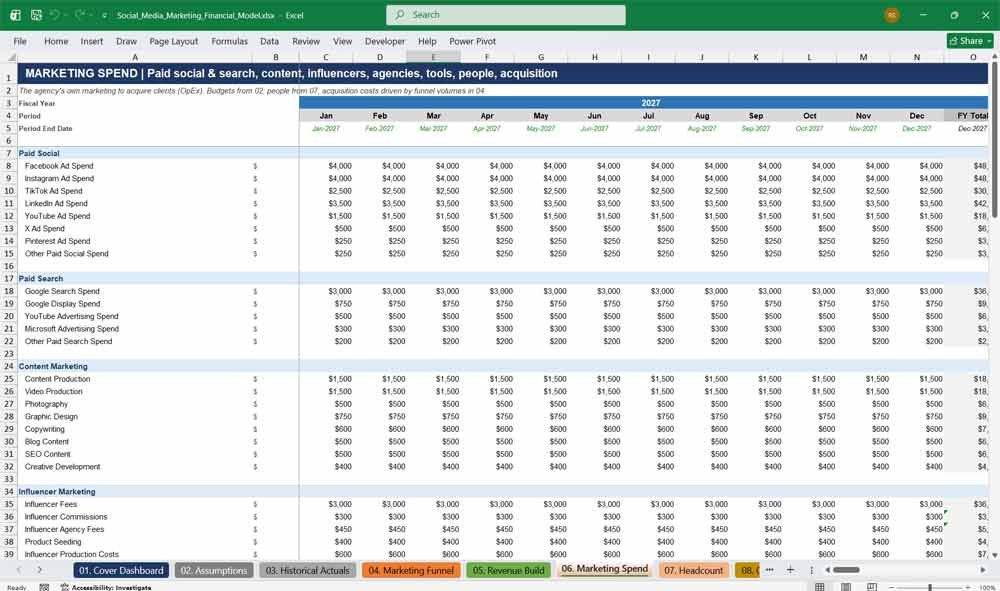
06. Marketing Spend
Plan the agency’s own marketing budget to win new clients. Model paid social, paid search, content marketing, influencer campaigns, agencies, freelancers, marketing software, campaign costs, marketing staff and customer acquisition costs, with KPIs including spend as a percentage of revenue.
- Ad spend by platform: Facebook, Instagram, TikTok, LinkedIn, YouTube, X, Pinterest and Google
- Influencer fees, commissions, product seeding and production linked to campaign volume
- Marketing technology stack: CRM, social listening, automation, SEO and design software
- Lead generation, sales commissions, referral and affiliate costs linked to funnel results
- Marketing spend growth, % of revenue, CAC, CPL, ROAS and marketing ROI
07. Headcount
A role-by-role staffing plan for a growing digital marketing agency. It models full-time employees and contractors by department, monthly FTE, salaries with annual raises, bonuses, payroll taxes, pension, benefits, health insurance and recruitment costs for every new hire.
- Monthly FTE for every role, driven by hire and end months
- Salary cost by department: executive, account management, operations, sales, marketing and more
- Employer on-costs calculated automatically from central assumptions
- Headcount by department, average salary and fully loaded cost per FTE
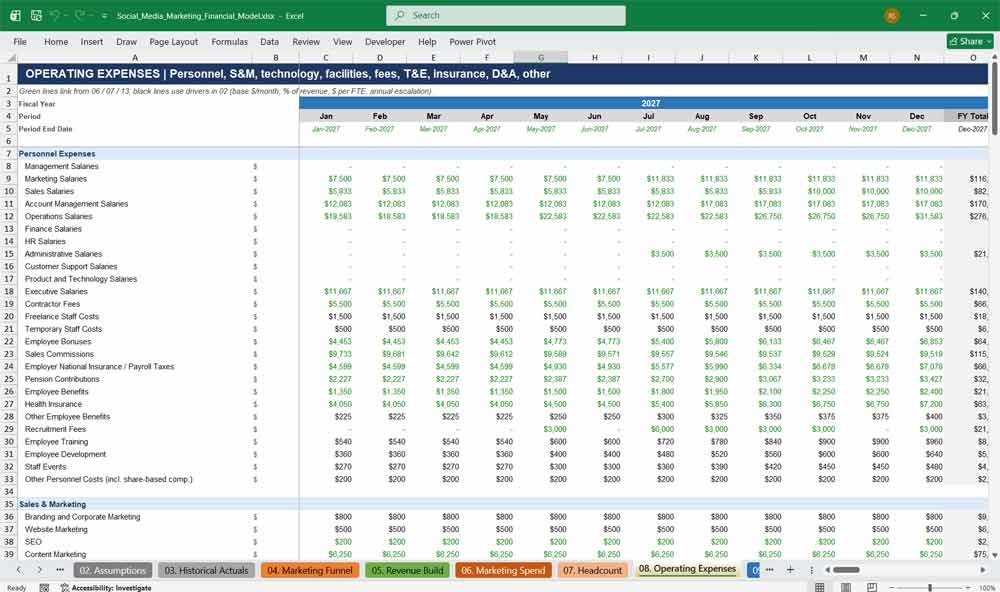
08. Operating Expenses
Detailed operating expense forecasting covering over 200 agency cost lines. It includes personnel, sales and marketing, software, office, professional fees, travel, insurance, banking, taxes, R&D, depreciation and other costs, each with a flexible cost driver.
- Links from headcount, marketing spend and capex, so no cost is counted twice
- Driver-based lines: fixed monthly cost, % of revenue, per-employee cost and annual inflation
- Totals by category, including OpEx before and after depreciation and amortisation
- Metrics: OpEx % of revenue, cost per employee, G&A ratio and EBITDA margin
Social Media Marketing Financial Statements
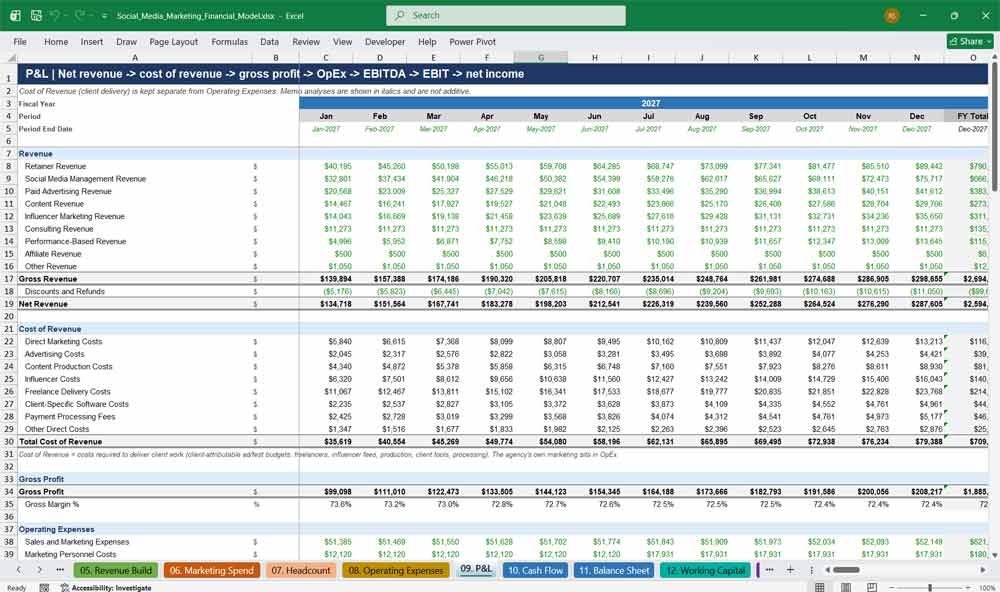
09. P&L
An integrated profit and loss statement for a social media agency, from gross revenue to net income. Client delivery costs are shown separately in Cost of Revenue for accurate gross margin, before operating expenses, EBITDA, EBIT, interest, tax and profit.
- Cost of Revenue: client ad budgets, freelance delivery, influencer fees, production and client software
- Operating expense categories that add up exactly to total OpEx, with personnel, technology and G&A breakdowns
- EBITDA, EBIT and net income margins, with monthly and annual growth rates
- Tax losses carried forward automatically offset future taxable profit
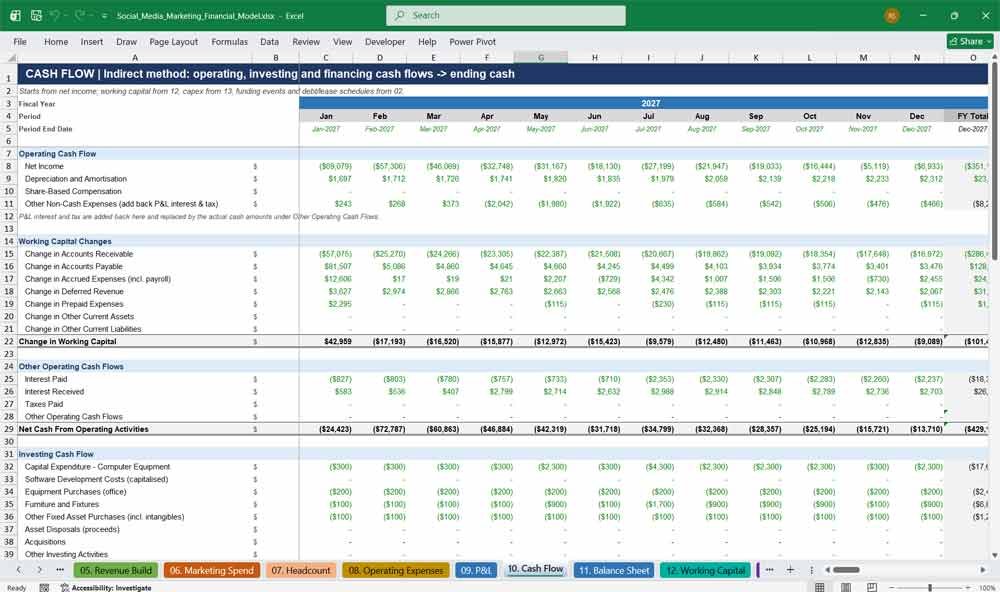
10. Cash Flow
An indirect-method cash flow statement showing operating, investing and financing cash flows every month. It tracks working capital, capex, equity raises, debt drawdowns, loan repayments, lease payments and dividends, and calculates free cash flow, cash burn and runway.
- Net income reconciled to operating cash flow with working capital changes
- Interest and taxes shown on a cash-paid basis
- Supporting debt and lease schedules
- Free cash flow, FCF margin, monthly burn, cash runway and cash conversion
11. Balance Sheet
A fully balancing monthly balance sheet. It covers cash, receivables, prepaid expenses, fixed assets, capitalised software, goodwill, payables, accruals, deferred revenue, debt, leases and shareholders’ equity, with retained earnings rolling forward at each year-end.
- Current and non-current assets and liabilities, split into current and long-term portions
- Equity section with share capital, paid-in capital, retained earnings and current-year profit
- Balance, cash, retained earnings and working capital checks every month
- Current ratio, quick ratio, debt-to-equity, net debt and equity ratio
12. Working Capital
Model the cash tied up in running your agency. Receivables are driven by DSO and payables by DPO, alongside accrued expenses, accrued payroll, prepaid costs, deferred revenue from retainers billed in advance, and quarterly tax payments, all flowing into cash flow.
- DSO and DPO set by year, with actual days calculated each month
- Allowance for doubtful accounts shown against gross receivables
- Net working capital and cash conversion cycle
- Working capital changes feed the cash flow statement
13. Capex & Depreciation
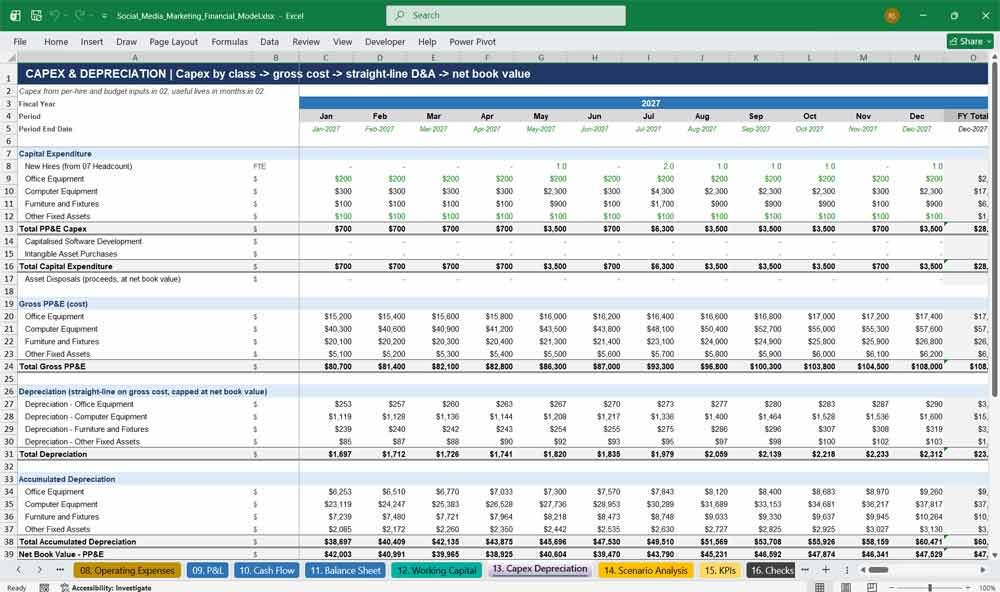
Plan capital expenditure and depreciation for agency equipment and technology. Computer equipment and furniture scale with new hires, alongside office equipment, other fixed assets, capitalised software development and intangible assets, each with its own useful life.
- Capex by asset class driven by hiring and annual budgets
- Straight-line depreciation and amortisation that never takes book value below zero
- Gross cost, accumulated depreciation and net book value tracked monthly
- Depreciation and amortisation total flows to the P&L and OpEx
Social Media Marketing Agency Key KPIs
14. Scenario Analysis
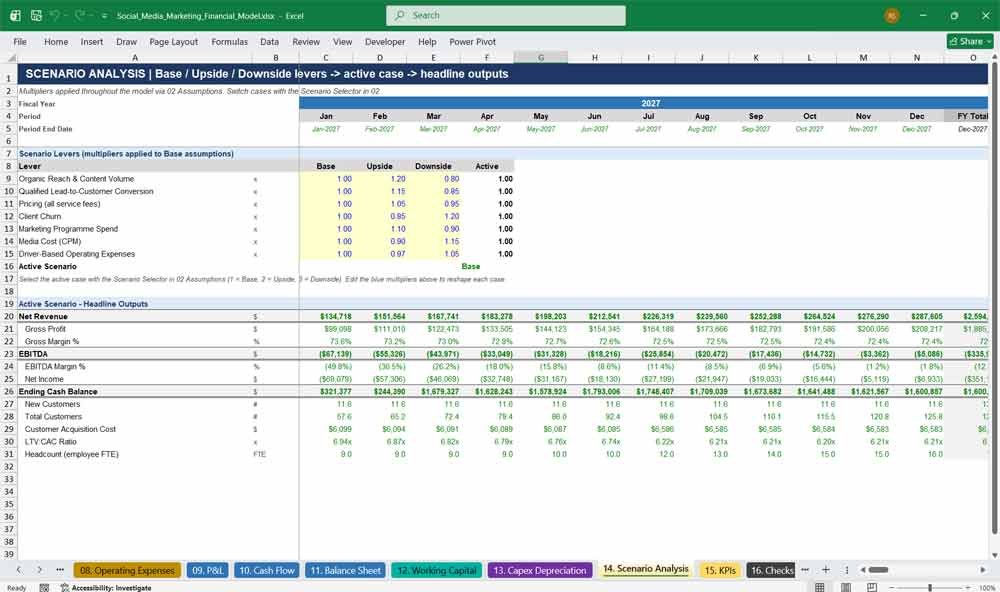
Stress-test your social media agency forecast with Base, Upside and Downside cases. Seven levers adjust organic reach, conversion rates, pricing, churn, marketing spend, media costs and operating costs. Switch scenarios instantly and see revenue, EBITDA and cash update.
- Editable multipliers for each lever in each case
- One-click scenario selector in Assumptions
- Headline results for the active case: revenue, EBITDA, cash, customers, CAC and LTV:CAC
- Ideal for investor sensitivity analysis and lender downside testing
15. KPIs
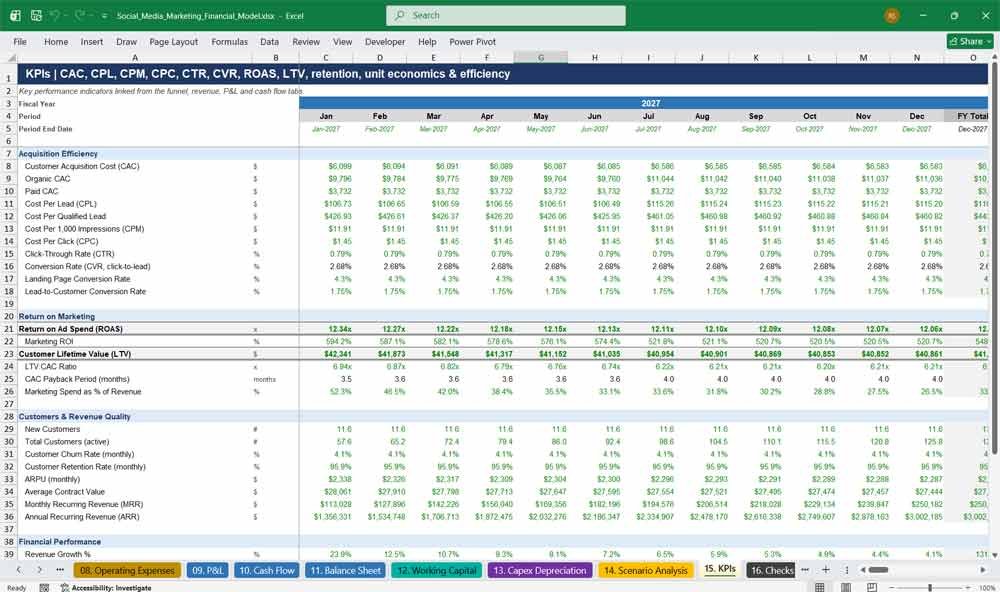
A complete digital marketing KPI dashboard covering acquisition efficiency, return on marketing, customer quality and financial performance. It tracks CAC, CPL, CPM, CPC, CTR, CVR, ROAS, LTV, CAC payback, churn, retention, ARPU, MRR, ARR and revenue per employee.
- Acquisition metrics: blended, organic and paid CAC; cost per qualified lead
- Return metrics: ROAS, marketing ROI, LTV, LTV:CAC and CAC payback months
- Customer metrics: churn, retention, ARPU, contract value, MRR and ARR
- Financial metrics: margins, growth, headcount, cash and runway
16. Checks
An automated model audit tab gives you and your investors confidence. More than 15 integrity checks run every month, alongside formula-error scans on every tab and warning flags, and return an overall PASS or REVIEW status.
- Balance sheet, cash reconciliation and retained earnings checks
- Tie-outs between revenue, OpEx, D&A, headcount, marketing spend and the P&L
- Checks that service mix, revenue splits and customer mix each total 100%
- Warnings for negative cash, negative EBITDA and LTV:CAC below 3x
Why Buy This Model?
Building a credible social media agency financial model from scratch takes weeks and one broken formula can undermine your whole pitch. This template gives you a complete, working, investor-grade 5-year forecast from day one. The marketing funnel, revenue build, headcount, operating costs, cash flow and balance sheet are already connected and audited, with over 66,000 live formulas and zero hardcoded results. It speaks the language agency investors care about (CAC, ROAS, LTV:CAC, MRR and gross margin) and keeps client delivery costs separate from overheads so your unit economics hold up to scrutiny. Change one start date, update the blue input cells, and your business plan, bank loan application or fundraising deck is ready to go.
Social Media Marketing Frequently Asked Questions (Faq)
Is this model suitable for a new agency with no trading history?
Yes. Enter zero or estimated figures in the 03. Historical Actuals tab (for example, your opening cash and share capital), and the forecast builds from there. The funnel and revenue build drive growth from your assumptions, not from past results.
I run an existing agency. Can I load my real numbers?
Absolutely. Paste twelve months of revenue, costs, marketing results, client counts and your month-end balance sheet into 03. Historical Actuals. The final month automatically sets the forecast’s opening clients, cash, receivables, payables, debt and equity.
Can I change the forecast start date?
Yes. Change the single Model Start Date in 02. Assumptions and every month, year header, hire date, funding event and price escalation across all 16 tabs updates automatically. No manual re-dating is needed.
Which currency does the model use?
The model is built in US dollars. Because all values are driven by inputs, you can enter figures in any currency and relabel the currency cell. The calculations work the same way.
Do I need advanced Excel skills to use it?
No. You only edit the blue-on-yellow input cells, mainly in 02. Assumptions. Black cells are formulas and green cells are links, so you always know what is safe to change. Every tab starts with a plain-English summary of what it contains.
What services and revenue streams are included?
Seven: monthly retainers, paid advertising campaign management, social media management, content creation (video, graphic design and copywriting), influencer marketing (management fees and commissions), consulting (strategy, audits and training) and performance-based fees. Five other income lines cover affiliate, sponsorship, platform, licensing and other service revenue.
My agency doesn’t offer all of these services. Is that a problem?
Not at all. Set the service mix to 0% for anything you don’t offer and the model simply excludes it. You can also reallocate the mix to match your actual client base.
Which social media platforms does the marketing funnel cover?
Facebook, Instagram, TikTok, LinkedIn, YouTube and X each have their own funnel with CPM, CTR, click-to-lead rate and organic reach. Pinterest, Google Search, Google Display and Microsoft Advertising spend are also included in the marketing budget.
How are CAC, ROAS and LTV calculated?
CAC is total marketing spend divided by new customers, with separate organic and paid CAC. ROAS is new-customer annual contract value divided by paid media spend. LTV is monthly revenue per customer × gross margin ÷ monthly churn. Every definition is written on the relevant tab.
How does the model separate Cost of Revenue from operating expenses?
Costs required to deliver client work sit in Cost of Revenue. These include client ad and test budgets, freelance delivery, influencer fees paid on client campaigns, content production, client-specific software and payment processing. Your own marketing, salaries, software, rent, accounting and other overheads sit in operating expenses, so gross margin is accurate.
Can I add or remove employees?
Yes. The headcount roster in 02. Assumptions lists each role with department, hire month, end month, FTE and salary. Change any value, or set FTE to zero, and salaries, taxes, benefits, recruitment costs, equipment capex and per-employee costs update automatically.
Does it include a balance sheet that actually balances?
Yes. The P&L, cash flow and balance sheet are fully connected, and the balance sheet balances every single month. The 16. Checks tab confirms this, along with cash, retained earnings, working capital and other tie-outs, and shows a clear PASS or REVIEW status.
Can I run different scenarios for investors or lenders?
Yes. 14. Scenario Analysis includes Base, Upside and Downside cases with seven adjustable levers: organic reach, conversion, pricing, churn, marketing spend, media costs and operating costs. Switch cases with one selector in 02. Assumptions.
Can I model fundraising and debt?
Yes. Enter an equity round, share issuance, term loan, other loan proceeds or an acquisition with an amount and month. The model handles debt repayments, interest, lease payments, dividends and share buybacks, and calculates cash runway and burn.
Does the model handle corporate tax?
Yes. Income tax is calculated monthly at your chosen rate, with tax losses carried forward to offset future profits. Taxes are paid quarterly in arrears through working capital, so the cash impact is realistic.
Is it suitable for a bank loan or investor pitch?
Yes. It follows the formatting conventions lenders and investors expect: colour-coded inputs, formulas and links; monthly detail with annual totals; three integrated financial statements; scenario analysis; and an audit checks tab. The Cover Dashboard gives a one-page summary ready for your pitch deck.
Will it work in Google Sheets or on a Mac?
The model is built for Microsoft Excel on Windows and Mac and uses standard functions only, with no macros. It should open in Google Sheets, but charts, conditional formatting and dropdowns may display differently, so Excel is recommended.
Are the example numbers real market data?
No. The pre-filled figures are illustrative examples so you can see the model working straight away. Replace them with your own pricing, budgets, conversion rates and costs to produce your forecast.
Key Assumptions and Drivers
To build the financial model, you need to define key assumptions and drivers:
Revenue Growth Rate: Based on market research, client acquisition targets, and pricing strategies.
Client Retention Rate: Percentage of clients retained annually.
Pricing Structure: Average revenue per client or project.
Expense Ratios: Percentage of revenue allocated to COGS and operating expenses.
Working Capital: Days sales outstanding (DSO) and days payable outstanding (DPO) to manage cash flow.
Capital Expenditures: Investments in assets to support growth.
Scenario and Financial Model Analysis
Include scenario analysis (e.g., best-case, base-case, worst-case) to assess how changes in key drivers (e.g., client acquisition rate, churn rate) impact the financials.
Social Media Marketing Financial Model
These financial models will help the SEO agency plan for growth, manage cash flow, and make informed business decisions. It can also be used to attract investors or secure financing.
Download Link On Next Page