
Sawmill Financial Model Template
The Sawmill Financial Model is a complete Excel financial model for lumber mills, timber processors and sawmill investors. It takes you from log procurement through sawing, drying, finishing and lumber sales to a fully integrated income statement, cash flow statement and balance sheet. The model is built for owners, CFOs, lenders and private equity buyers who need a bankable sawmill business plan. It includes 3 years of monthly historical data and a 10-year forecast, so you can see exactly how log costs, lumber prices and recovery rates drive profitability.
10 Year Financial Model for a Sawmill
This sawmill Excel template models the real operating drivers of a timber mill:
- log supply by species, grade and diameter
- sawline capacity, shifts and overall equipment effectiveness (OEE)
- lumber recovery rates, kiln throughput, planer yield and product grade mix
- by-product revenue from wood chips, sawdust, bark and shavings, plus biomass energy used in the kilns
Every cost is driven by volumes, rates and inflation indices: labor, electricity, maintenance, packaging, freight and overheads. The result is a lumber mill financial forecast you can trust for budgeting, due diligence and investment decisions.
Valuation and risk analysis are built in. The model calculates free cash flow, NPV, terminal value, project IRR, equity IRR, payback period and debt service coverage ratio (DSCR). Seven scenarios (Base, Upside, Downside, Severe Downside, Management, Budget and Latest Forecast) switch with a single cell. Sensitivity tables show EBITDA against lumber price, log cost, recovery rate and utilization. Break-even analysis, risk indicators and a dashboard with charts and model integrity checks make this sawmill financial projection model ready to present to banks, investors and boards.
Model Tabs
01. Cover Model Guide
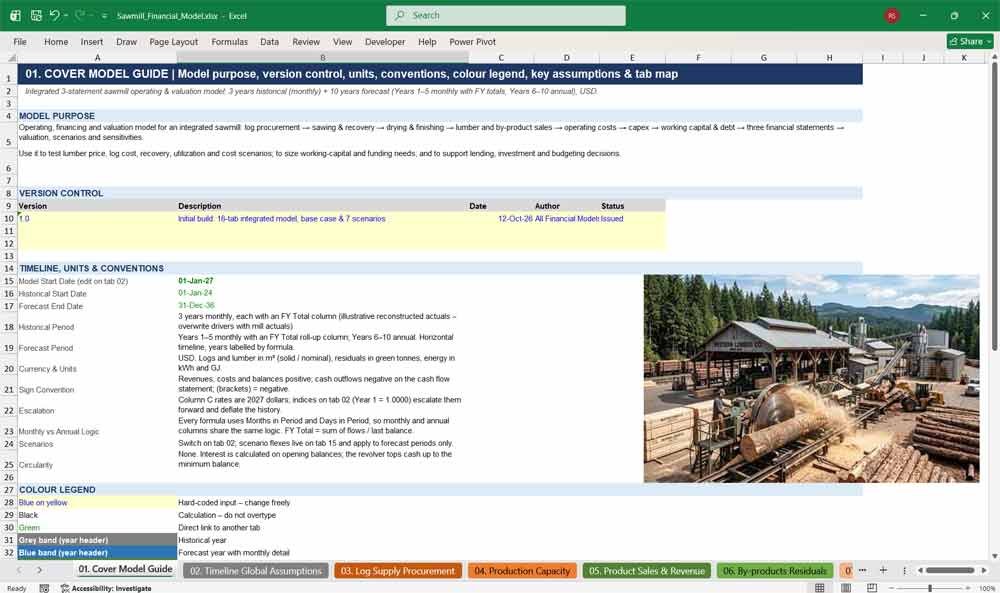
The cover tab explains the sawmill model’s purpose, version control, units, sign conventions and colour coding. Live key assumptions and a clickable tab map make the lumber mill financial model easy to navigate, audit and hand over to lenders or investors.
- Model purpose and version control table
- Units, conventions and circularity notes
- Colour legend for inputs, calculations and links
- Live key assumptions summary
- Hyperlinked tab map
02. Timeline Global Assumptions
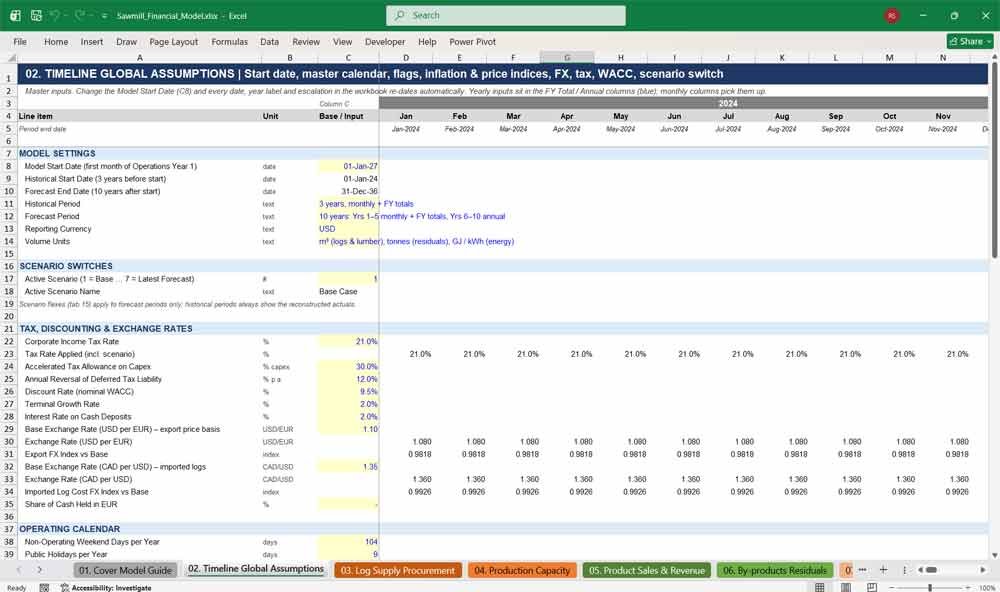
This master assumptions tab controls the whole sawmill forecast timeline. Change one start date and every date, year label and escalation updates automatically. It sets inflation, exchange rates, tax rates, discount rate (WACC), seasonality and the scenario switch for the model.
- Single Model Start Date drives the full timeline
- 3 historical years plus 10 forecast years
- Inflation, wage, energy, log and lumber price indices
- USD/EUR and CAD/USD exchange rates
- Tax rate, WACC and terminal growth inputs
- One-cell scenario switch
Sawmill Revenues & Costs
03. Log Supply Procurement
This tab models log procurement for the sawmill: volumes, inventory, price build-up and delivered log cost per m³. Log purchases follow production needs and supply limits, giving an accurate view of raw material cost, the largest driver of sawmill profitability.
- Log mix by type, sourcing route, species, quality grade and diameter
- Supplier categories and contracted supply coverage
- Log yard inventory, safety stock and unfulfilled demand
- Base log price with species, quality, diameter and seasonal premiums
- Delivered cost including harvesting, transport, duties and inspection
- Truck logistics, quality allowances and claims recoveries
04. Production Capacity
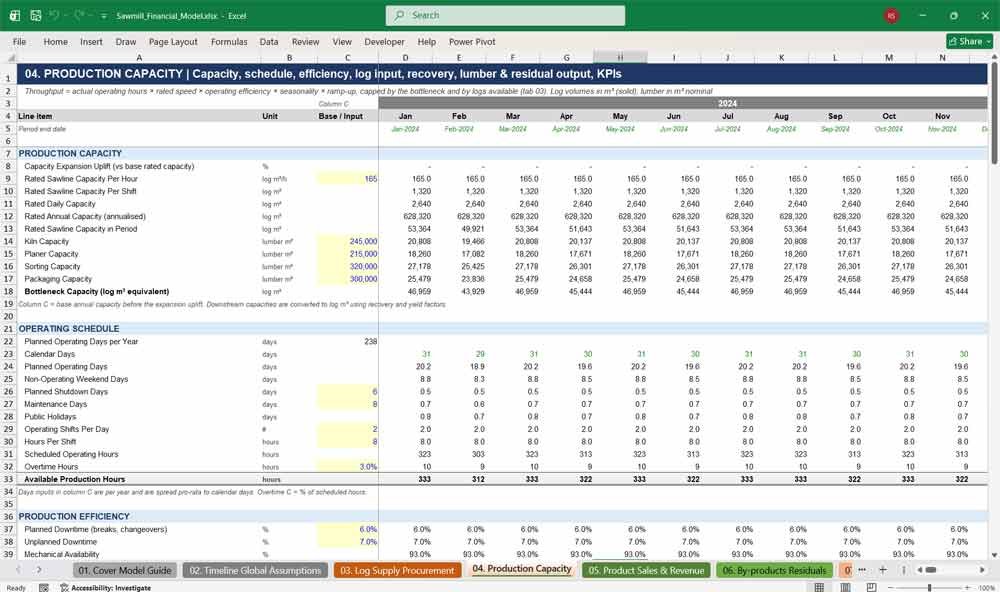
This sawmill production tab converts logs into lumber. Sawline capacity, operating schedule, downtime and OEE determine log input, while species, diameter and grade drive the lumber recovery rate. Kiln drying, planing, finishing yields and residual volumes complete a realistic production model.
- Rated sawline, kiln, planer, sorting and packaging capacity
- Bottleneck capacity and expansion uplift
- Shifts, operating days, overtime and maintenance days
- Downtime, mechanical availability and OEE
- Lumber recovery rate by species, diameter and grade
- Green, kiln-dried, planed and saleable lumber output
05. Product Sales & Revenue
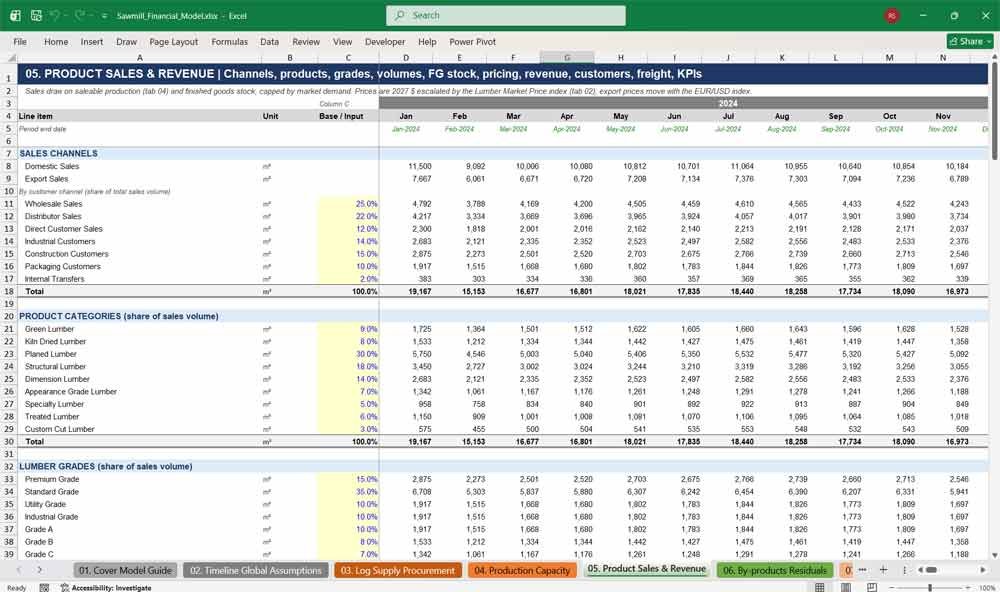
The lumber sales tab forecasts volumes, pricing and revenue by market, channel, product category and grade. Finished goods inventory, contract and spot pricing, export prices, discounts and rebates feed net lumber revenue, giving a clear view of sawmill revenue quality and customer risk.
- Domestic and export sales with seven customer channels
- Nine product categories and eight lumber grades
- Finished goods inventory and sales backlog
- Contract, spot, domestic and export selling prices
- Discounts, rebates, returns and net lumber revenue
- Freight and selling costs, plus price, volume and mix variance KPIs
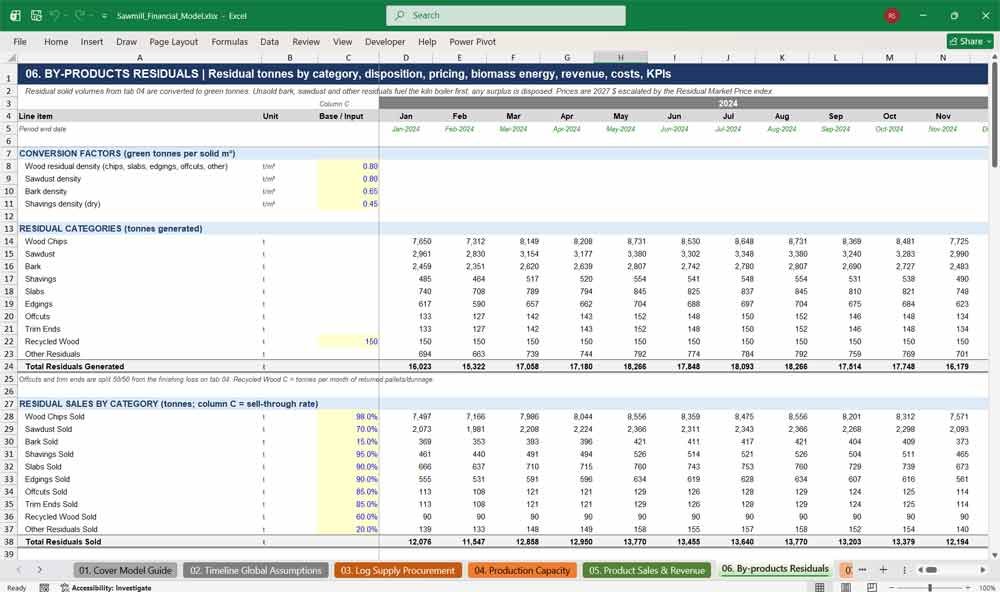
06. By-products Residuals
This tab turns sawmill residuals into revenue and energy. Wood chips, sawdust, bark, shavings, slabs, edgings and offcuts are converted to tonnes, priced and sold. Unsold bark and sawdust fuel the biomass boiler, reducing kiln gas costs and disposal.
- Ten residual categories in green tonnes
- Sell-through rates, inventory, disposal and losses
- Category pricing with moisture, quality and transport adjustments
- Biomass boiler fuel, thermal energy and gas cost savings
- Residual revenue and handling, grinding and disposal costs
- Residual revenue per log m³ and per lumber m³
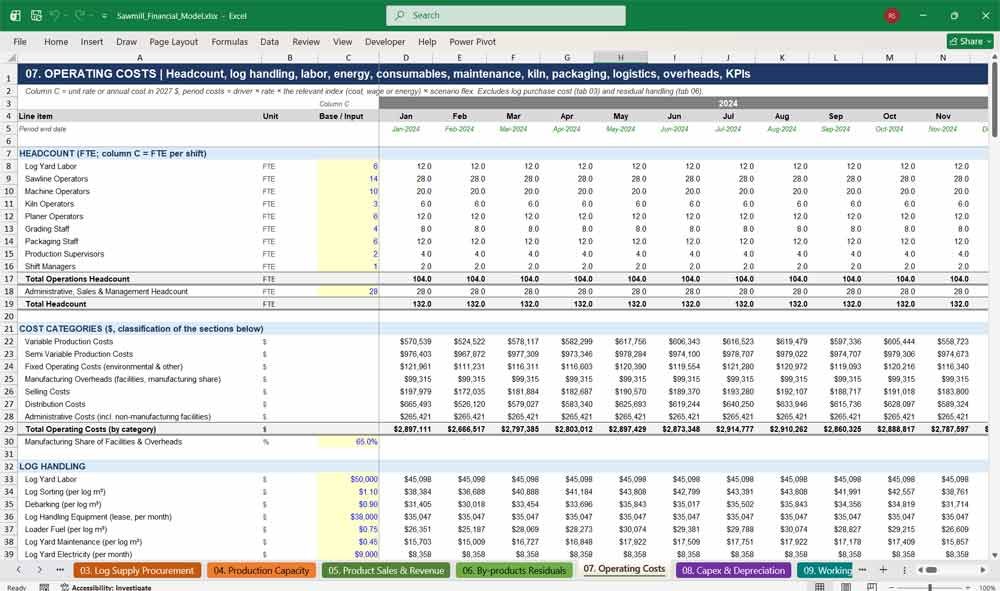
07. Operating Costs
This tab builds every sawmill operating cost from real drivers: headcount, log volumes, operating hours, kWh, m³ sold and annual budgets. Costs escalate with wage, energy and inflation indices. It gives a full conversion cost per m³ of lumber.
- Headcount by role and production labor costs
- Log handling, electricity, energy and consumables
- Maintenance, repairs, kiln and drying costs
- Finishing, packaging and outbound logistics
- Facilities, environmental compliance and administration
- Cost categories, cost drivers and cost per m³ KPIs
08. Capital Expenditure & Depreciation
The capex tab plans maintenance, replacement, productivity, expansion, building, vehicle and environmental investment. Expansion spend flows through construction in progress to kilns and sawline equipment, with straight-line depreciation by asset class and useful life.
- Yearly capex programme by category
- Construction in progress and commissioning date
- Asset register for 11 asset classes plus software
- Useful lives and straight-line depreciation
- Capital grants, disposals and impairment
- PP&E roll-forward check
Sawmill Financial Statements
09. Working Capital & Financing
This tab values log, WIP, green, kiln-dried and finished lumber inventory, and forecasts receivables, payables and accruals. It schedules the term loan, equipment financing, revolving credit facility, leases, equity contributions and dividends, with no circular references.
- Inventory valued at production cost per m³
- Receivable, payable and accrual days
- Term loan and equipment financing schedules
- Automatic revolver to protect minimum cash
- Leases, debt fees and deferred tax
- Equity contributions, shareholder loans and dividends
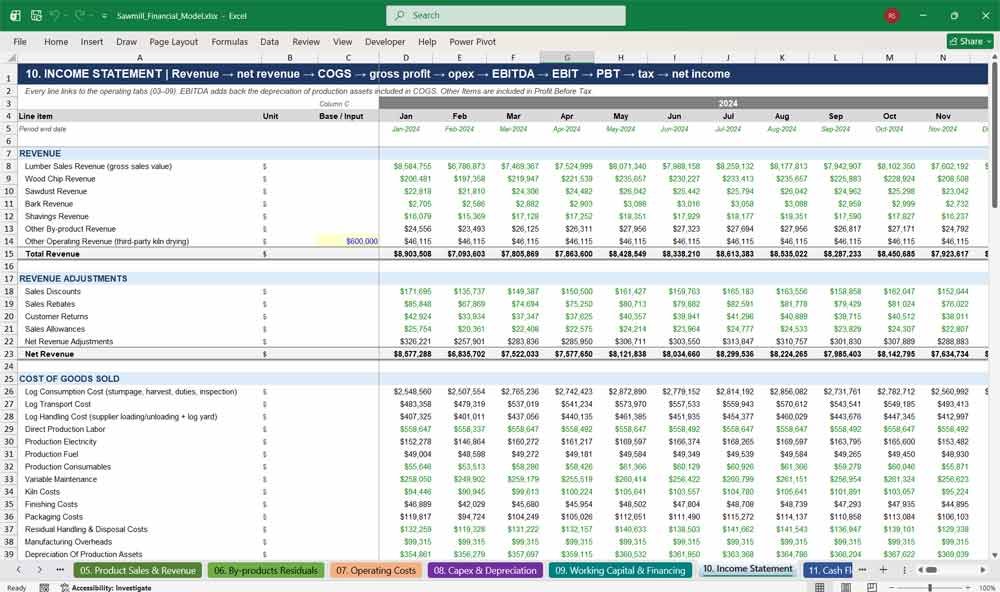
10. Income Statement
The sawmill income statement presents total revenue, revenue adjustments, cost of goods sold, gross profit, operating expenses, EBITDA, depreciation, operating profit, finance costs, tax and net income. Monthly and annual columns show profitability trends and margins clearly.
- Lumber and by-product revenue
- Detailed cost of goods sold by cost type
- Gross profit, EBITDA and operating profit
- Finance costs, current and deferred tax
- FX, disposals, impairments and other items
- Profitability KPIs and interest coverage
11. Cash Flow Runway
The cash flow tab uses the indirect method to reconcile profit to cash. It covers operating cash flow, capex, financing and revolver drawdowns, then measures liquidity runway, funding headroom, working capital peaks and debt service coverage for lenders and investors.
- Operating, investing and financing cash flows
- Working capital movements from the balance sheet
- Closing cash, minimum cash and restricted cash
- Months of cash runway and liquidity headroom
- Funding shortfall and undrawn facilities
- Free cash flow, net debt / EBITDA and DSCR
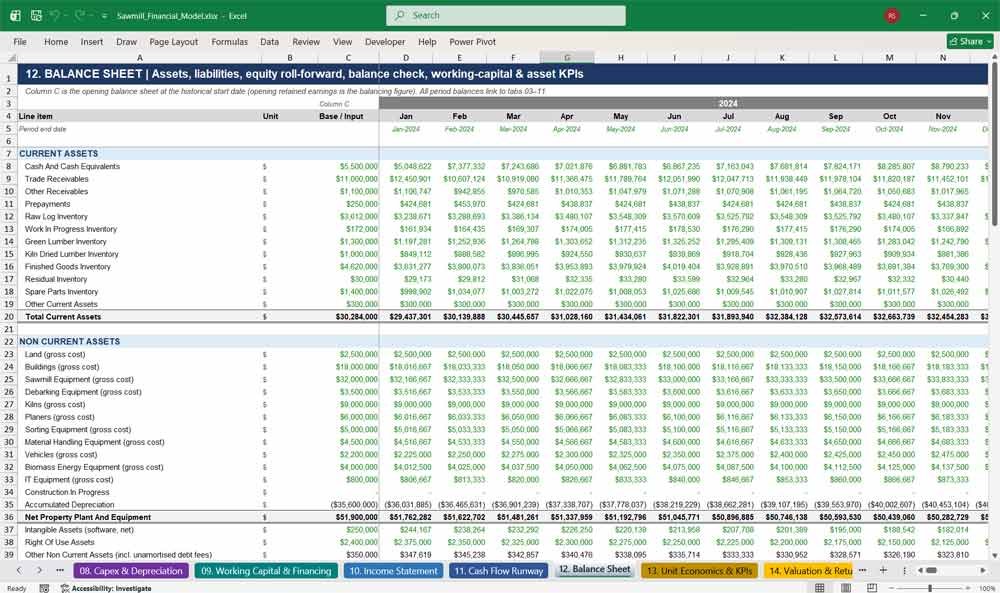
12. Balance Sheet
The fully balanced sawmill balance sheet links every asset, liability and equity line to the operating tabs. An opening balance sheet, equity roll-forward and balance check confirm integrity, while working capital and return ratios measure financial strength.
- Current and non-current assets by inventory and asset class
- Current and non-current liabilities
- Equity roll-forward with year-to-date earnings
- Balance sheet check every period
- Current ratio, quick ratio and cash conversion cycle
- ROA, ROE and ROCE
Key Financial Metrics for a Sawmill
13. Unit Economics & KPIs
This tab shows sawmill economics per m³ of lumber sold: revenue, log cost, labor, energy, maintenance, freight, cash cost and EBITDA per m³. Contribution margin and break-even volume and utilization reveal the true operating leverage.
- EBITDA per m³ of lumber
- Log cost and conversion cost per m³
- Contribution margin and margin %
- Break-even sales volume and utilization
- Margin of safety
- OEE, productivity and energy intensity
14. Valuation & Returns
The valuation tab discounts unlevered free cash flow at the WACC, adds a Gordon growth terminal value and calculates enterprise and equity value. Project IRR, equity IRR, payback period and DSCR headroom support acquisition, lending and investment decisions.
- Unlevered free cash flow build
- Mid-year discounting and NPV
- Terminal value and enterprise value
- Project and equity IRR and multiple of money
- Payback period
- Minimum and average DSCR versus covenant
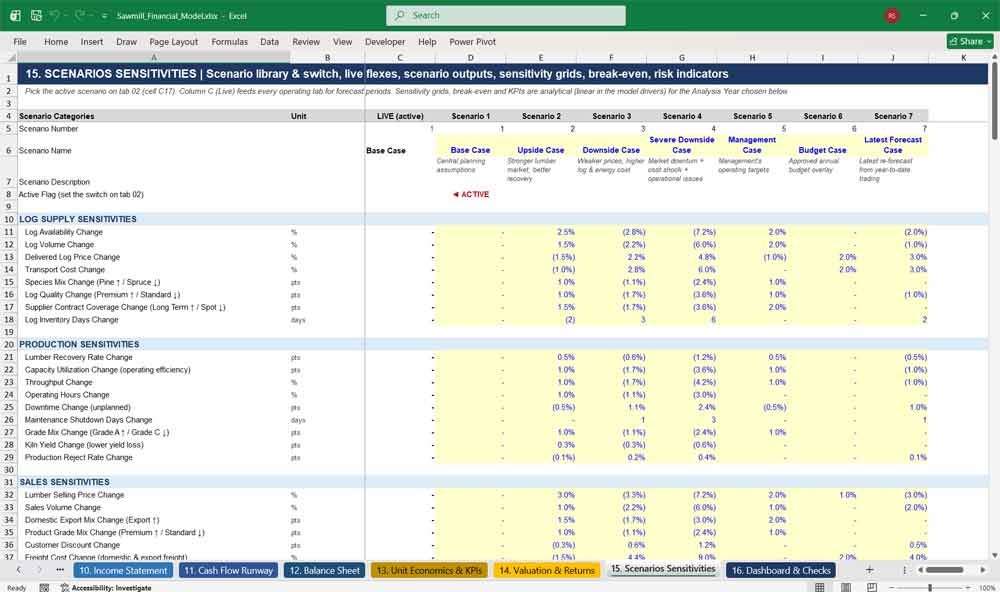
15. Scenarios Sensitivities
This tab stores seven sawmill scenarios across 42 drivers covering log supply, production, sales, costs and financing. Live scenario outputs, nine sensitivity tables, break-even analysis, risk indicators and sensitivity KPIs show how resilient the lumber mill business plan is.
- Seven scenarios switched from one cell
- 42 scenario drivers in five groups
- 10-year outputs for the active scenario
- Sensitivity tables for lumber price, log cost, recovery and utilization
- Break-even price, volume, log cost and recovery rate
- Risk indicators with OK / WATCH flags
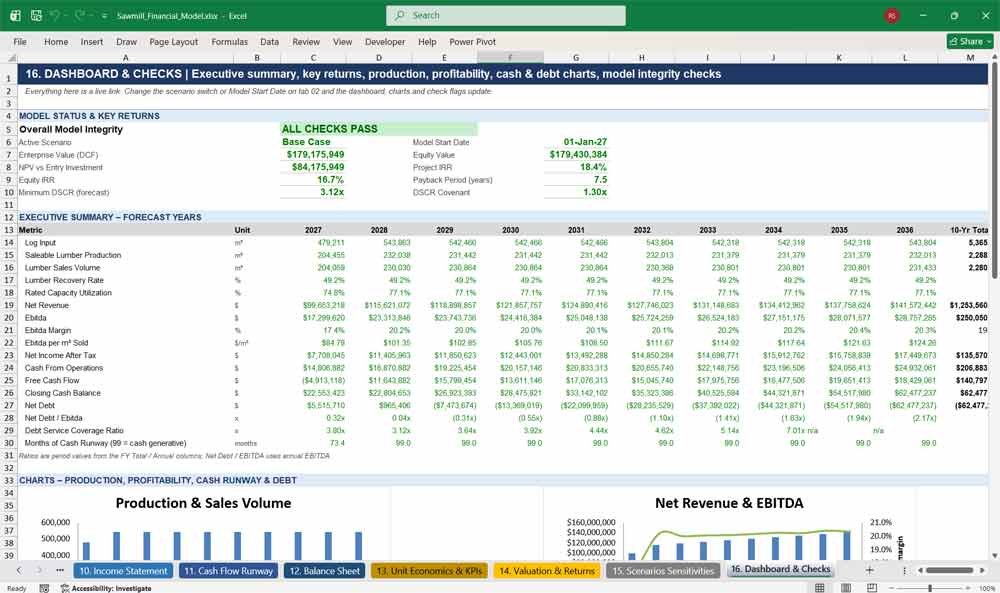
16. Dashboard & Checks
The executive dashboard summarises sawmill performance and returns on one page. Charts show production, revenue, EBITDA, cash runway and debt metrics. Model integrity checks flag PASS or REVIEW for every year, so you can share the model with confidence.
- Key returns: EV, NPV, IRR, payback and DSCR
- 10-year executive summary table
- Production, profitability, cash and debt charts
- 13 integrity checks by year
- Overall model status indicator
Why Buy This Sawmill Financial Model?
Building a reliable sawmill financial model from scratch takes weeks and demands deep knowledge of timber operations, lumber recovery and three-statement modelling. This model gives you that in a ready-to-use Excel file. It contains about 127,000 live formulas and zero hardcoded results, follows a lender-ready format with clear colour coding, and checks itself every period. The model balances, has no circular references, and re-dates itself when you change the start date. Whether you are raising debt, buying a timber mill, planning a kiln expansion or setting next year’s budget, you can replace the inputs with your own data and get credible forecasts, valuations and scenario analysis straight away.
Sawmill Frequently Asked Questions
Can I use this model for my own sawmill rather than a new project? Yes. The model is built for an operating sawmill with 3 years of history. Enter your own log mix, capacity, prices, costs and opening balance sheet, and the forecast, statements and valuation update automatically.
Is it suitable for a greenfield sawmill or a mill expansion?
Yes. The capex tab includes an expansion programme with construction in progress, commissioning date, capacity uplift and production ramp-up. You can scale these up to model a major expansion or a new-build mill.
Do I need advanced Excel skills to use it?
No. Inputs are blue on yellow, calculations are black and links are green. The cover tab explains how the model works, and most changes only involve typing new numbers into input cells.
Can I change the start date and the currency?
You can change the start date on tab 02 and every date and year label updates. The model reports in USD; if you use another currency, enter all inputs in that currency and the calculations work the same way.
Does the model handle different wood species and log grades?
Yes. Logs are split by nine species, seven quality grades and three diameter classes. Each has its own price premium and recovery factor, which together drive delivered log cost and the lumber recovery rate.
How are wood chips, sawdust and bark treated?
Residuals are converted to tonnes and either sold, burned in the biomass boiler to dry lumber, used internally or disposed of. The model calculates by-product revenue, handling costs and the gas savings from biomass energy.
Will a bank or investor accept this model?
The model follows the format lenders and investors expect: integrated three statements, a balancing balance sheet, a debt schedule, DSCR, cash runway, scenarios and visible integrity checks. These features make it suitable for loan applications and investor presentations.
Can I run downside and stress-test scenarios?
Yes. Seven scenarios switch from a single cell, covering 42 drivers such as lumber price, log cost, recovery, downtime, energy prices and interest rates. Sensitivity tables and break-even analysis show your margin of safety.
Does the model calculate IRR, NPV and payback?
Yes. The valuation tab calculates unlevered free cash flow, NPV at your discount rate, terminal value, enterprise and equity value, project and equity IRR, multiple of money and payback period.
Are there any macros or circular references?
No. The model contains no macros and no circular references. Interest is calculated on opening balances and a revolving credit facility automatically protects your minimum cash balance.
Can I edit or extend the model?
Yes. The model is fully unlocked, so you can add products, cost lines or tabs. A consistent row structure and clear colour coding make extending it straightforward.
What software do I need?
You need Microsoft Excel 2016 or later (including Microsoft 365) on Windows or Mac. The model also opens in LibreOffice.
Final Notes on the Financial Model
This 10 Year Sawmill Financial Model must focus on balancing capital expenditures with steady revenue growth from diversified services. By optimizing operational costs, and power efficiency, and maximizing high-margin services, the model ensures sustainable profitability and cash flow stability.