
SaaS Software Financial Model Template
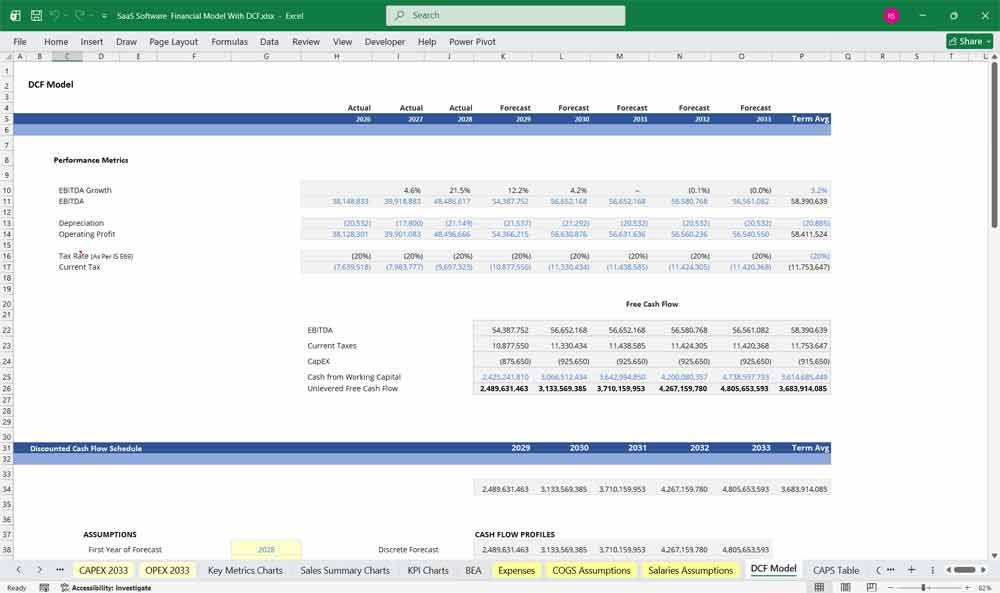
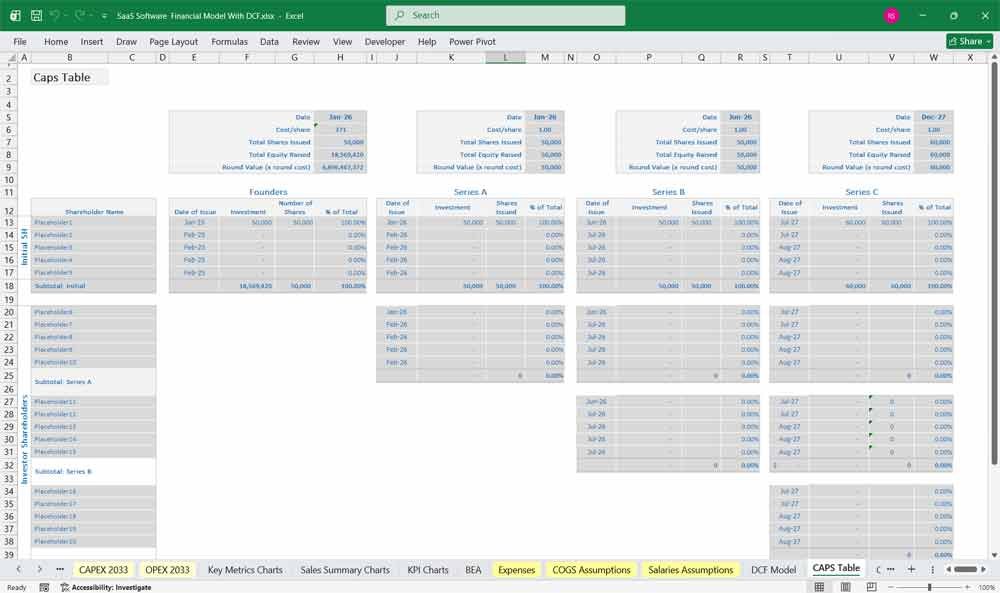
This 5-Year, 3-Statement SaaS Software Financial Model Template in Excel is a great tool for viewing all your revenues and projections from your SaaS Software development projects. Including Discounted Cash Flow (DCF) with Terminal Value, Sensitivity Analysis, WACC, NPV and IRR for quick evaluations.
Financial Model for A SaaS Software Developer
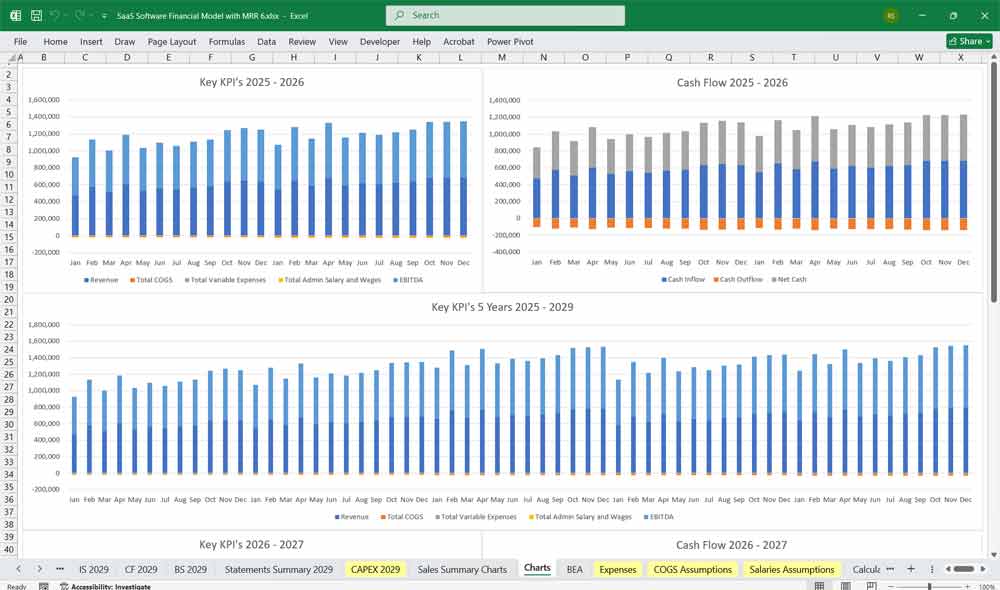
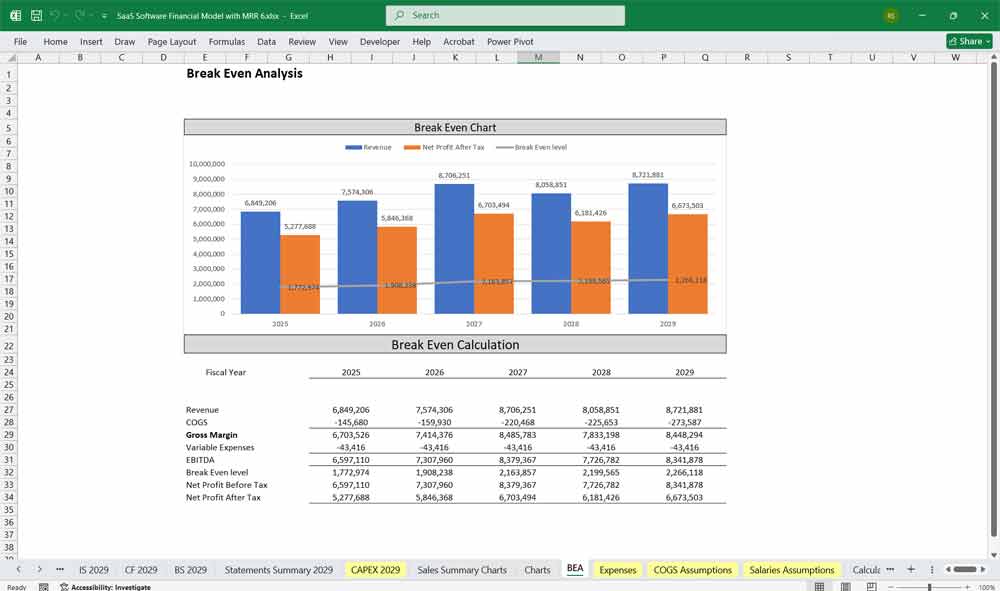
Robust financial model for a SaaS (Software-as-a-Service) company to forecast revenue, expenses, cash flow, and key metrics over a 5 year period. Below is a detailed breakdown of the Income Statement, Cash Flow Statement, and Balance Sheet, along with key SaaS-specific metrics.
Income Statement (Profit & Loss – P&L)
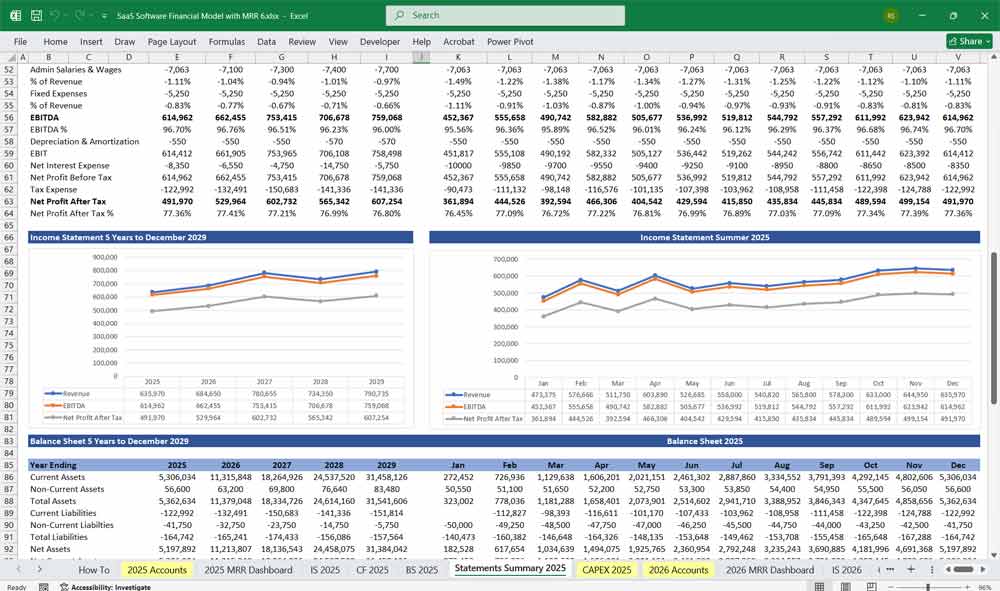
The Income Statement shows revenue, costs, and profitability over time.
Revenue
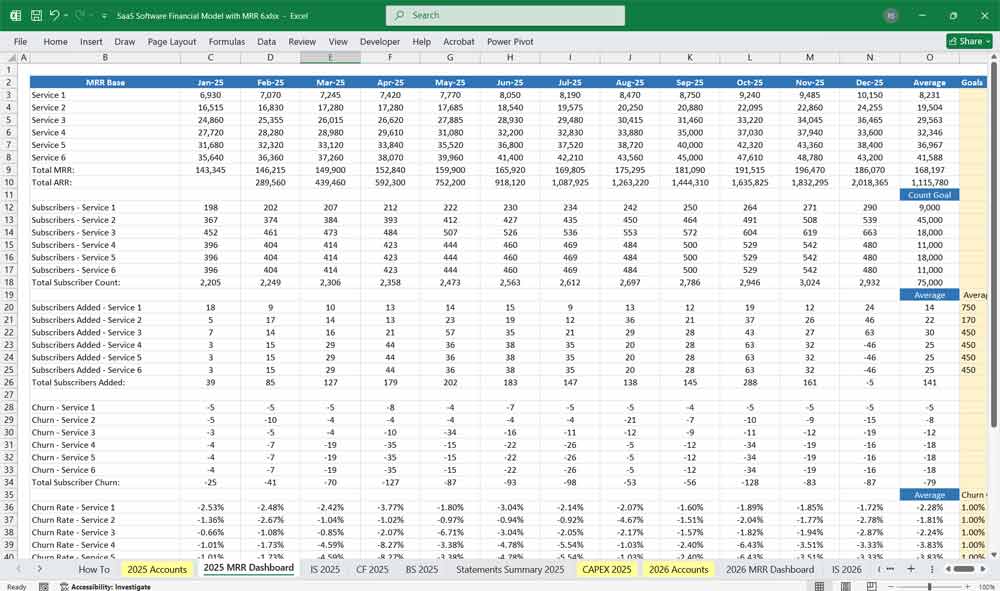
Monthly Recurring Revenue (MRR)
New MRR (from new customers)
Expansion MRR (upsells/cross-sells)
Churned MRR (lost revenue from cancellations/downgrades)
Net MRR Growth = (New MRR + Expansion MRR) – Churned MRR
Annual Recurring Revenue (ARR) = MRR × 12
One-Time Revenue (e.g., setup fees, professional services)
Editable PAYG Revenues
Paid Implementation & Onboarding
Premium Support & SLAs
- Custom Integrations & API Access
- Data Services & Analytics
- Strategy & Managed Services
- Enterprise Training
Cost of Revenue (COGS)
Hosting & Infrastructure (AWS, Azure, etc.)
Third-party software licenses
Payment processing fees (~2-3% of revenue)
Customer support & success teams
Gross Profit = Revenue – COGS
Gross Margin (%) = (Gross Profit / Revenue) × 100 (Target: 70-85%)
Operating Expenses (OPEX)
Sales & Marketing (S&M)
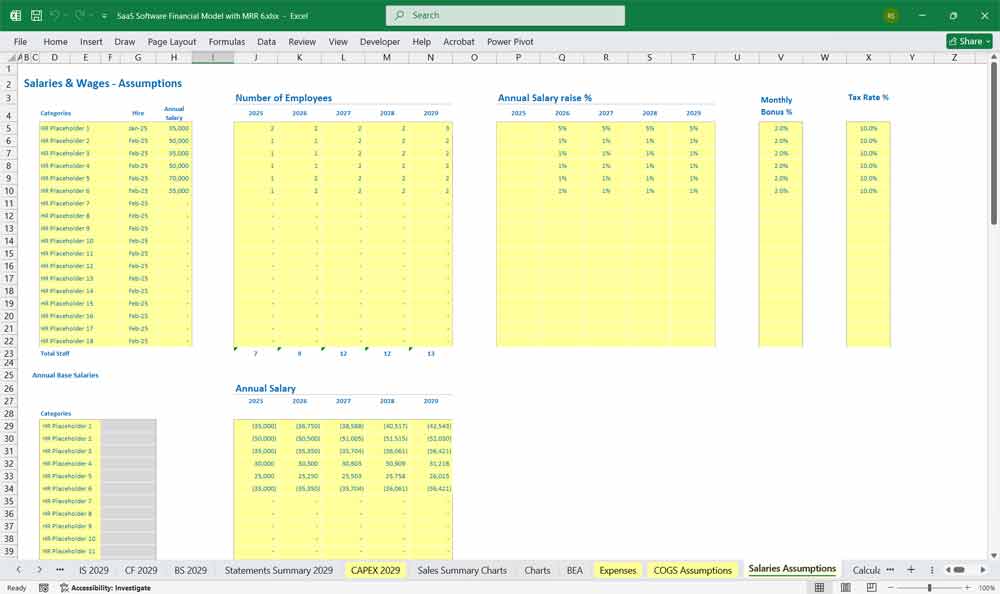
Salaries & commissions
Digital ads (Google, LinkedIn, etc.)
Content marketing & SEO
Events & partnerships
Research & Development (R&D)
Engineering salaries
Cloud & DevOps costs
Software tools (GitHub, Jira, etc.)
General & Administrative (G&A)
Executive salaries
Legal & accounting
Office rent & utilities
EBITDA & Net Profit
EBITDA = Gross Profit – OPEX (Earnings Before Interest, Taxes, Depreciation, Amortization)
Net Profit = EBITDA – Depreciation – Amortization – Taxes – Interest
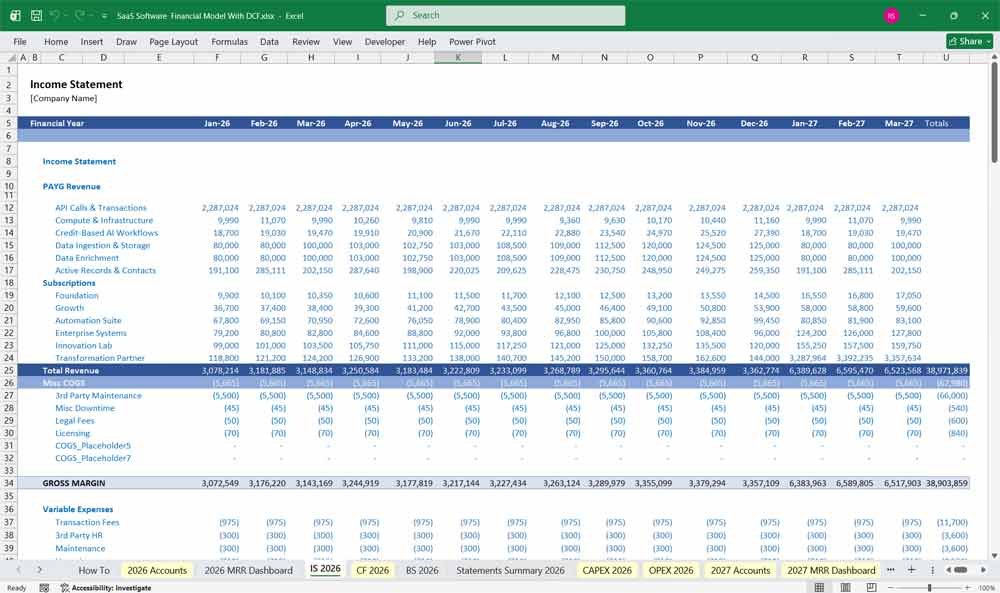
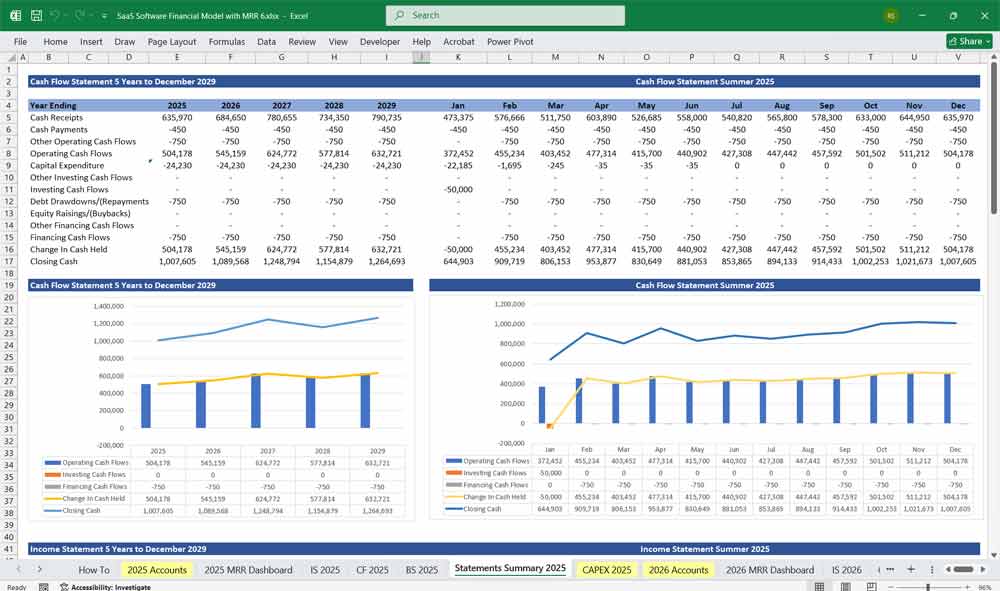
SaaS Software Cash Flow Statement
Tracks cash inflows and outflows to ensure liquidity.
Cash Flow from Operations (CFO)
Net Income (from P&L)
Adjustments:
(+) Depreciation & Amortization (non-cash expenses)
(-) Changes in Working Capital (accounts receivable, prepaid expenses)
Cash Flow from Investing (CFI)
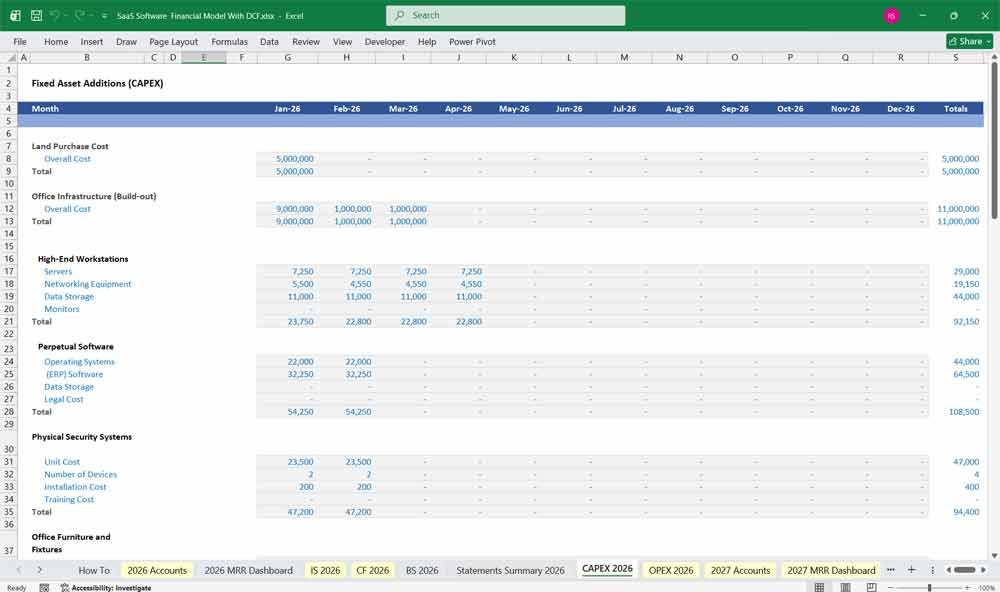
Capital Expenditures (CapEx) – servers, office equipment
SaaS development costs (if capitalized)
Cash Flow from Financing (CFF)
Equity raised (venture capital, angel investors)
Debt (loans, convertible notes)
Dividends or share buybacks (rare in early-stage SaaS)
Net Cash Flow = CFO + CFI + CFF
Ending Cash Balance = Beginning Cash + Net Cash Flow
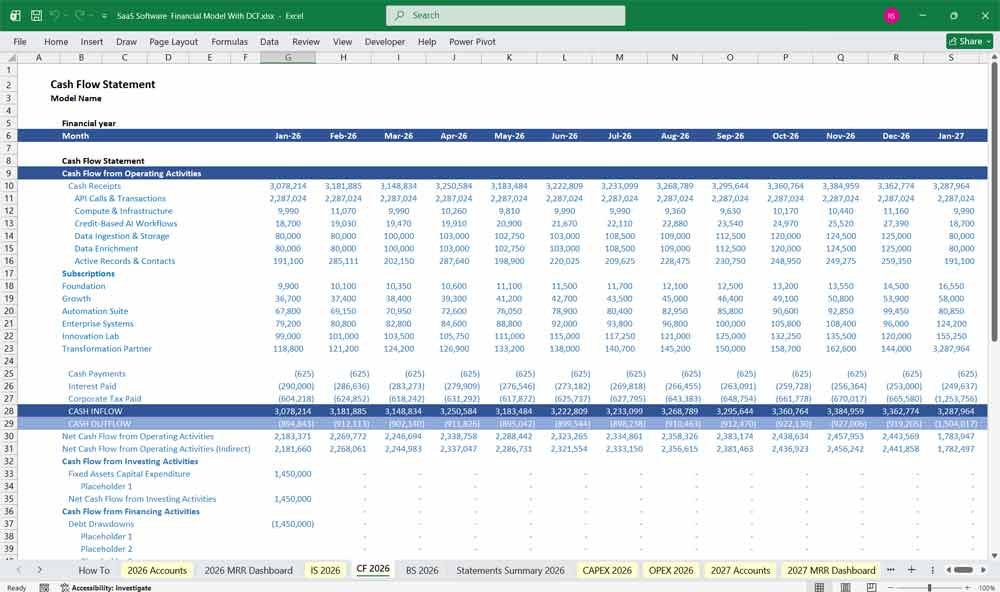
SaaS Software Balance Sheet
Shows assets, liabilities, and equity at a point in time.
Assets
Current Assets
Cash & cash equivalents
Accounts receivable (unpaid invoices)
Prepaid expenses
Long-Term Assets
Property & equipment (if any)
Capitalized software development costs
Liabilities
Current Liabilities
Accounts payable (unpaid bills)
Deferred revenue (unearned revenue from annual subscriptions)
Short-term debt
Long-Term Liabilities
Long-term debt
Lease obligations
Equity
Common stock
Retained earnings (accumulated profits)
Additional paid-in capital (investor funds)
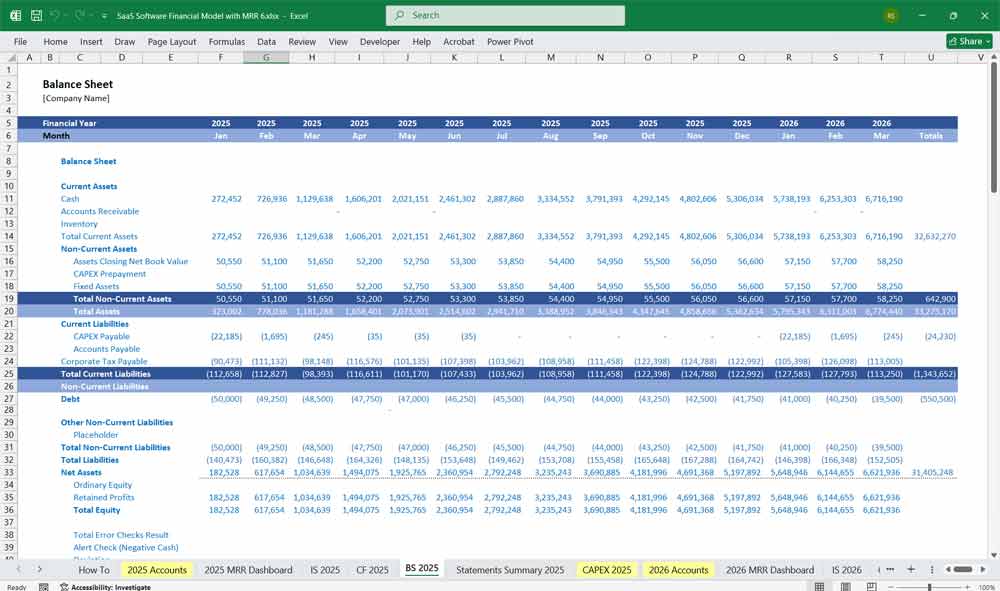
Key SaaS Metrics to Track
Customer Acquisition Cost (CAC) = Sales & Marketing Spend / New Customers Acquired
Lifetime Value (LTV) = (Avg. Revenue per User × Gross Margin %) / Churn Rate
LTV:CAC Ratio (Target: 3x or higher)
Churn Rate = (Churned Customers / Total Customers) × 100
Quick Ratio = (New MRR + Expansion MRR) / Churned MRR (Target: >4x)
6-Tier Subscription Model for a SaaS Company
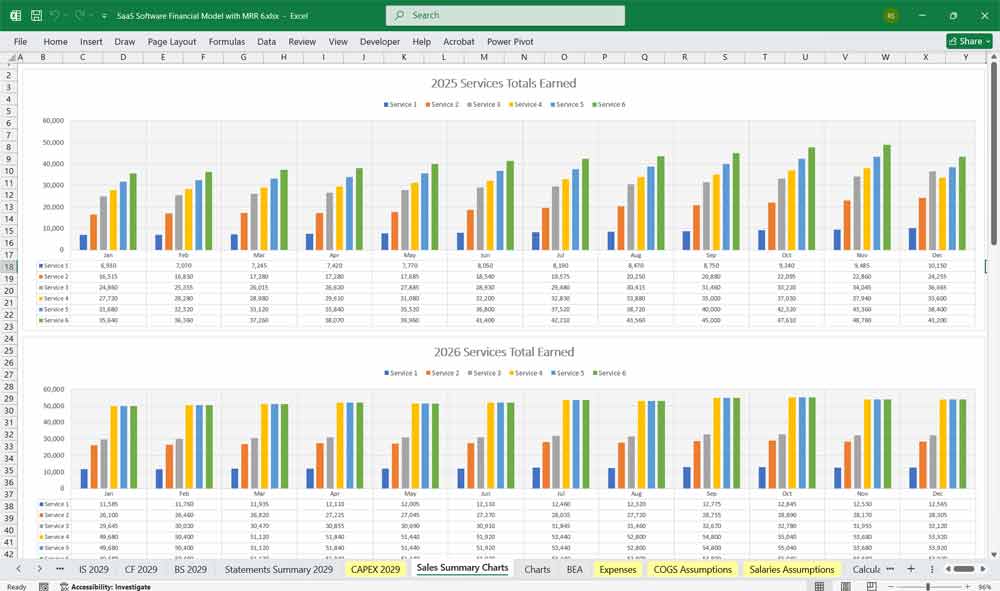
A well-structured 6-tier subscription model allows a SaaS company to cater to different customer segments, from small businesses to large enterprises, while maximizing revenue through upsells and cross-sells. Below is a detailed breakdown of six subscription tiers, including pricing, features, target audience, and key differentiators.
1. Free SaaS Tier (Freemium)
Target Audience: Startups, solopreneurs, small businesses testing the software.
Pricing: $0
Key Features:
Basic functionality with limited usage (e.g., 1 user, 10 GB storage).
Entry-level support (community forums, knowledge base).
Branded watermark on exports.
No API access.
Upsell Path: Conversion to “Starter” or “Pro” tiers via in-app prompts.
Monetization Strategy: Lead generation for paid tiers.
2. Starter SaaS Tier
Target Audience: Small businesses, freelancers needing essential features.
Pricing: 19–19–49/month (billed annually for discount).
Key Features:
All Free Tier features + ad-free experience.
1–5 users, 50 GB storage.
Basic analytics & reporting.
Email support (24–48 hour response).
Limited integrations (e.g., Zapier, Google Workspace).
Upsell Path: Highlight limitations (e.g., “Need more users? Upgrade to Pro!”).
Monetization Strategy: Low-cost entry point for SMBs.
3. Professional SaaS Tier (Most Popular)
Target Audience: Growing businesses, mid-sized teams.
Pricing: 99–99–199/month (annual billing preferred).
Key Features:
Everything in Starter + advanced features.
10–20 users, unlimited storage.
Custom reporting & dashboards.
Priority support (12–24 hour response).
API access (limited calls/month).
Single Sign-On (SSO) via Google/Microsoft.
Upsell Path: Push for “Business” tier with advanced security & compliance.
Monetization Strategy: Balances affordability with high perceived value.
4. Business SaaS Tier
Target Audience: Established companies needing scalability & security.
Pricing: 499–499–999/month (custom annual contracts).
Key Features:
All Professional features + enterprise-grade tools.
25–100 users, role-based permissions.
Advanced security (SAML, audit logs).
Dedicated account manager.
SLA guarantees (99.9% uptime).
White-labeling options.
Upsell Path: Custom “Enterprise” solutions for large deployments.
Monetization Strategy: High-margin tier with strong retention.
5. Enterprise SaaS Tier (Custom Pricing)
Target Audience: Large corporations, government agencies.
Pricing: $2,500+/month (negotiated contracts).
Key Features:
Everything in Business + fully customizable.
Unlimited users, on-premise/hybrid deployment.
24/7 VIP support with SLAs.
Custom integrations & workflows.
Compliance certifications (SOC 2, GDPR, HIPAA).
Training & onboarding services.
Upsell Path: Multi-year contracts, add-on professional services.
Monetization Strategy: High-touch sales, long-term revenue.
6. SaaS Partner/Reseller Tier
Target Audience: Agencies, consultants, white-label partners.
Pricing: Volume-based discounts (30–50% off retail).
Key Features:
All Enterprise features + reseller rights.
Co-branding & private labeling.
Revenue-sharing/affiliate programs.
API access for embedding into their products.
Dedicated partner support.
Upsell Path: Expand partnership with training & co-marketing.
Monetization Strategy: Expands market reach via third-party sales.
Key Considerations for a 6-Tier SaaS Model:
Clear Differentiation: Each tier should justify its price jump with tangible value.
Upsell Pathways: Use feature gating to encourage upgrades (e.g., “This report requires Pro”).
Churn Reduction: Offer annual discounts & tiered support to retain customers.
Pricing Testing: Continuously A/B test pricing pages for optimal conversion.
SaaS (Software as a Service) Development
Professional project management significantly impacts a financial model by shifting traditional capital expenditures (CapEx) to operational expenditures (OpEx). Unlike on-premise solutions, SaaS software development requires ongoing cloud infrastructure costs, subscription-based revenue recognition, and continuous updates, affecting cash flow projections and profitability timelines. Efficient project management ensures timely releases, scalability, and customer retention—key drivers of recurring revenue. Metrics like Customer Acquisition Cost (CAC), Lifetime Value (LTV), and churn rate become critical in forecasting growth and sustainability. The pay-as-you-go SaaS model also demands flexible budgeting for R&D, customer support, and scaling infrastructure, altering long-term financial planning compared to traditional software sales.
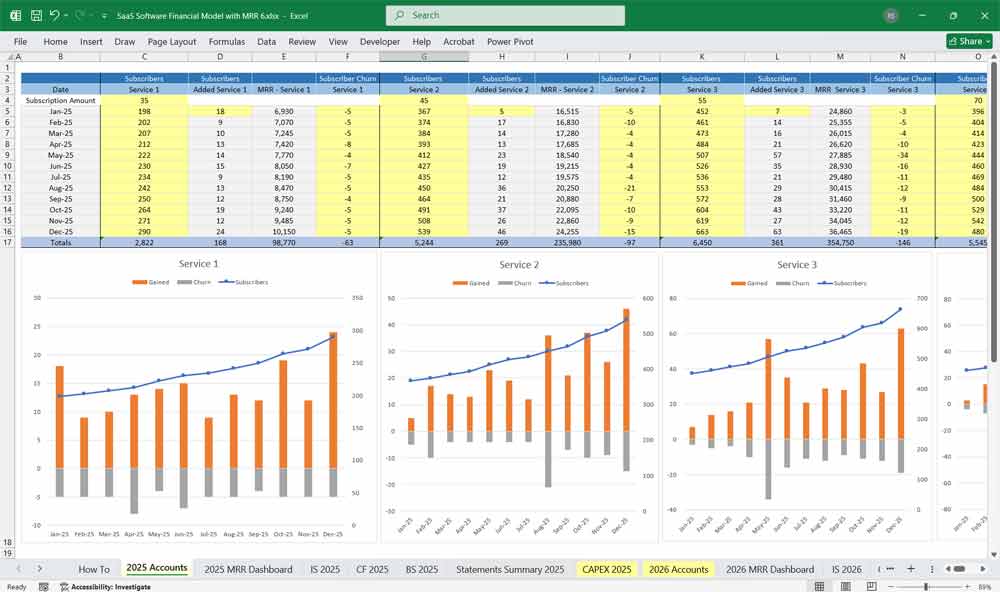

Value Your SaaS Software Company With A DCF
Discounted Cash Flow (DCF): Valuing a Rapidly Scaling Digital Engine
This 5-year Discounted Cash Flow (DCF) analysis for a SaaS software company, the valuation focuses on a compressed, high-growth horizon where customer compounding and operational leverage take center stage. The model projects cash flows driven by monthly and annual recurring revenue (MRR/ARR), offset not by traditional physical factory CapEx, but by front-loaded Customer Acquisition Costs (CAC) and engineering salaries. Because cloud software infrastructure scales with minimal incremental cost, the model assumes exceptionally high gross margins (often 80%+) once the product achieves product-market fit. Given the rapid pace of tech disruption, a 5-year timeframe is standard; consequently, the Terminal Value in Year 5 carries massive weight, heavily reflecting the assumed long-term Net Revenue Retention (NRR) rate and the lifetime value of the subscriber base.
WACC: Pricing Intangible Assets and “Platform Inertia”
The Weighted Average Cost of Capital (WACC) for a SaaS company typically sits in a range of 10% to 14% for established players, though it can climb much higher for early-stage startups. Because software firms rarely own physical collateral like real estate or heavy machinery, they cannot easily tap cheap, senior bank debt, resulting in a capital structure funded predominantly by equity. The Cost of Equity must price in a distinct “Platform Inertia and AI Disruption Beta.” In the 2026 tech landscape, investors demand a higher hurdle rate to account for the risk that corporate clients will rapidly consolidate their software vendor budgets or that a new open-source artificial intelligence tool will render the company’s core platform obsolete.
Sensitivity Analysis: Stress-Testing the “LTV-to-CAC” Efficiency
For a SaaS company, Sensitivity Analysis is the primary tool used to distinguish a highly efficient software machine from a cash-burning marketing furnace. Financial analysts use sensitivity tables to model how a 15% drop in Average Revenue Per User (ARPU) or an expansion in the CAC Payback Period impacts the company’s 5-year free cash flow trajectory. The most critical, industry-specific variables to cross-reference are Logo Churn % and Customer Acquisition Cost. If customer acquisition costs spike due to crowded marketing channels while annual churn rises by just 2%, the customer Lifetime Value (LTV) collapses, causing the valuation to crater. This matrix reveals exactly how much pricing pressure the software can handle before its growth efficiency breaks down.
Final Notes on the Financial Model
This 5-Year SaaS Software Financial Model must focus on balancing capital expenditures with steady revenue growth from diversified subscription-based services. By optimizing operational and service costs, and maximizing high-margin services like Project Management, HR, and CMS, the model aids profitability and cash flow stability.
Download Link On Next Page