
Synthetic Rubber DCF Financial Model Template
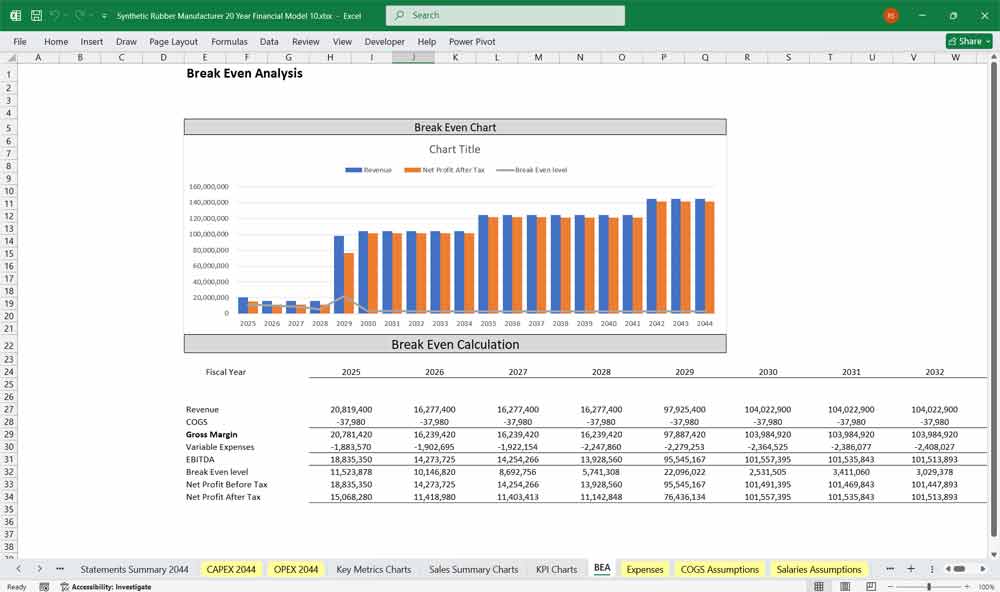
This 20 Year Synthetic Rubber DCF Financial Model Template is a comprehensive financial planning tool designed to help your company, investors, and analysts evaluate the financial feasibility and profitability of your company. Includes Discounted Cash Flow (DCF) with Terminal Value, Sensitivity Analysis, WACC, NPV and IRR.
Financial Model for a Synthetic Rubber Manufacturer
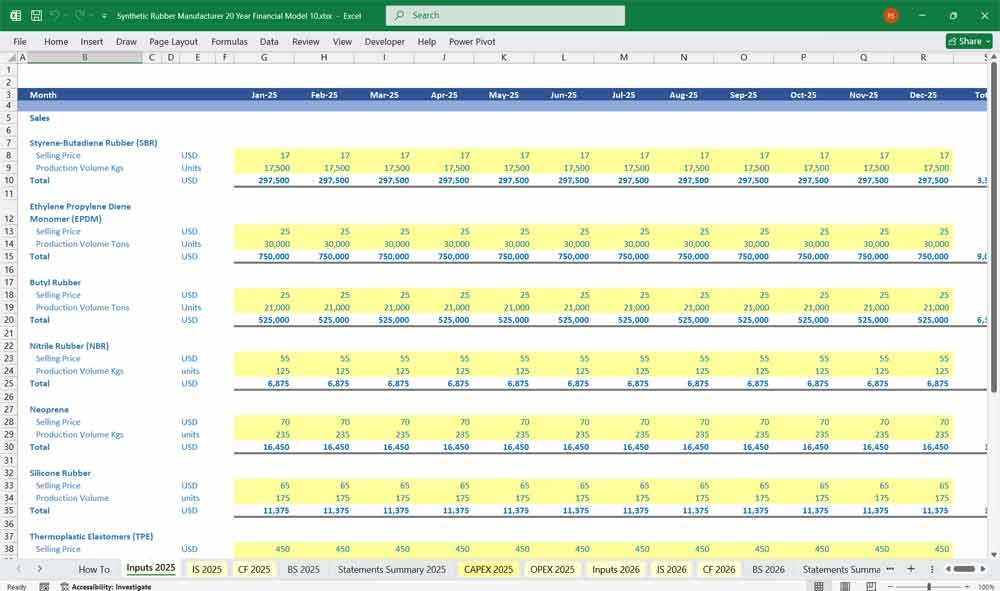
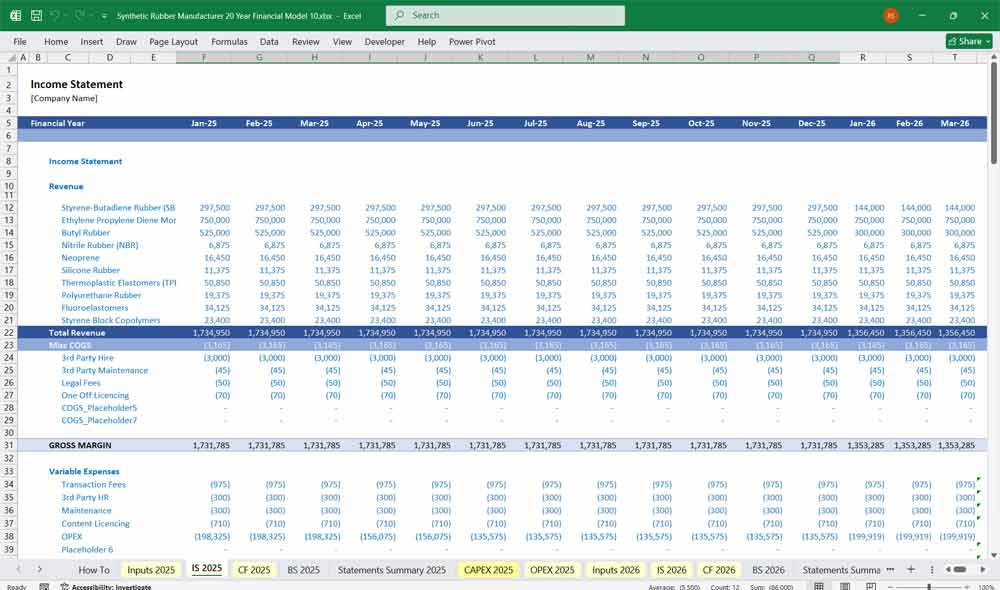
Income Statement
Revenue
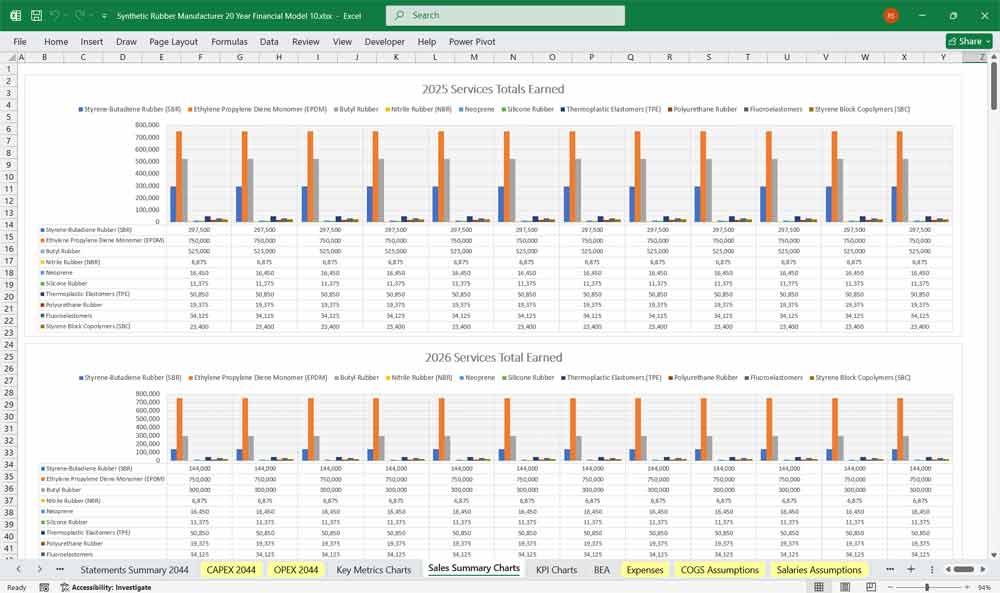
Revenue is segmented by rubber type and contract type (spot vs. long-term take-or-pay). Editable product examples within the model.
Styrene-Butadiene Rubber (SBR) : Largest volume (40% of sales). Priced as a premium over butadiene and styrene feedstock indices. Sold primarily to tire manufacturers (passenger and truck tires). Volume correlates with auto OEM schedules.
Ethylene Propylene Diene Monomer (EPDM) : 20% of sales. Used in automotive weather stripping, roofing membranes, and wire insulation. Priced on a per-ton basis with a floor price clause. Higher margin than SBR due to specialty curing systems.
Butyl Rubber : 10% of sales. Dominant in inner liners for tubeless tires and pharmaceutical stoppers. Long-term contracts with tire majors; also sold to medical seal producers at premium.
Neoprene (CR – Chloroprene Rubber) : 8% of sales. Used in cable jackets, adhesive tapes, and industrial belts. Price sensitive to chloroprene monomer availability.
Nitrile Rubber (NBR) : 10% of sales. Key in fuel hoses, gaskets, and oil-resistant seals. Priced with a surcharge for high-acrylonitrile grades.
Silicone Rubber : 7% of sales. Premium-priced (3x standard rubber). Sold to medical, aerospace, and electronics markets. Long sales cycle but stable margins.
Thermoplastic Elastomers (TPE) : 5% of sales. Combines rubber-like properties with plastic processing. Recyclable. Sold to consumer goods (toothbrush handles, shoe soles) and overmolded parts.
Cost of Goods Sold (COGS)
Feedstocks (55% of revenue): Butadiene, styrene, ethylene, propylene, chloroprene, acrylonitrile, and silicone base polymers. Model includes a 3-month lag for feedstock price pass-through to SBR and NBR, but not for EPDM or Silicone (fixed quarterly pricing).
Energy & Utilities (10% of revenue): Steam, electricity, and cooling water. High for polymerization reactors (exothermic reactions) and drying lines.
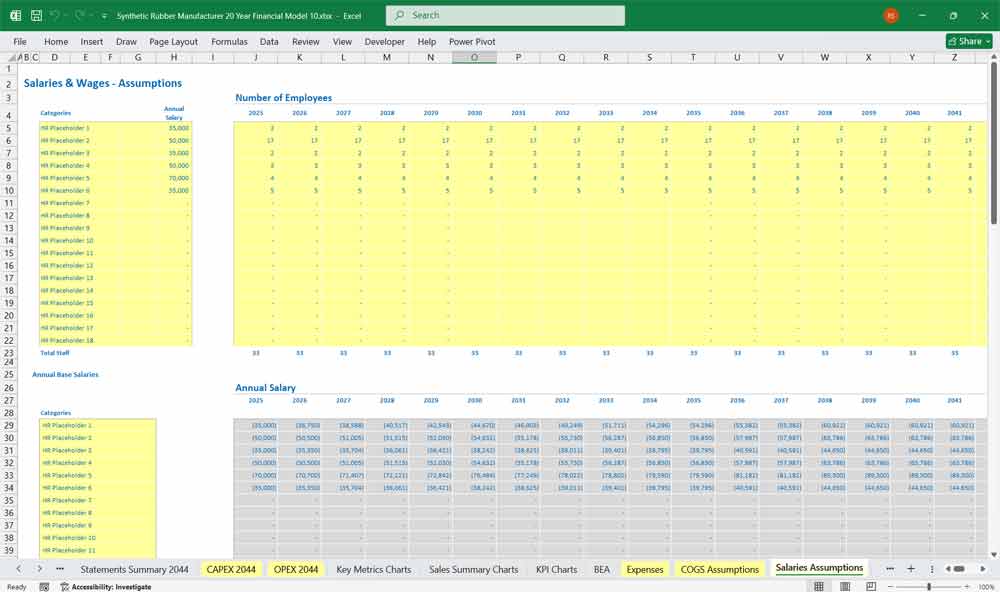
Direct Labor (8% of revenue): Shift operators for continuous polymerization, compounding, and curing areas.
Catalysts & Chemicals (5% of revenue): Ziegler-Natta catalysts for EPDM, peroxides for silicone, and sulfur-based curing systems for general rubber.
Packaging & Logistics (7% of revenue): Bale wrapping (polyethylene film), wooden pallets, and climate-controlled storage for butyl and silicone (moisture-sensitive).
Depreciation – COGS (5% of revenue): Allocated to production equipment (reactors, mixers, vulcanizers, testing labs).
Operating Expenses
Quality Control & R&D (4% of revenue): Running the testing laboratory (Mooney viscosity, tensile strength, cure rheometry, GC/MS for residual monomers). Includes cost of test samples and certification audits (ISO, TS 16949 for auto).
Sales & Marketing (3% of revenue): Technical sales engineers supporting tire and automotive customers; trade show participation.
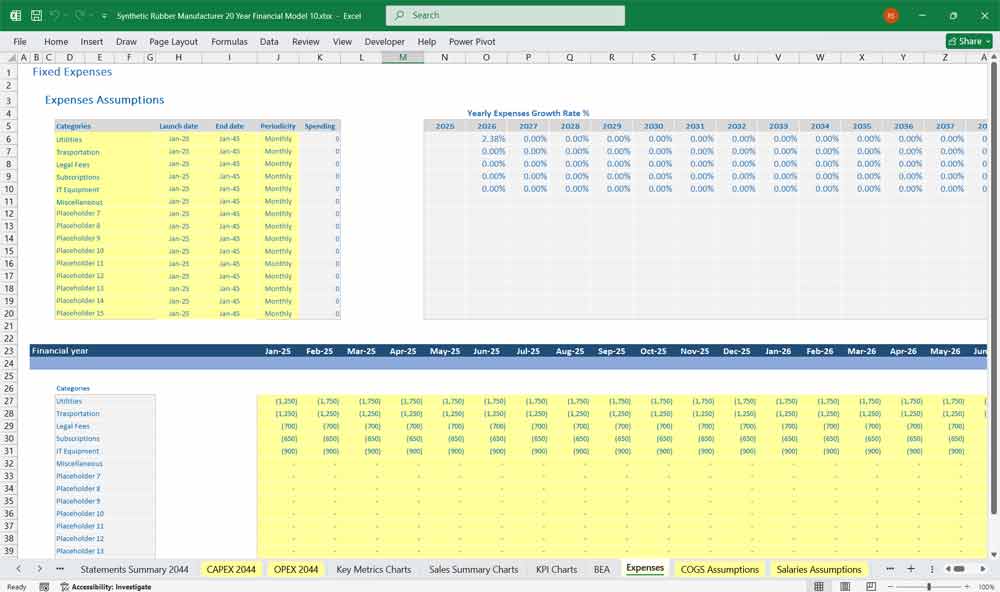
General & Administrative (6% of revenue): Environmental compliance (EPA/REACH reporting for residual VOCs), safety management (hazardous area classification), and logistics planning.
Maintenance (4% of revenue): Higher for polymerization reactors (cleaning to prevent fouling) and specialized mixing equipment (rotor and chamber wear).
Other Income/Expense
Byproduct sales (carbon black equivalents, recovered solvents).
Environmental remediation accruals for historical plant sites.
Net Income
Pre-tax margin typically 10-14% for commodity rubber (SBR, Butyl) and 18-22% for specialty (Silicone, TPE, Neoprene).
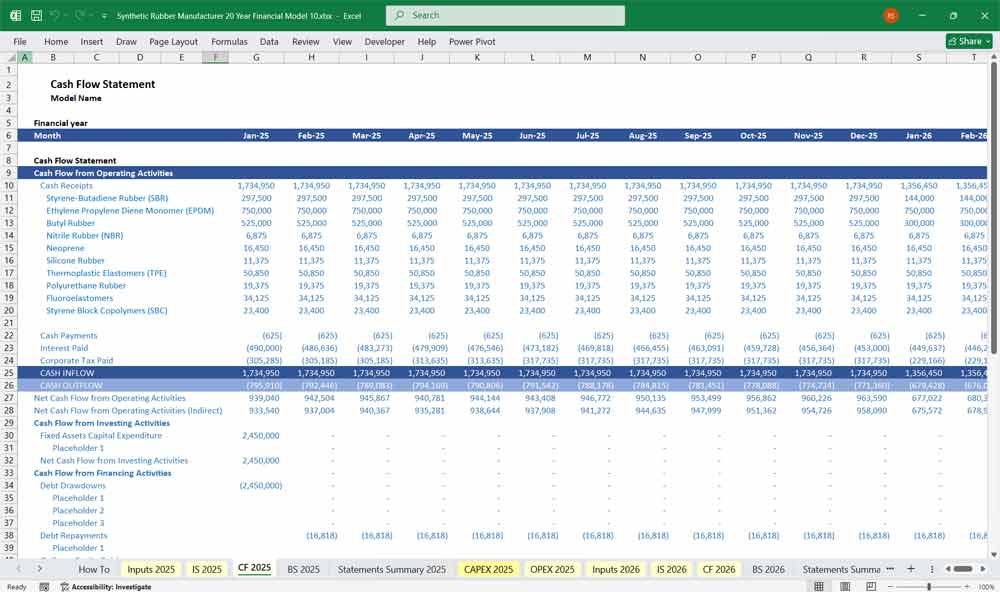
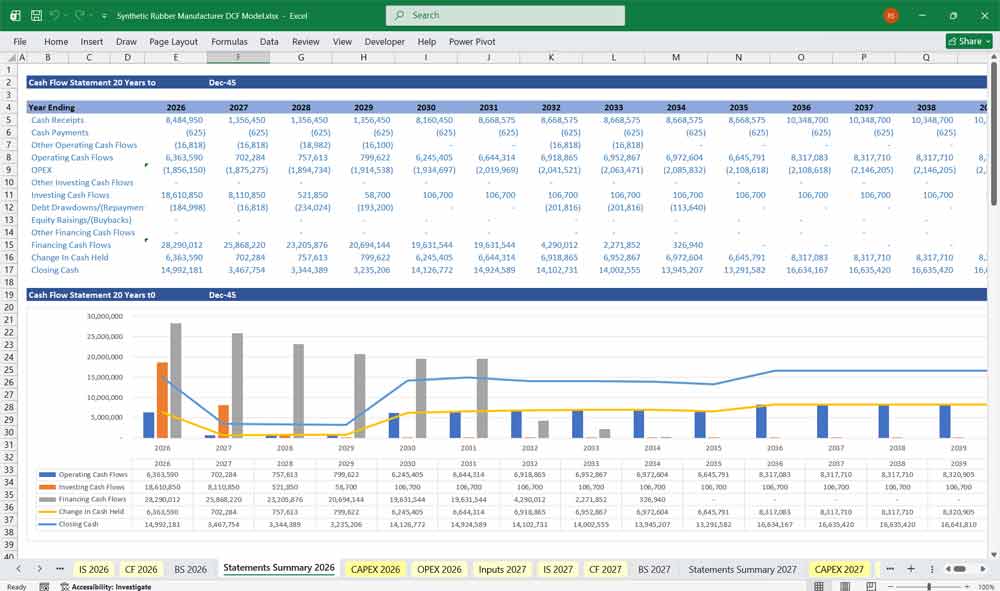
Synthetic Rubber Manufacturer Cash Flow Statement
Operating Cash Flow
Net income adjusted for non-cash items (depreciation, amortization of catalyst prepayments).
Working capital changes: High due to 45-60 day feedstock payment terms but 30-45 day receivables from tire OEMs (large but slow payers). Model assumes an inventory buffer of 25 days of sales (raw monomers + finished bales).
Volumetric trigger: If SBR sales drop below 70% of capacity, cash flow turns negative due to high fixed costs (reactor steam and minimum labor shifts).
Investing Cash Flow
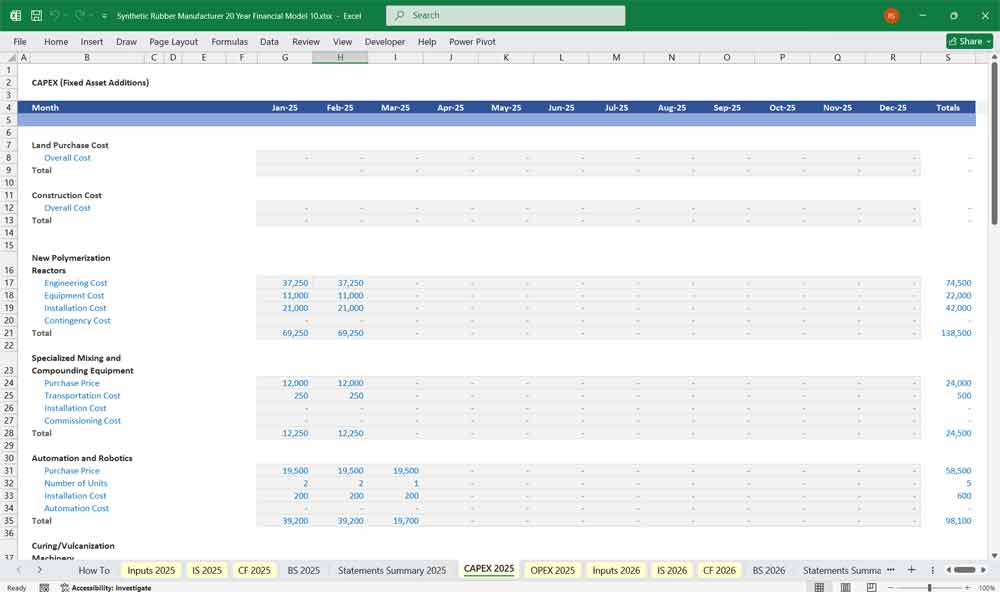
CAPEX expenditure detailed below. All CAPEX is assumed as cash outlay (no vendor financing) with a 5-month construction lag for new reactors.
Proceeds from sale of obsolete mixing lines.
Financing Cash Flow
Revolver drawdowns when working capital spikes (e.g., ahead of winter peak for EPDM roofing demand).
Term loans for polymerization reactors (7-year, 5% interest).
Dividends restricted if debt leverage > 3x EBITDA.
Free Cash Flow to Firm
Calculated after CAPEX but before debt service. Typically negative in years of major reactor or testing lab investment; positive in mature years.
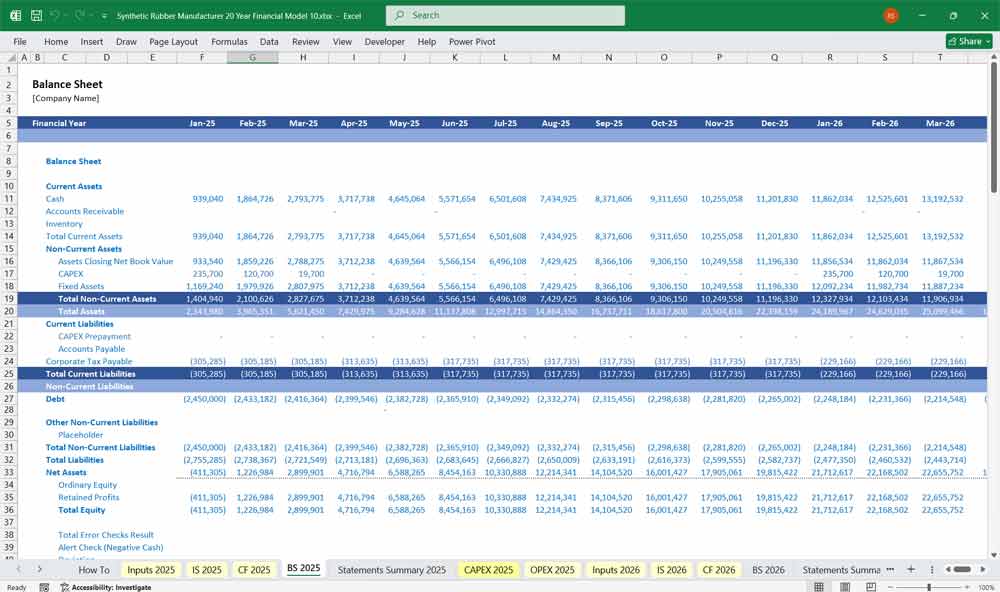
Synthetic Rubber Manufacturer Balance Sheet
Assets
Cash: Minimum cash balance equal to 15 days of COGS to cover payroll and utility bills.
Accounts Receivable: Tiered by customer: Tire majors (60 days), Industrial (45 days), Medical/Aero (30 days). Bad debt provision 0.5% for NBR and Neoprene (higher credit risk customers).
Inventory: Raw monomers (stored in spherical tanks, valued at LIFO due to price volatility), work-in-process (polymerization in reactors, compounding in mixers), finished bales. Model includes obsolescence for cured rubber beyond 6 months.
Property, Plant & Equipment (PP&E) : Carried at cost less straight-line depreciation. Equipment lives: Polymerization reactors (20 years), Mixing/compounding (15 years), Curing/vulcanization presses (12 years), Quality control labs (10 years, computer-heavy).
Liabilities
Accounts Payable: Feedstock suppliers (60 days – negotiate due to large volumes), energy bills (30 days), lab chemicals (45 days).
Accrued Liabilities: Environmental monitoring accruals, employee safety bonuses, and take-or-pay contract penalties (if off-take volume falls below minimum).
Debt: Term loan for reactors; revolver for working capital.
Equity
Retained earnings – model assumes no share buybacks but allows for equity issuance to fund major CAPEX if debt capacity is full.
Additional paid-in capital – if parent company injects funds for new TPE production line.
Key Assumptions For A Synthetic Rubber Manufacturer:
These assumptions drive the financial model. They’re based on industry norms, historical performance, and market conditions.
Revenue Assumptions:
- Annual Sales Growth: 5%–10% (based on market demand and capacity)
- Product Mix: % of Rubber vs. Plastic product sales
- Pricing Strategy: Annual price increase due to inflation or value addition
Cost Assumptions:
- Raw Material Costs: 40%–60% of revenue, depending on product complexity
- Direct Labor Costs: 15%–20% of revenue
- Manufacturing Overheads: 10%–15% of revenue
- Depreciation Rate: 5%–10% annually on PPE
Operating Expense Assumptions:
- SG&A Expenses: 10%–15% of revenue
- Marketing Expenses: 2%–5% of revenue
- R&D Expenses: 1%–3% of revenue
Working Capital Assumptions:
- Accounts Receivable Days: 45–60 days
- Inventory Turnover: 4–6 times per year
- Accounts Payable Days: 30–45 days
Financing Assumptions:
- Interest Rate on Debt: 5%–8% annually
- Dividend Payout Ratio: 20%–40% of net income
Tax Assumptions:
- Corporate Tax Rate: 20%–30%
When structuring product lines for a synthetic rubber manufacturer, it’s important to organize them in a way that aligns with customer needs, market demand, and operational efficiency.
CAPEX Expenditure Examples
The model includes a 20-year CAPEX plan with distinct categories, some of which:
New Polymerization Reactors (40% of CAPEX)
Stainless steel continuous stirred-tank reactors (CSTR) for SBR and NBR (emulsion polymerization).
Fluidized bed reactors for EPDM (gas-phase process).
Autoclave reactors for butyl (low-temperature cationic polymerization).
Cost includes reactor jacketing (heating/cooling), agitators, monomer feed systems, and pressure relief. Lead time: 12-18 months from order to commissioning.
Specialized Mixing and Compounding Equipment (25% of CAPEX)
Internal mixers (Banbury-type) with intermeshing rotors for carbon black and oil incorporation.
Two-roll mills for silicone and TPE (require tighter temperature control).
Continuous mixing lines for high-volume SBR compounding (reduces batch-to-batch variation).
Automated weighing and feeding systems for fillers (silica, carbon black, clay).
Curing / Vulcanization Machinery (20% of CAPEX)
Hydraulic compression molding presses for sheet goods (EPDM roofing, gaskets).
Autoclaves for large-diameter hoses (NBR, Neoprene).
Continuous vulcanization (CV) lines for extruded profiles (sponge rubber, automotive weather seals).
Hot-air ovens for silicone rubber (post-curing to remove volatiles).
Quality Control and Testing Laboratories (15% of CAPEX)
Rheometers (MDR – Moving Die Rheometer) to measure cure characteristics.
Mooney viscometers for processability testing.
Tensile testers and durometers for finished compound properties.
Gas chromatographs (GC-MS) for residual monomer analysis (critical for NBR and Butyl due to regulatory limits).
Accelerated aging ovens and ozone test chambers for EPDM and Neoprene.
LIMS (Laboratory Information Management System) software and sample tracking.
Value Your Synthetic Rubber Manufacturing With A DCF
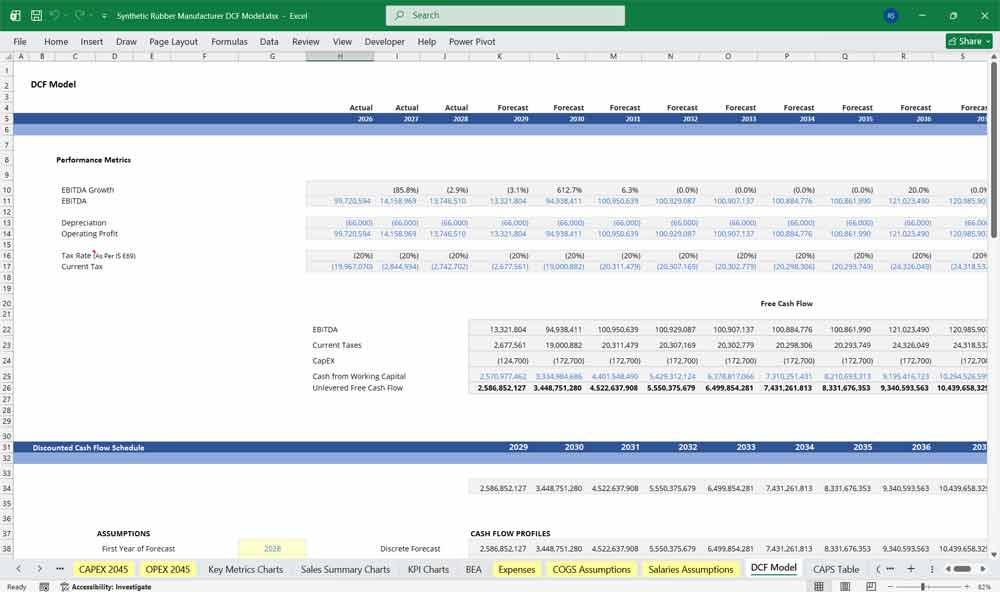
Discounted Cash Flow (DCF): Valuing the “Petrochemical Pivot”
This 20-year Discounted Cash Flow (DCF) analysis for a synthetic rubber manufacturer, the valuation is heavily anchored to the global automotive tire market and industrial sealing contracts. The model projects cash flows driven by bulk volume shipments of elastomers like Styrene-Butadiene Rubber (SBR) or Polybutadiene Rubber (PBR), offset by massive upfront and sustaining CapEx for polymerization reactors, steam crackers, and volatile organic compound (VOC) scrubbing systems. Because setting up a chemical synthesis plant requires intense capital, the early years often feature deeply negative free cash flow. The Terminal Value usually carries immense weight, reflecting the manufacturer’s long-term integration into the global transportation infrastructure, while factoring in the capital required to transition from fossil-derived feedstocks to bio-based polymers over the 20-year horizon.
WACC: Pricing Volatile Feedstocks and the “Hydrocarbon Beta”
WACC represents the company’s blended cost of debt and equity financing. For a synthetic rubber producer, WACC is influenced by petrochemical price volatility, cyclical demand from the tire industry, and environmental and regulatory considerations. Because the business is capital-intensive, financing typically includes a mix of debt and equity, with the overall cost of capital reflecting both operational risks and market conditions.
Sensitivity Analysis: Stress-Testing the “Butadiene Spread”
For a synthetic rubber facility, Sensitivity Analysis is the primary tool for mapping the boundaries of margin survival against severe supply chain shocks. Financial analysts construct sensitivity matrices to evaluate how a 25% spike in butadiene feedstock costs or a 15% contraction in global automotive build rates impacts the plant’s Internal Rate of Return (IRR). Given the high fixed costs of operating continuous-flow chemical reactors, a critical variable to stress-test is “Plant Utilization Rate”; running below 80% capacity causes fixed overhead to rapidly swallow thin operating margins. By identifying the exact break-even point where raw material inflation intersects with global rubber spot prices, the sensitivity analysis reveals whether the manufacturer is a low-cost market fortress or a marginal processor vulnerable to the next oil spike.
Final Notes on the Financial Model
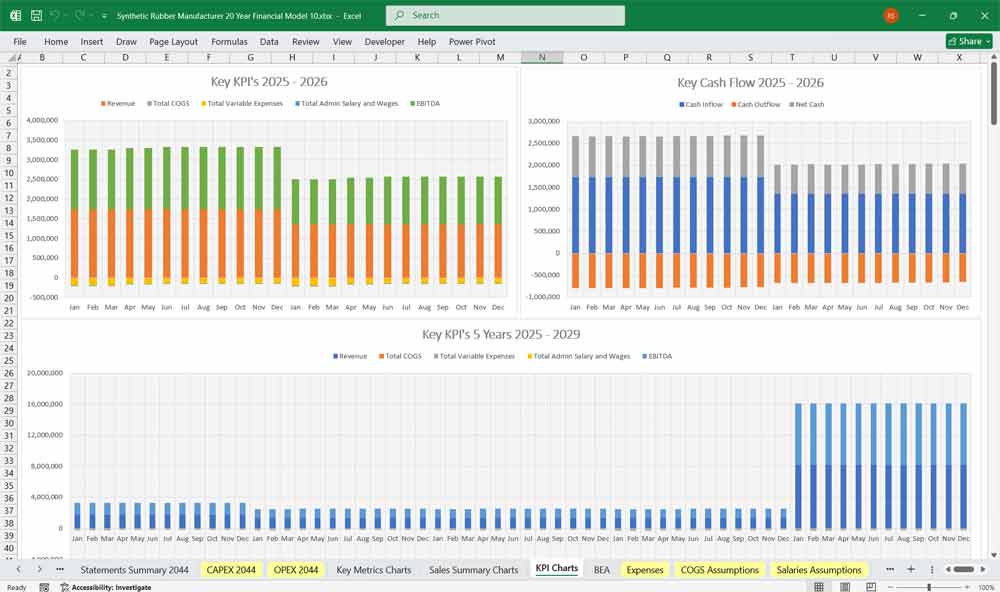
This Synthetic Rubber DCF Financial Model Template in Excel provides a structured approach to managing revenues, expenses, cash flows, and financial stability for your Rubber and Plastics company. By tracking statements and key metrics, the synthetic rubber company can optimize profitability, control costs, and plan for future expansion.
Download Link On Next Page