
Real Estate Private Equity Fund Financial Projection Model
This 20-Year, 3-Statement Excel Real Estate Private Equity Fund Financial Projection Model. This Model is built to handle the complexities of multi-asset portfolios and sophisticated capital structures. Whether you are launching a new fund or managing an existing one, this Excel template provides the analytical depth required to satisfy institutional investors.
20-Year Financial Model for a Real Estate Private Equity (REPE) Fund
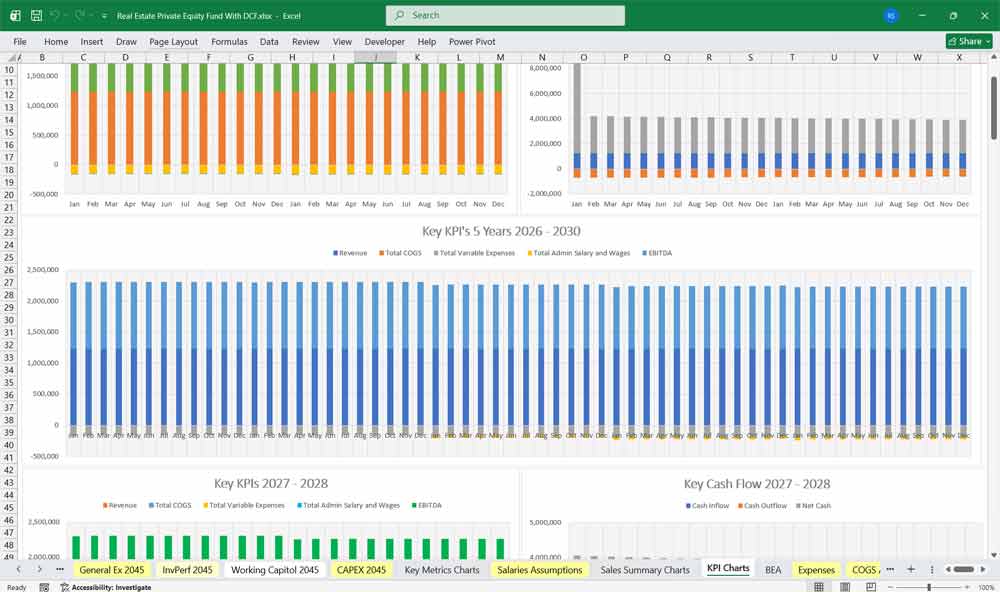
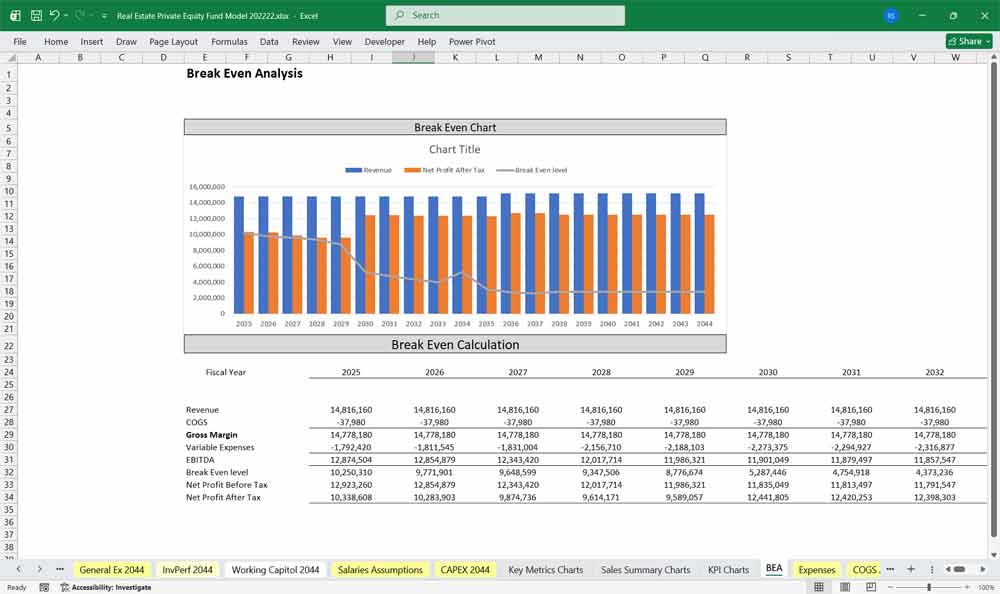
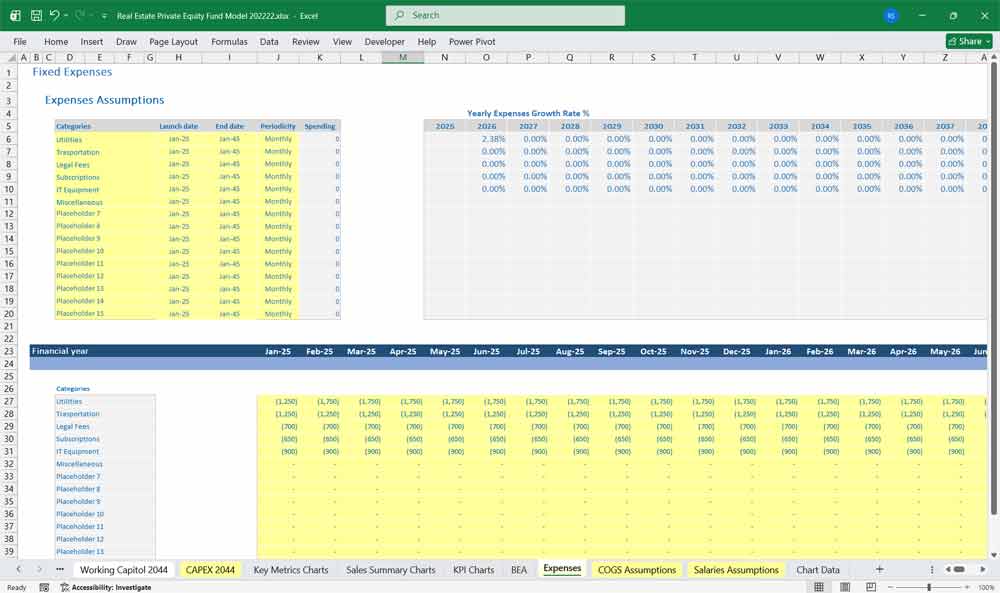
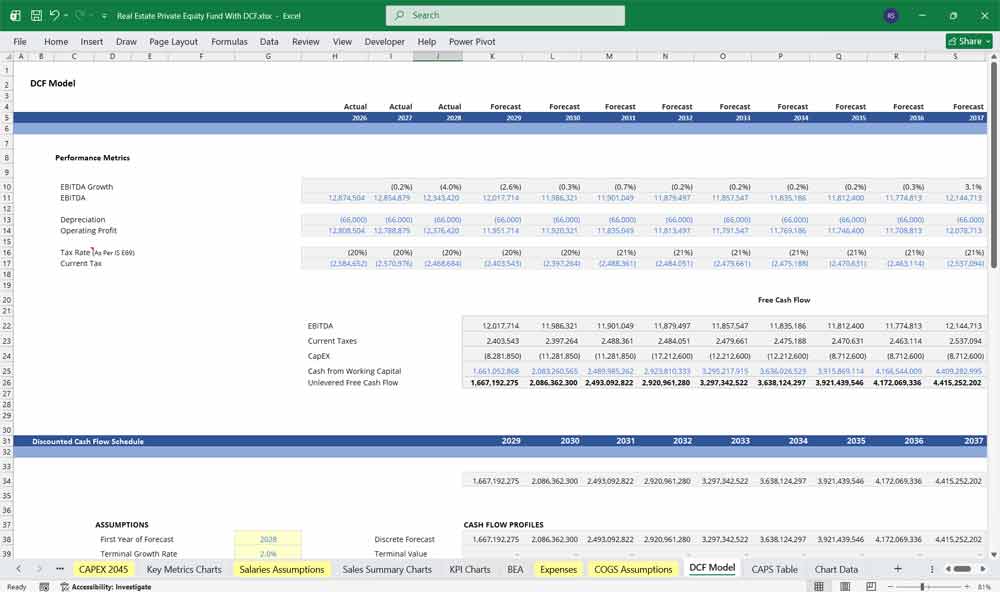
This very extensive 20 Year Private Equity Model involves detailed revenue projections, cost structures, WACC, MOIC, capital expenditures, and financing needs. This model provides a thorough understanding of the financial viability of your manufacturing company, including Discounted Cash Flow (DCF) with Terminal Value, Sensitivity Analysis, and WACC profitability, as well as its cash flow position. Includes: 20x Income Statements, Cash Flow Statements, Balance Sheets, Investor Performance, General Expenses, Working Capital, and CAPEX sheets, Statement Summary Sheets, and Revenue Forecasting Charts with the revenue streams, BEA charts, sales summary charts, employee salary tabs and expenses sheets—over 185 Spreadsheets in 1 Excel Workbook. CMBS ABS: Commercial Mortgage Asset-Backed Securities DCF Financial Model
Overview of the REPE Fund Financial Model
This Real Estate Private Equity Fund Financial Projection Model is designed to forecast the economic performance of a pooled real estate investment vehicle over its life (up to 20 years). The model integrates property-level operations, capital structure, fund-level cash flows, and investor returns.
The model is usually built on three interconnected layers:
Asset-level operating model
Fund-level aggregation and capital structure
Investor-level returns and performance metrics
The core financial statements—Income Statement, Cash Flow Statement, and Balance Sheet—are prepared at the property or fund level, depending on modeling complexity.
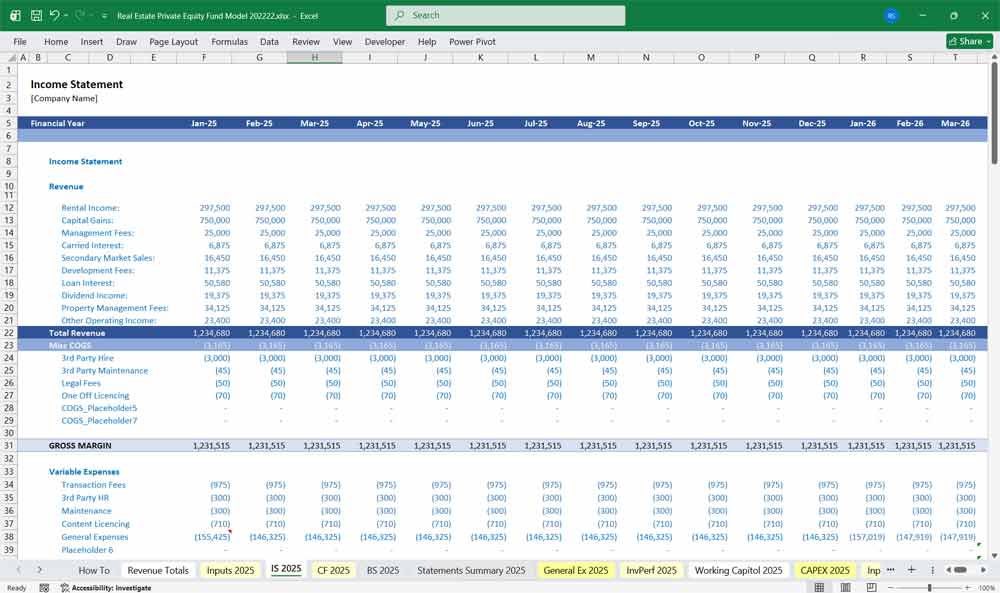
Income Statement (Operating Performance)
The Income Statement measures profitability from real estate operations over each projection period.
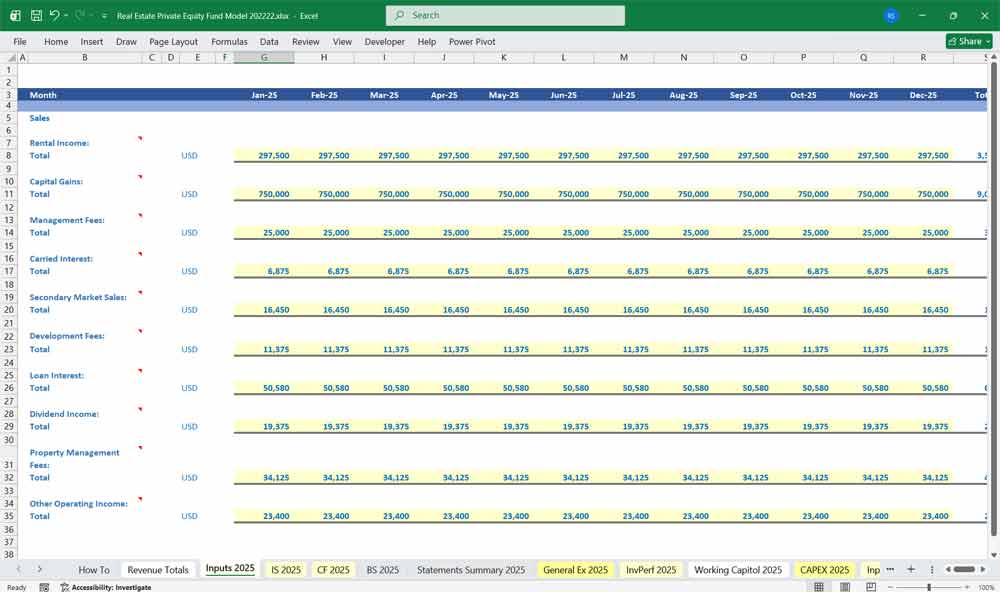
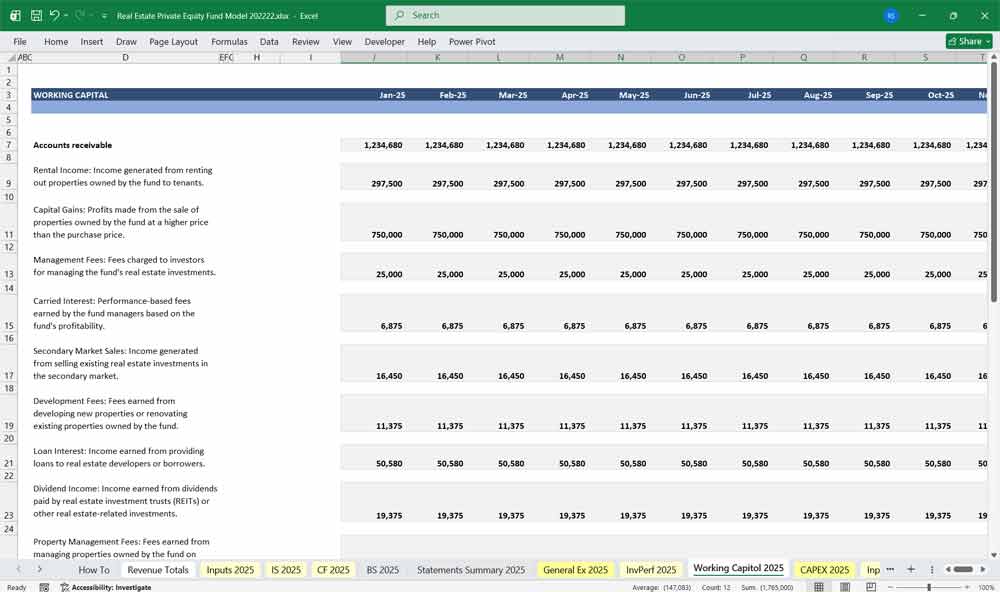
Editable Rental and Operating Income
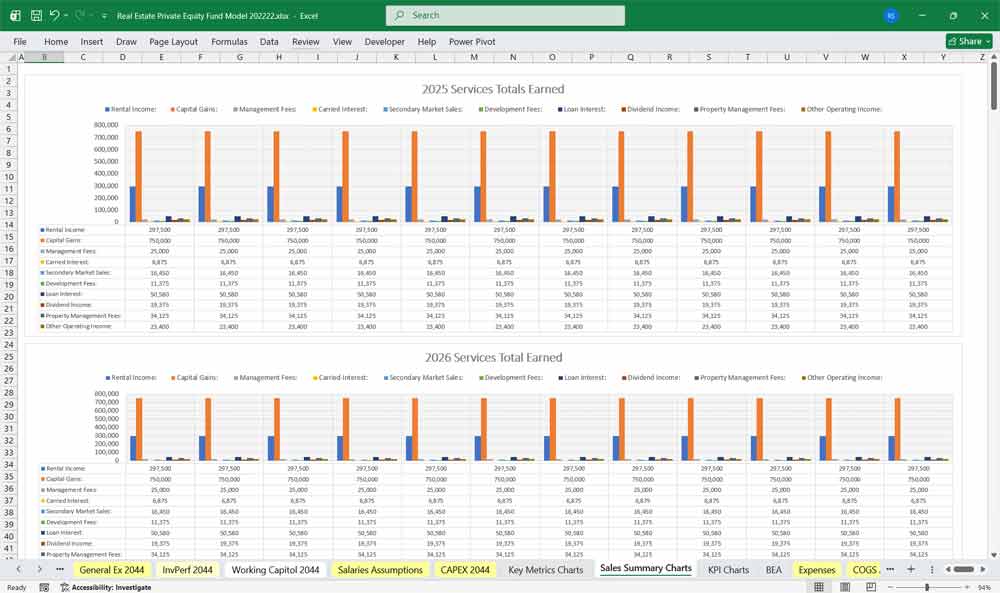
Rental Income: Income generated from renting out properties owned by the fund to tenants.
Capital Gains: Profits made from the sale of properties owned by the fund at a higher price than the purchase price.
Management Fees: Fees charged to investors for managing the fund’s real estate investments.
Carried Interest: Performance-based fees earned by the fund managers based on the fund’s profitability.
- Secondary Market Sales: Income generated from selling existing real estate investments in the secondary market.
- Development Fees: Fees earned from developing new properties or renovating existing properties owned by the fund.
- Loan Interest: Income earned from providing loans to real estate developers or borrowers.
- Property Management Fees: Fees earned from managing properties owned by the fund on behalf of investors.
- Dividend Income: Income earned from dividends paid by real estate investment trusts (REITs) or other real estate-related investments.
- Other miscellaneous income earned by the fund through various business activities.
Operating Expenses
Rental Income: Income generated from renting out properties owned by the fund to tenants.
Insurance
Repairs and maintenance
Utilities
Property management fees
Payroll (if applicable)
Administrative and marketing costs
Net Operating Income (NOI)
Calculated as Effective Gross Income minus Operating Expenses
NOI is the primary value driver in real estate and the basis for valuation
Capital Expenditures and Leasing Costs
(Usually excluded from NOI but relevant for cash flow)
Recurring capital expenditures
Tenant improvements
Leasing commissions
Financing Costs
Interest expense on senior debt, mezzanine debt, or preferred equity
Amortization of loan fees
Interest-only versus amortizing debt impacts
Net Income
NOI minus financing costs and depreciation (if included)
Depreciation is often included for accounting purposes but excluded from cash flow analysis
Net income is less important than cash flow in REPE, but still tracked
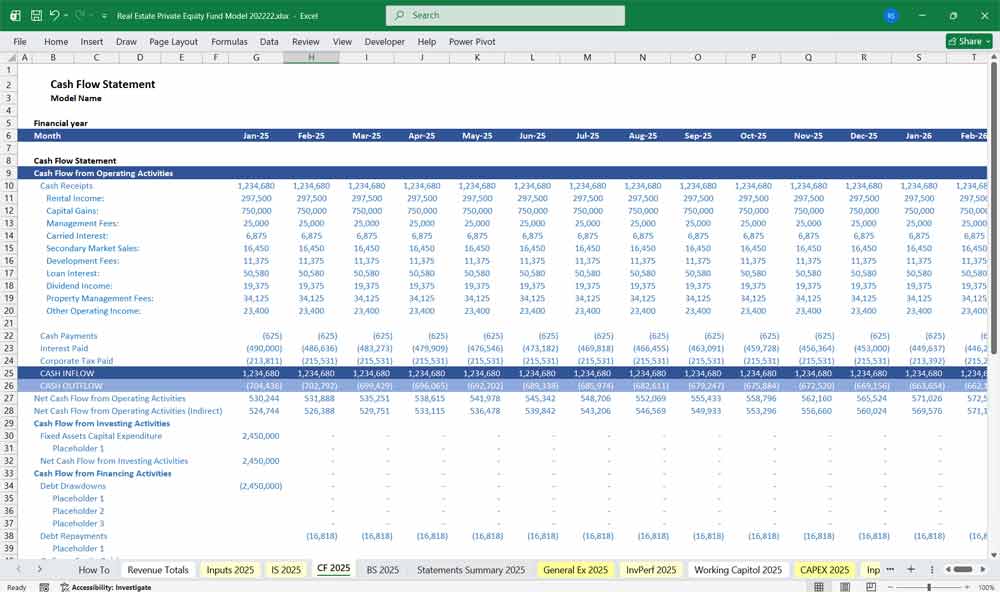
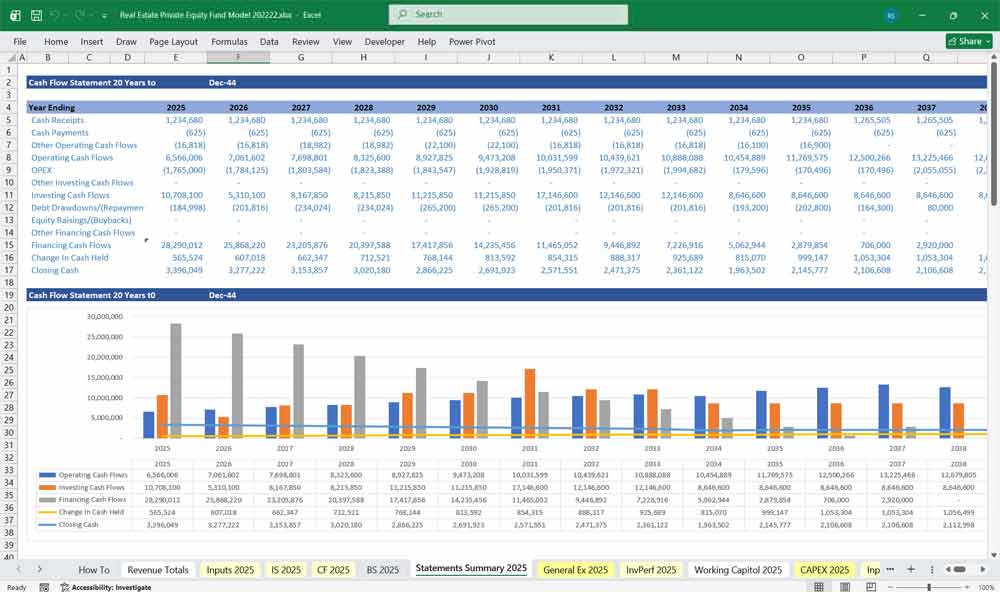
Real Estate Private Equity Fund Cash Flow Statement (Liquidity and Returns) (REPE)
The Cash Flow Statement is the most important statement in a REPE model, as it determines distributions and investor returns.
Operating Cash Flow
Starts with Net Operating Income
Adjusted for:
Capital expenditures
Leasing costs
Changes in working capital (if modeled)
Results in Cash Flow Before Debt Service
Financing Cash Flow
Debt service payments (interest and principal)
Loan origination and refinancing proceeds
Scheduled amortization and balloon payments
Optional prepayments or refinancing events
Cash Flow After Debt Service
Cash available to equity before fund-level expenses
Basis for distributions
Fund-Level Cash Flows
Management fees
Asset management fees
Organizational expenses
Operating reserves
Equity Contributions and Distributions
Initial equity contributions during acquisition phase
Follow-on capital calls for capex or operating shortfalls
Periodic cash distributions
Sale or recapitalization proceeds at exit
Exit Cash Flow
Terminal value calculated using:
Exit capitalization rate applied to forward NOI, or
Discounted sale price assumptions
Sale proceeds net of:
Remaining debt balances
Transaction costs
Net cash distributed to equity investors
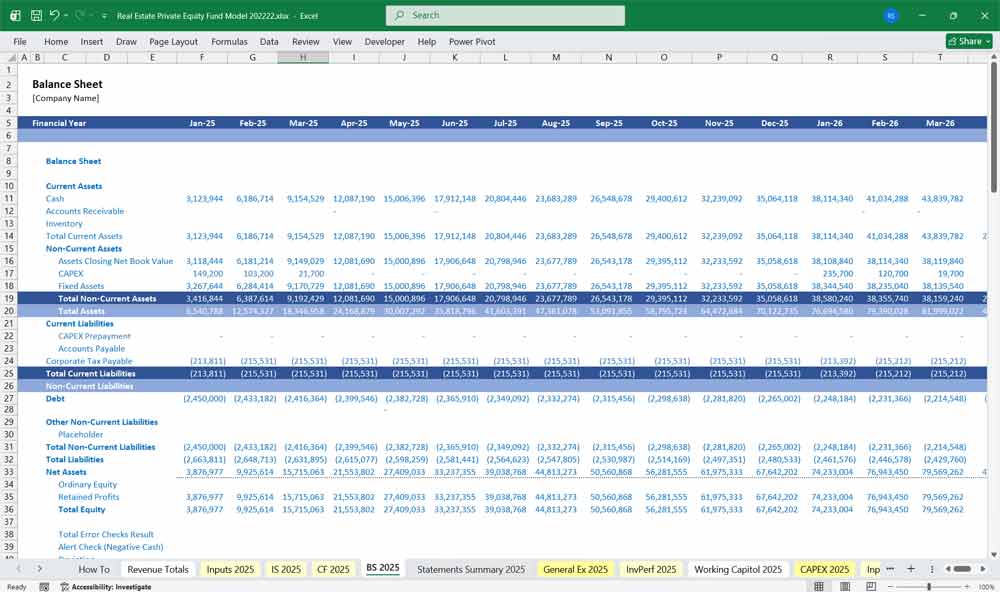
Real Estate Private Equity Fund Balance Sheet (Capital Structure and Value) (REPE)
The Balance Sheet tracks asset value, liabilities, and equity over time.
Assets
Real estate assets recorded at:
Initial acquisition cost
Adjusted for capital improvements
Less accumulated depreciation (if modeled)
Cash balances and reserves
Accounts receivable and prepaid expenses (optional detail)
Liabilities
Outstanding senior mortgage balances
Mezzanine loans or preferred equity instruments
Accrued interest payable
Accounts payable and accrued expenses
Equity
Contributed capital from investors
Retained earnings or cumulative losses
Net asset value (NAV) of the fund
Equity balance changes reflect cash flows, profits, and distributions
Real Estate Private Equity (REPE) Capital Structure and Leverage Assumptions
The model defines how assets are financed:
Interest rates (fixed or floating)
Debt terms and maturities
Amortization schedules
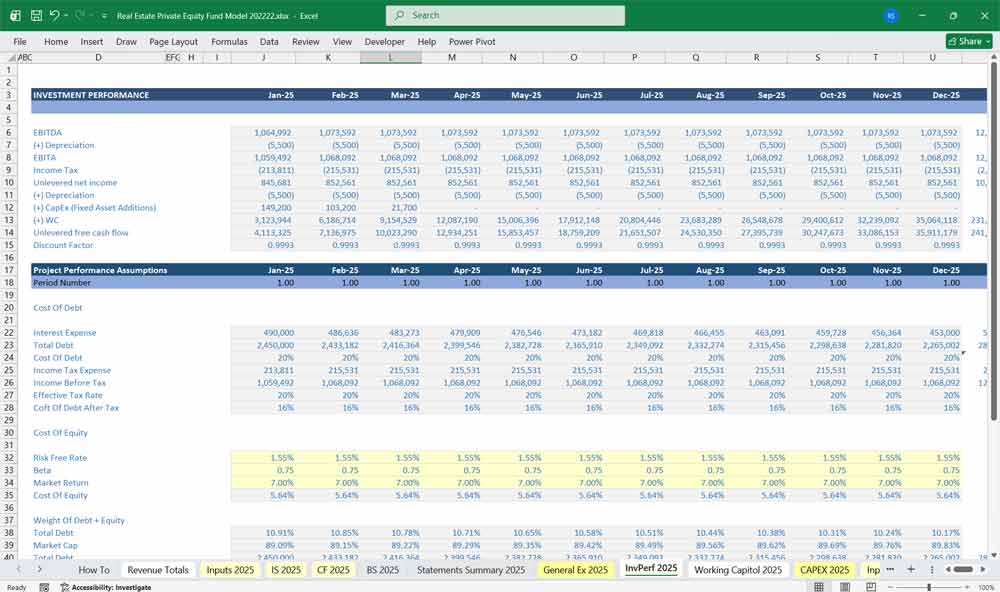
Weighted Average Cost of Capital (WACC)
WACC represents the blended cost of all capital invested in the property or fund.
Components of WACC
Cost of Equity:
Target internal rate of return (IRR)
Risk-adjusted return expectations
Cost of Debt:
Interest rate net of tax shield (if applicable)
Capital Structure Weights:
Proportion of equity versus debt
WACC Calculation Logic
WACC equals the weighted average of the after-tax cost of debt and the cost of equity
Used as:
A discount rate for unlevered cash flows
A benchmark for value creation
A comparison against project IRR
In REPE, WACC is often used conceptually rather than mechanically, as equity returns are more directly measured via IRR and MOIC.
Investor Return Metrics
Internal Rate of Return (IRR)
Measures the annualized return based on timing of cash flows
Highly sensitive to exit timing and leverage
Multiple on Invested Capital (MOIC)
Calculated as total distributions divided by total contributed capital
Indicates absolute value creation
Common benchmarks:
1.5x to 2.0x for core strategies
2.0x to 3.0x for value-add or opportunistic strategies
Cash-on-Cash Return
Annual distributions divided by invested equity
Measures ongoing income yield
Purpose and Use of the Model
The REPE Financial Projection Model is used to:
Evaluate acquisitions and dispositions
Communicate returns to investors
Support financing and refinancing decisions
Monitor portfolio performance
Support valuation and fundraising efforts
Valuing Your Real Estate Private Equity Fund Management With A DCF
Discounted Cash Flow: Valuing the Annuity and the “Performance Lottery”
A Discounted Cash Flow (DCF) analysis for a real estate private equity (REPE) fund management company estimates the firm’s value based on projected future cash flows generated from management fees, performance fees (carried interest), and advisory services. Revenue forecasts are driven by assets under management (AUM), fundraising success, investment performance, and fee structures agreed with investors, while costs include personnel compensation, deal sourcing, due diligence, and operational overhead. The projected free cash flows over a defined forecast period, along with a terminal value reflecting long-term growth in AUM and recurring fee income, are discounted to present value to determine the management company’s intrinsic value.
WACC: Pricing Platform Risk and “Key-Man” Beta
Weighted Average Cost of Capital (WACC) is used as the discount rate in valuing a REPE fund management company and reflects the blended cost of equity and debt financing. The firm’s risk profile is influenced by fundraising cycles, real estate market conditions, investment performance volatility, and competition for capital. The WACC incorporates investors’ required returns, the company’s capital structure, and any tax advantages of debt, representing the minimum return required to justify investment in the business.
Sensitivity Analysis: Stress-Testing the “Hurdle” and Fundraising
Sensitivity analysis is important in valuing a REPE fund management company due to uncertainties in fundraising levels, AUM growth, performance fee realization, operating margins, and market conditions affecting real estate investments. Analysts typically test changes in key assumptions such as management fee rates, carried interest generation, fund size growth, operating costs, and WACC. By evaluating how variations in these inputs affect the DCF valuation, sensitivity analysis highlights the most influential value drivers and provides a range of potential outcomes to support investment and strategic planning decisions.
Final Notes on the Financial Model
This 20 Year Real Estate Private Equity Fund Financial Projection Model focuses on balancing capital expenditures with steady returns. By optimizing expenditure costs, and efficiency, and maximizing high-margin services, the models ensure sustainable profitability and cash flow stability.
Download Link On Next Page
Download Link On Next Page