
PVC Manufacturing Financial Model Template
Our PVC Manufacturing Financial Model is a complete, investor-ready Excel template for PVC pipe, fittings, profiles, conduits, sheets and compound producers. It combines three years of monthly historical actuals with a five-year monthly operating forecast (2027 to 2031), each year rolled up into an annual total. Whether you are planning a new PVC pipe factory, expanding an existing extrusion plant or preparing a bank loan application, this PVC business plan financial model gives you a professional, fully linked three-statement model that is ready to use from day one.
Financial Model Overview For PVC Manufacturing
Every number is driven by formulas, not hardcoded values. Production starts with installed line capacity, rated machine output, shifts, downtime and utilization. It flows through scrap, rework and finished-goods inventory into sales volumes, selling prices and revenue. Raw material costs are built from a detailed formulation covering PVC resin, calcium carbonate, stabilizers, plasticizers, titanium dioxide and other additives. Labor, utilities and overheads are absorbed through work in progress into cost of goods sold. The result is a manufacturing financial model that reflects how a real PVC plant operates.
Built to bankable standards, the model includes a fully integrated income statement, cash flow statement and balance sheet that balances in every month. It also covers eight debt facilities with DSCR and leverage covenants, plus project NPV, IRR, MIRR and payback analysis. Five switchable scenarios, eight sensitivity tables and a risk dashboard show lenders and investors how robust the project is. Change one start date and the entire model re-dates itself automatically.
What’s Inside: Tab-by-Tab Guide
01. Cover & Executive Summary
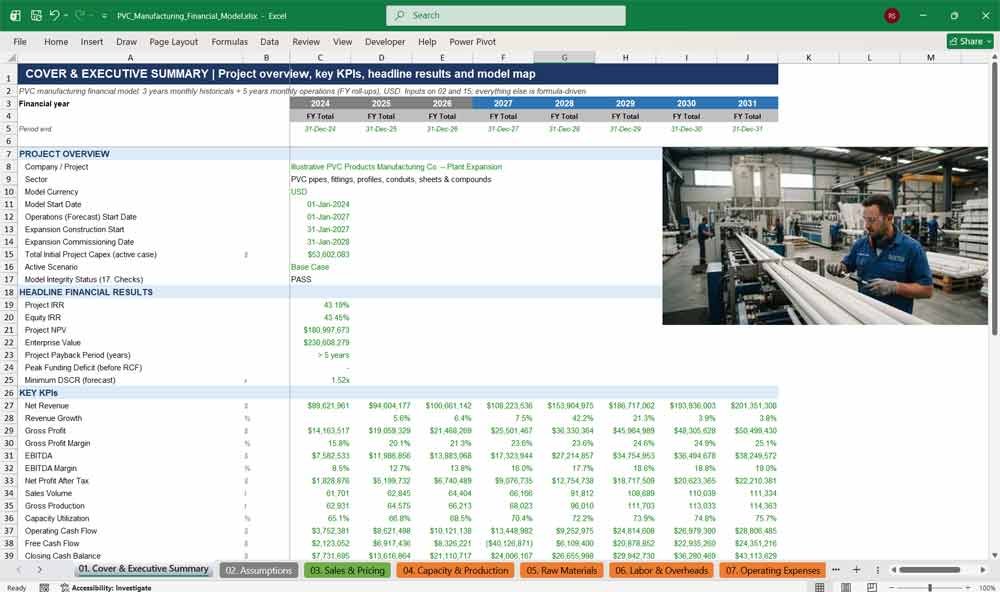
The Cover & Executive Summary gives investors an instant snapshot of your PVC manufacturing project. It shows project overview details, headline financial results and key annual KPIs, plus a clickable model map so reviewers can navigate the whole financial model in seconds.
- Project overview: company, currency, start, construction and commissioning dates
- Headline results: Project IRR, Equity IRR, NPV, enterprise value, payback and minimum DSCR
- Eight-year KPI table covering revenue, margins, volumes, cash flow and net debt
- Live model integrity status (PASS / REVIEW)
- Hyperlinked model map and colour legend
02. Assumptions
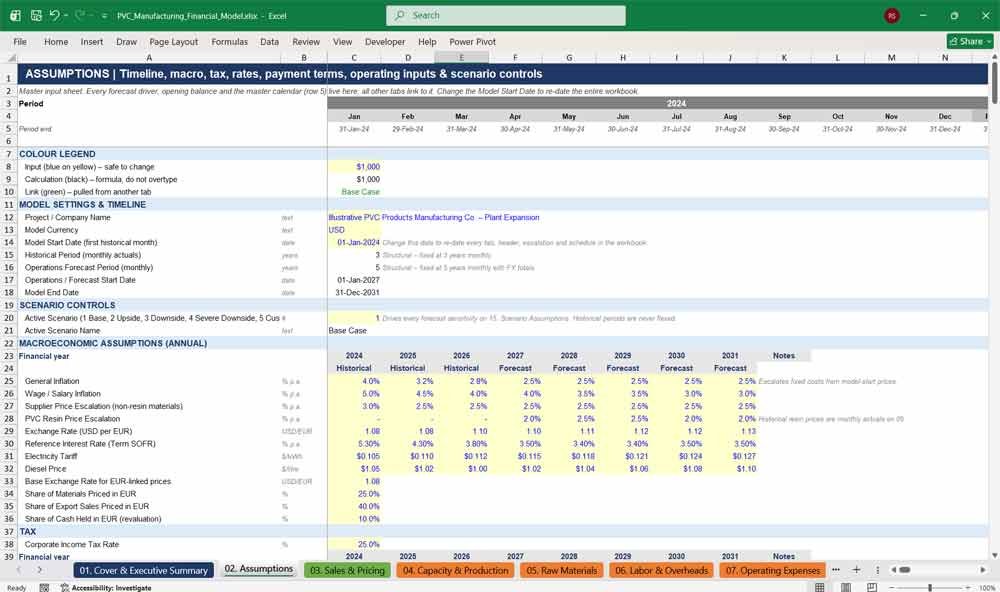
The Assumptions tab is the control centre of the PVC financial model. Every key input lives here: inflation, exchange rates, tax, interest rates, payment terms, scenario controls, production settings and opening balances. Change the model start date and every tab re-dates automatically.
- Single Model Start Date drives every date, header and escalation
- Annual tables for inflation, wages, FX (USD/EUR), SOFR, tariffs and diesel
- Payment terms, inventory days and working capital drivers
- Product, production line, labor, overhead and opex configuration tables
- Capex budget, fixed asset classes, opening balance sheet and valuation inputs
PVC Manufacturing Sales & Expenses
03. Sales & Pricing
The Sales & Pricing tab builds PVC revenue from the ground up. Volumes by product, customer segment and market combine with monthly selling prices, escalation, discounts, rebates and returns. The result is domestic and export revenue, net sales and a detailed sales analysis.
- Seven product categories: pipes, fittings, profiles, conduits, sheets, compounds and other
- Domestic vs export volumes, backlog, market share and growth rates
- Price per product category and customer segment, with EUR-linked export pricing
- Gross-to-net revenue: discounts, rebates, sales incentives and returns
- Revenue mix, revenue per tonne, per line and per customer, and variance vs budget
04. Capacity & Production
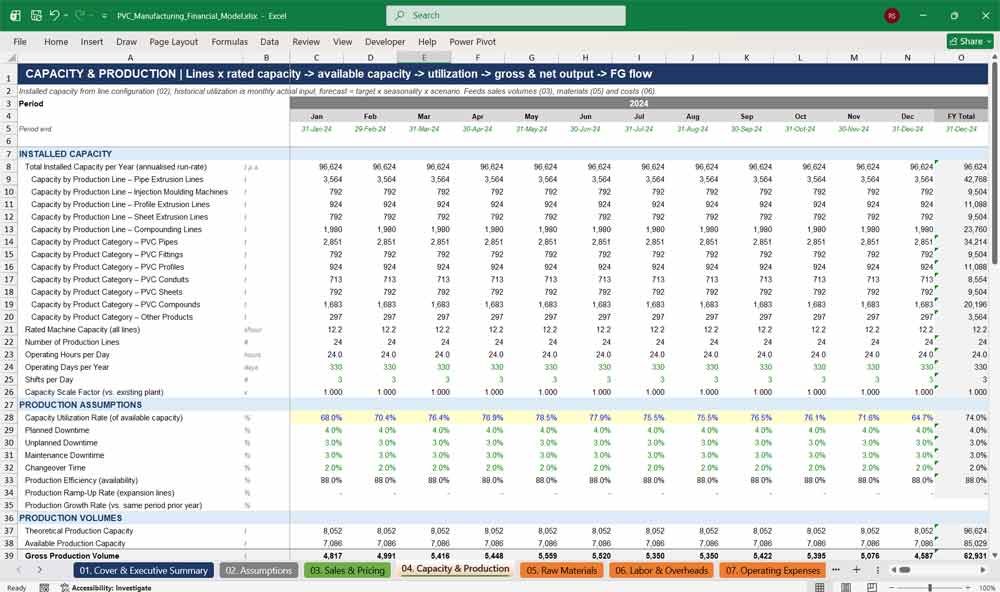
The Capacity & Production tab models how much your PVC plant can really make. Installed capacity by production line feeds availability, utilization and seasonality. Scrap, rejects and rework then determine net saleable output and the finished-goods inventory flow.
- Five production line types: pipe extrusion, injection moulding, profile, sheet and compounding
- Shifts, operating hours, operating days and rated machine capacity
- Planned, unplanned, maintenance and changeover downtime
- Expansion ramp-up, yield, scrap, rework and recycled-scrap recovery
- KPIs: OEE, tonnes per hour, shift and employee, bottleneck capacity and break-even utilization
05. Raw Materials
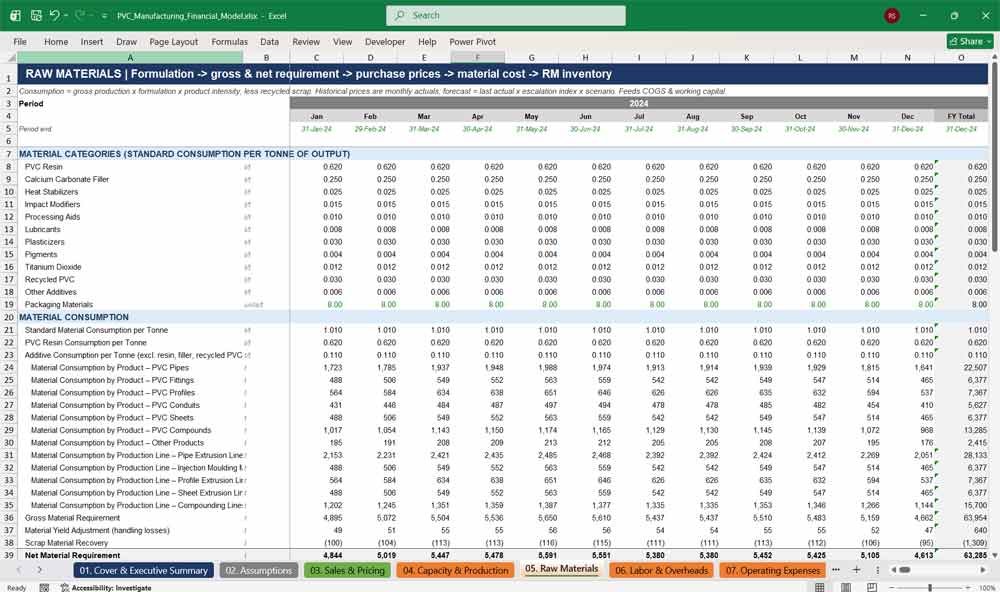
The Raw Materials tab calculates PVC resin and additive costs with real formulation detail. Standard consumption per tonne, material intensity by product and scrap recovery set net requirements. Purchase prices, freight, duties and FX impact then drive total material cost and inventory.
- Twelve material categories, including PVC resin, CaCO3 filler, stabilizers, plasticizers and TiO2
- Gross and net material requirement, with yield adjustment and scrap recovery
- Monthly resin and additive purchase prices, with escalation and scenario flexing
- Inbound freight, import duties and EUR foreign exchange impact
- Raw material inventory, purchase price variance, usage variance and supplier concentration
06. Labor & Overheads
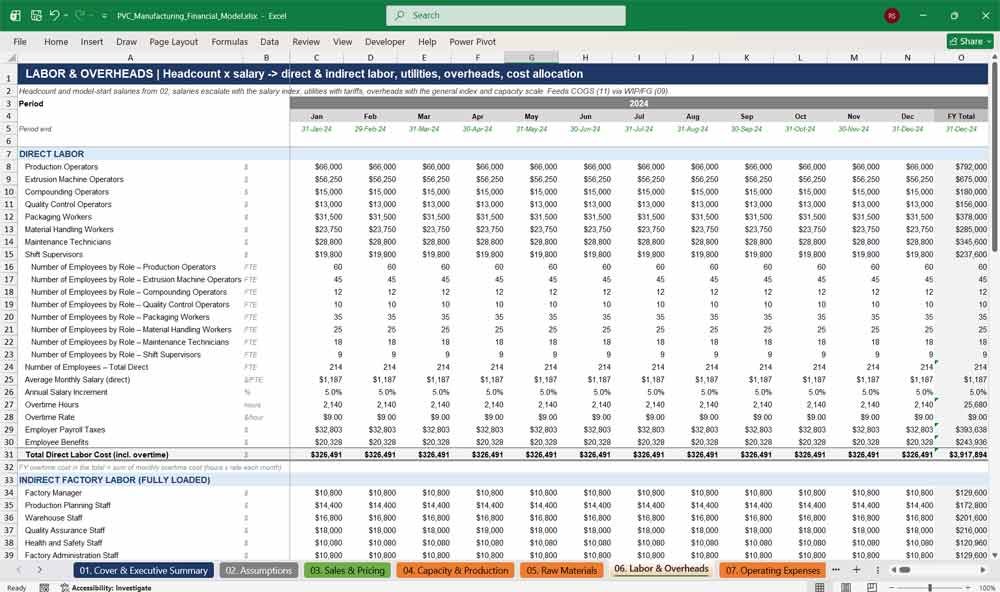
The Labor & Overheads tab captures the full conversion cost of PVC manufacturing. Direct and indirect headcount, salaries, overtime and payroll taxes combine with electricity, fuel, water and thirteen factory overhead lines. Costs are fully absorbed into production for accurate unit costing.
- Eight direct labor roles and six indirect factory roles, with headcount and salary escalation
- Overtime hours and rate, employer payroll taxes and benefits
- Electricity kWh per tonne and tariff, diesel, water, compressed air and other utilities
- Fixed and variable overheads, absorption rate and unabsorbed overheads
- Labor, energy, maintenance, conversion and total manufacturing cost per tonne
07. Operating Expenses
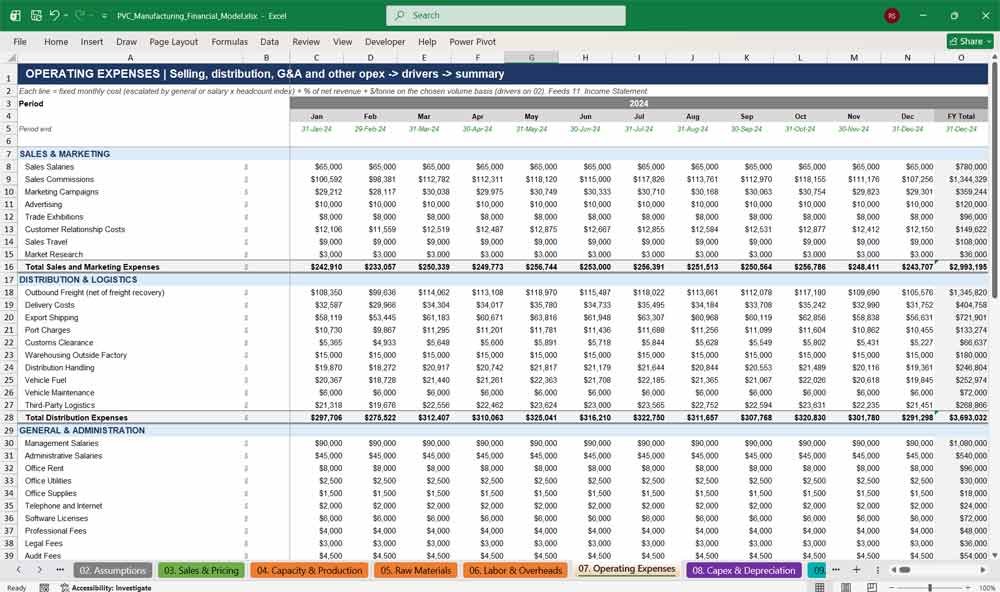
The Operating Expenses tab forecasts selling, distribution, administration and other costs below gross profit. Each line combines fixed monthly costs, revenue-based percentages and per-tonne drivers, escalated by inflation, salary growth and headcount growth for realistic SG&A forecasting.
- Sales & marketing, including sales commissions, campaigns, exhibitions and travel
- Distribution & logistics: outbound freight (net of recovery), export shipping, port and customs
- Sixteen general & administrative lines, from management salaries to audit and bank charges
- Other opex: R&D, IT, environmental fees, licences and bad debt expense
- Opex as a percentage of revenue and opex per tonne sold
08. Capex & Depreciation
The Capex & Depreciation tab models the PVC plant expansion budget in full detail. Land, buildings, production equipment, utilities and other capital costs are phased over construction, held in construction in progress, then capitalized and depreciated straight-line by asset class.
- Forty-four capex lines, from extrusion lines and moulds to transformers and solar power
- Capitalized interest, contingency, overrun and construction delay scenarios
- Construction-in-progress roll-forward and commissioning transfer
- Maintenance, expansion, replacement capex and asset disposals
- Depreciation by asset category, asset register, production depreciation and capex KPIs
PVC Manufacturing Financial Statements
09. Working Capital
The Working Capital tab forecasts the cash tied up in running a PVC factory. Receivables, raw material, work in progress and finished goods inventory, payables and other balances are driven by payment terms and holding days, producing net working capital and the cash conversion cycle.
- Domestic and export receivables, bad debt provision and write-offs
- Raw material, WIP and finished goods inventory, with full cost absorption
- Supplier payables and other trade payables
- Prepaid, accrued, payroll, tax, customer advance and other balances
- Cash conversion cycle, turnover ratios and NWC as a percentage of revenue
10. Debt & Interest
The Debt & Interest tab handles the complete financing structure of your PVC project. Eight facilities run on their own schedules, with drawdowns, grace periods, repayments, fees and interest. Covenant testing shows lenders how the project performs on DSCR and leverage.
- Senior term loan, equipment financing, revolver, working capital facility, shareholder and subordinated loans, leases and other borrowings
- Fixed or floating rates, credit spreads, arrangement and commitment fees
- Interest capitalized during construction and an auto-drawing revolving credit facility
- Debt service, balloon payments and undrawn facility headroom
- DSCR, interest cover, debt/EBITDA, LTV, covenant headroom and breach flags
11. Income Statement
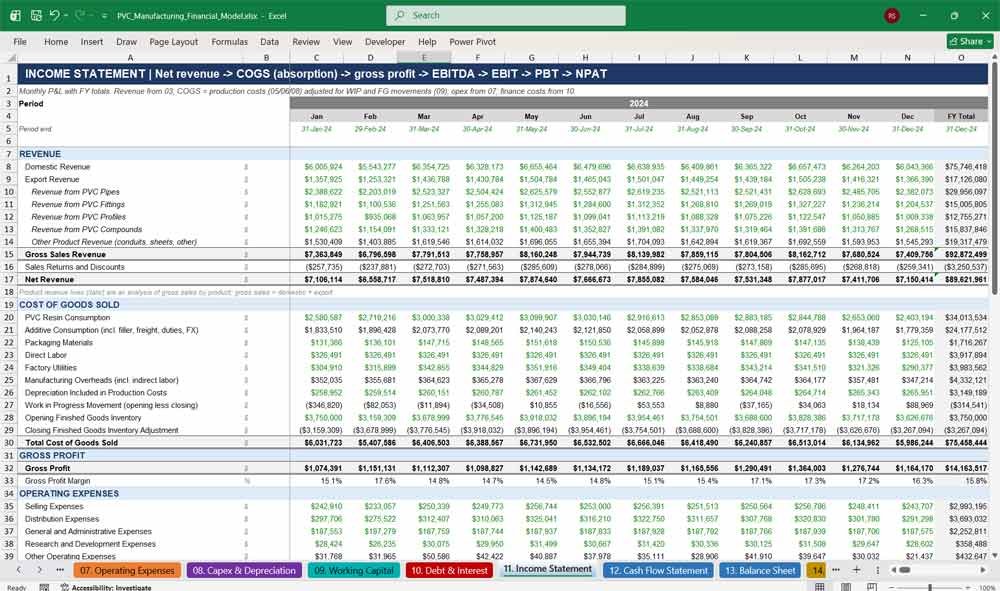
The Income Statement tab presents a monthly and annual profit and loss for the PVC business. It runs from domestic and export revenue through absorption-costed cost of goods sold, gross profit, EBITDA and EBIT to profit before tax, taxation and net profit.
- Revenue by market and by product category
- COGS split into resin, additives, packaging, labor, utilities, overheads and depreciation
- WIP and finished-goods inventory adjustments for accurate costing
- Interest income, FX gains and losses, finance costs, and current and deferred tax
- Profitability KPIs: gross, EBITDA, EBIT and net margins, and growth rates
12. Cash Flow Statement
The Cash Flow Statement tab uses the indirect method to show exactly where cash comes from and where it goes. Operating, investing and financing activities reconcile monthly to the closing cash balance, with a revolver protecting your minimum cash.
- Net profit to operating cash flow, with full working capital changes
- Interest and income taxes paid
- Investing flows by asset type, maintenance and expansion capex, and disposal proceeds
- Equity, shareholder loans, debt drawdowns, repayments, leases, dividends and fees
- Free cash flow, FCFF, FCFE, cash conversion, cash shortfall and external funding requirement
13. Balance Sheet
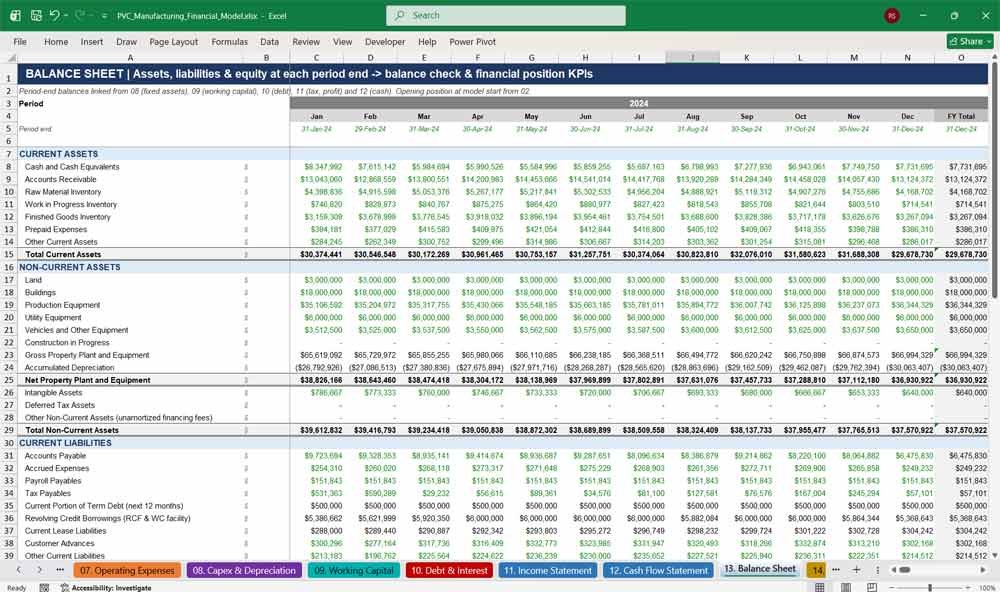
The Balance Sheet tab delivers a fully integrated monthly statement of financial position that balances in every period. Assets, liabilities and equity link directly to the operating, capex, working capital, debt and profit schedules, with a visible balance check.
- Current assets, including cash, receivables and three inventory classes
- PP&E by asset class, construction in progress and accumulated depreciation
- Current and long-term debt, leases, deferred tax and provisions
- Share capital, retained earnings, current-year profit and dividends
- Current ratio, quick ratio, debt to equity, net debt/EBITDA, ROA, ROE and ROIC
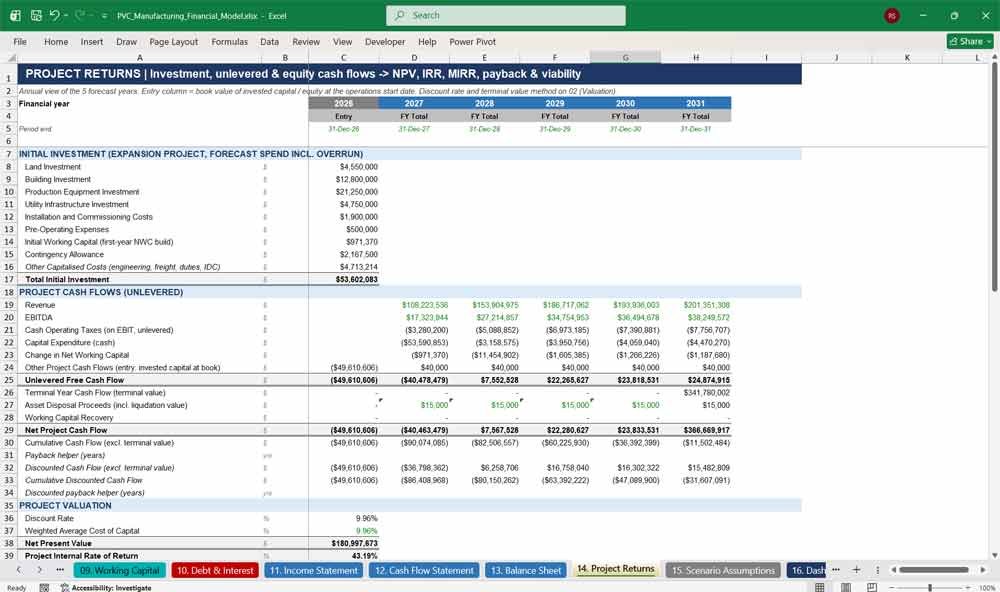
14. Project Returns
The Project Returns tab answers the investor’s key question: is this PVC project worth funding? Unlevered and equity cash flows produce NPV, IRR, MIRR, payback and discounted payback, with a choice of perpetuity growth or liquidation terminal value.
- Initial investment breakdown, including working capital and contingency
- Unlevered free cash flow, terminal value, disposals and working capital recovery
- WACC from CAPM inputs, with an optional discount rate override
- Equity IRR, equity NPV, dividends, shareholder loan flows and exit proceeds
- ROIC, ROE, EBITDA yield, cash-on-cash, profitability index and break-even year
Key Financial Metrics for PVC Manufacturing
15. Scenario Assumptions
The Scenario Assumptions tab stress-tests the PVC manufacturing business plan. Switch between Base, Upside, Downside, Severe Downside and Custom cases, flexing thirty-nine drivers. Live outputs, eight sensitivity tables and a risk analysis show exactly where the project breaks.
- Sales, raw material, production cost and financial sensitivities
- Capex overrun, construction delay, interest rate and FX shocks
- Active-case outputs: revenue, EBITDA, cash, debt, DSCR, IRR and NPV
- Sensitivity tables, such as selling price vs resin price and utilization vs EBITDA margin
- Break-even price, break-even utilization, maximum resin price and covenant risk
16. Dashboard
The Dashboard tab turns the entire PVC financial model into a one-page visual summary. Annual figures across all eight years sit alongside headline returns and native Excel charts, ideal for board packs, investor presentations and bank credit submissions.
- Headline tiles: IRR, NPV, payback, minimum DSCR and peak funding
- Revenue, EBITDA, margin, net profit and free cash flow trends
- Production vs installed capacity, and utilization vs break-even
- Cash balance and total debt
- Charts update automatically when scenarios or inputs change
17. Checks
The Checks tab protects the integrity of your PVC financial model. Ten independent tie-out tests run every month: balance sheet, debt, COGS, revenue, fixed assets and equity. Any issue is flagged instantly, so you can share the model with confidence.
- Monthly PASS / REVIEW status for every period
- Balance sheet, debt roll-forward and COGS reconciliations
- Revenue, fixed asset and accumulated depreciation tie-outs
- Negative cash and inventory warnings
- Overall integrity status reported on the Cover
Why Buy This Model?
Building a credible PVC manufacturing financial model from scratch can take weeks, and one broken link can undermine your credibility with a bank or investor. This template gives you a proven, fully integrated structure built the way lenders and private equity analysts expect.
The model is designed for real-world use:
- Colour-coded: clear distinction between inputs, calculations and links
- Monthly granularity: three years of historicals and five years of forecast, with annual roll-ups
- Real plant mechanics: capacity, utilization, formulation and absorption costing
- Bankable financing: debt schedules, DSCR covenants, scenarios and sensitivity tables
- Integrity checks: a dedicated Checks tab, plus automatic re-dating from a single start date
Simply replace the illustrative inputs with your own data and you’ll have a professional PVC business plan, feasibility study or bank-ready forecast in hours, not weeks.
PVC Manufacturing Frequently Asked Questions
Is this model suitable for a new PVC pipe factory, or only for an existing business?
Both. It is set up as an existing plant with a major expansion. For a greenfield project, set the historical inputs and opening balances to zero and use the capex, construction and ramp-up schedules for the new plant.
Can I change the start date and the forecast years?
Yes. Change the Model Start Date on the Assumptions tab and every date, header, escalation, debt schedule and chart updates automatically. The structure is fixed at three historical years and five forecast years, all monthly.
Do I need advanced Excel skills to use it?
No. Inputs are clearly marked in blue on yellow cells, and everything else calculates for you. If you can type numbers into a spreadsheet, you can use this model. The colour legend and model map make navigation simple.
Can I model products other than PVC pipes?
Yes. The model covers pipes, fittings, profiles, conduits, sheets, compounds and an “other products” line. Each product can be switched on or off, mapped to a production line and given its own price and material intensity.
How are raw material costs calculated?
Costs are built from a formulation per tonne of output, covering PVC resin, calcium carbonate, stabilizers, impact modifiers, processing aids, lubricants, plasticizers, pigments, titanium dioxide, recycled PVC and other additives. Freight, import duties and EUR exchange-rate effects are added on top.
Can I use it to apply for a bank loan?
Yes. The model includes a full three-statement forecast, eight debt facilities, DSCR and leverage covenant testing, scenario analysis and sensitivity tables. These are the outputs credit committees typically ask for.
Does the balance sheet balance?
Yes, in every month. A dedicated Checks tab runs ten tie-out tests each period and reports PASS or REVIEW. The overall status is shown on the Cover so you always know the model is sound.
What scenarios can I run?
Five switchable cases: Base, Upside, Downside, Severe Downside and Custom. Thirty-nine drivers can be flexed, including selling prices, volumes, resin prices, energy costs, wages, interest rates, FX, capex overruns and construction delays.
What currency is the model in?
The model reports in USD, with EUR exchange-rate effects on part of material purchases and export sales. You can relabel the currency on the Assumptions tab and enter your own figures in any single currency.
Does it calculate NPV and IRR?
Yes. The Project Returns tab calculates project NPV, IRR, MIRR, payback, discounted payback and enterprise value. It also covers equity IRR, equity NPV and cash-on-cash returns, using WACC built from CAPM inputs or your own discount rate.
Does it include macros?
No. The model contains no macros or VBA. It uses standard Excel formulas only, so it opens safely and works in Excel 2010 or later and in Microsoft 365.
Can I customise the model or add more production lines?
Yes. The file is fully unlocked. You can edit line counts, rated capacities, headcount, overheads, capex items and debt terms directly in the configuration tables, or extend the model to suit your business.
Key Financial Ratios & Metrics
- Gross Profit Margin = (Revenue – COGS) / Revenue
- Operating Margin = Operating Profit / Revenue
- EBITDA Margin = (Earnings Before Interest, Taxes, Depreciation, and Amortization) / Revenue
- Current Ratio = Current Assets / Current Liabilities
- Debt-to-Equity Ratio = Total Debt / Shareholder’s Equity
- Return on Investment (ROI) = Net Profit / Investment Cost
Scenario Analysis
- Best Case: High subscription retention, strong retail demand, cost efficiency.
- Base Case: Steady sales growth with manageable costs.
- Worst Case: Supply chain disruptions, high churn, increased competition.
Conclusion
These Excel financial models for PVC manufacturing must balance product variety, cost structure, and revenue channels. By incorporating retail sales, bulk distribution, and a 6-tier subscription model, the business can stabilize cash flow and achieve long-term growth