
Pharmaceutical Manufacturer Financial Model
Here’s a comprehensive breakdown of the Excel 20-Year Financial Model for a Pharmaceutical Manufacturer, covering the Income Statement, Cash Flow Statement, and Balance Sheet. With revenues from 80 product lines and a Subscription Add-On. Cost structures, Discounted Cash Flow (DCF) with Terminal Value, Sensitivity Analysis, WACC, to forecast the financial health of your pharmaceutical manufacturing business.
Financial Model for a Pharmaceutical Manufacturer
120 Spreadsheet Excel Workbook. 20x Income Statement, Cash Flow Statement, Balance Sheets, and CAPEX and OPEX Tables.
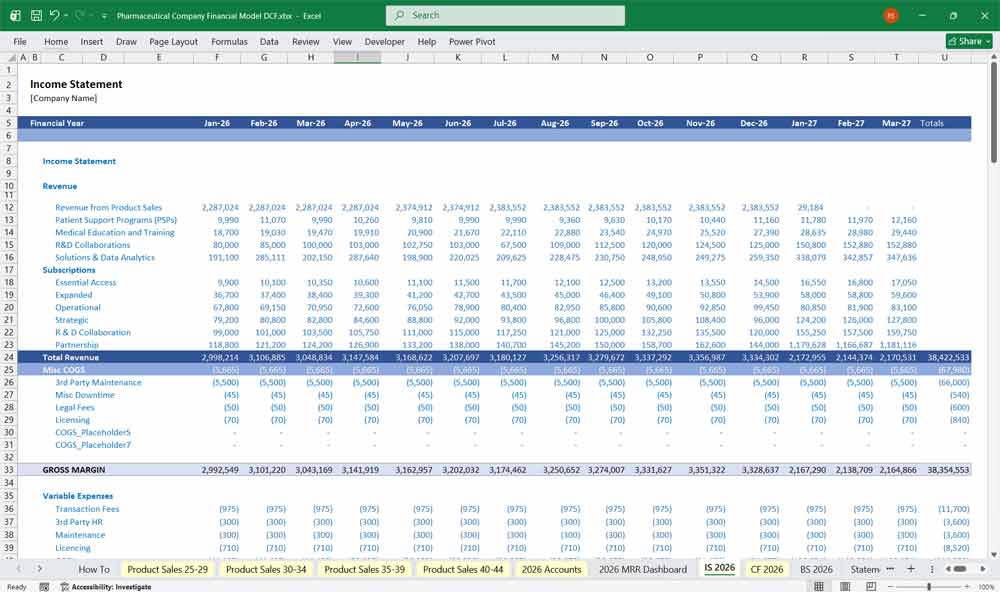
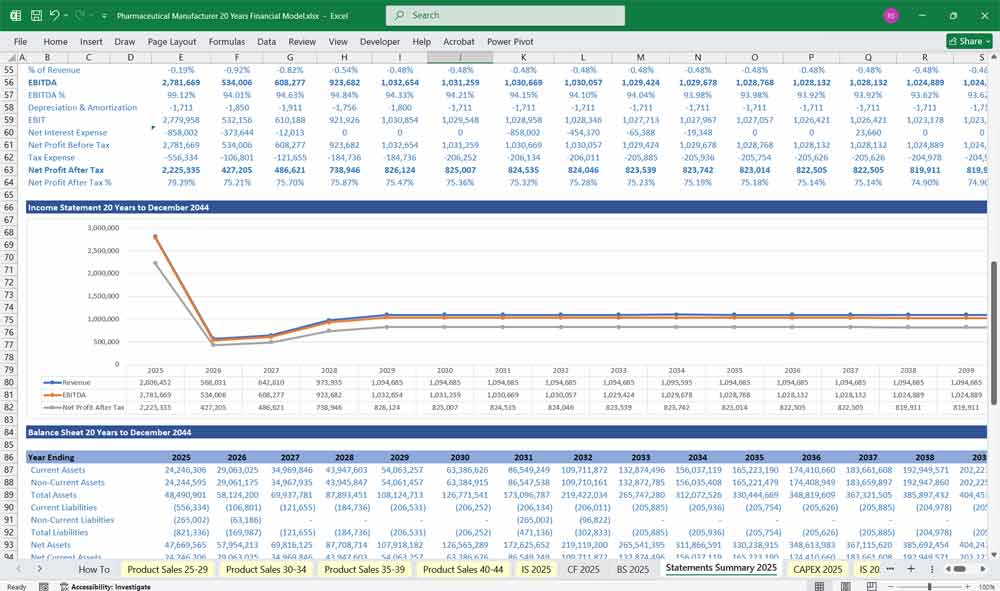
Income Statement
The Income Statement reflects the company’s revenues, costs, and profitability over a specific period. For a pharmaceutical manufacturer, it should include the following key components:
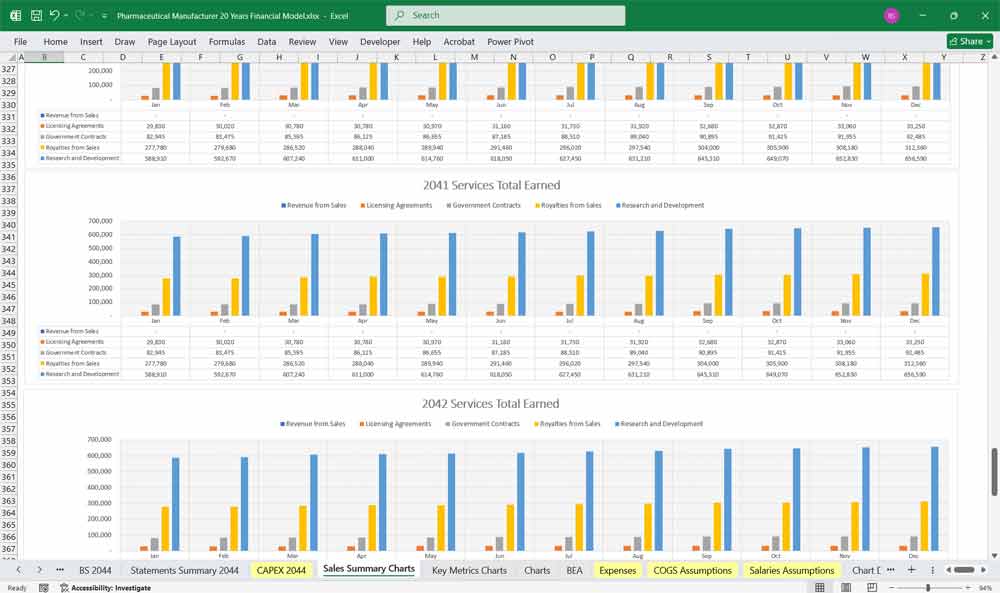
Revenue
Product Sales: Revenue from the sale of 80 product lines, broken down by product or product category.
Licensing Revenue: Income from licensing agreements for patented drugs or technologies.
Royalties: Revenue from third-party sales of licensed products.
R&D Grants: Income from government or private grants for research and development.
Cost of Goods Sold (COGS)
Raw Materials: Costs of active pharmaceutical ingredients (APIs), excipients, and other raw materials.
Manufacturing Costs: Labor, utilities, and overhead costs associated with production.
Packaging Costs: Costs of primary and secondary packaging materials.
Quality Control: Costs of testing and ensuring product quality.
Gross Profit
Gross Profit = Revenue – COGS
Operating Expenses
Research & Development (R&D): Costs of clinical trials, drug discovery, and regulatory compliance.
Sales & Marketing: Costs of promotional activities, salesforce, and advertising.
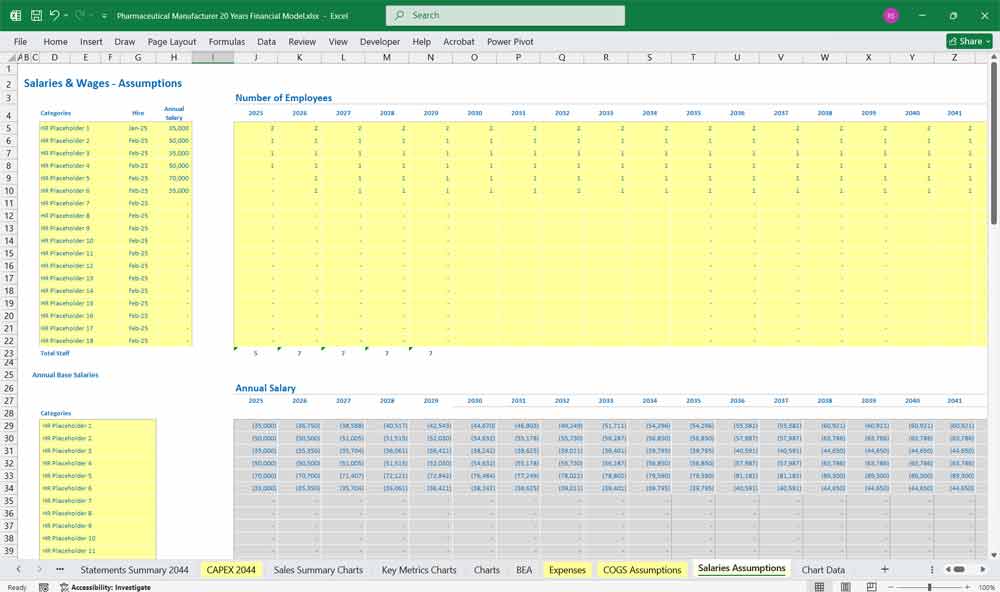
General & Administrative (G&A): Overhead costs, including salaries, legal fees, and office expenses.
Regulatory Costs: Fees for FDA or other regulatory body approvals.
Operating Income
Operating Income = Gross Profit – Operating Expenses
Non-Operating Items
Interest Income/Expense: Income from investments or interest on debt.
Other Income/Expense: Gains or losses from asset sales, foreign exchange, or litigation.
Net Income
Net Income = Operating Income + Non-Operating Items – Taxes
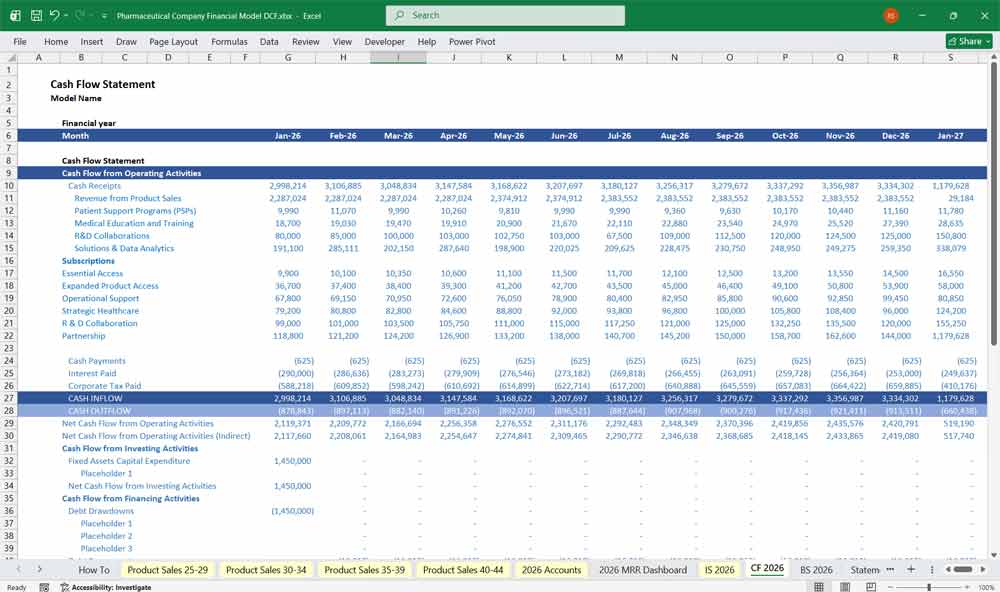
Pharmaceutical Manufacturer Cash Flow Statement
The Cash Flow Statement tracks the company’s cash inflows and outflows, divided into three sections:
Operating Activities
Cash from Sales: Collections from product sales.
Cash Paid for COGS: Payments to suppliers for raw materials and manufacturing.
Cash Paid for Operating Expenses: Payments for R&D, sales, marketing, and G&A.
Tax Payments: Cash paid for income taxes.
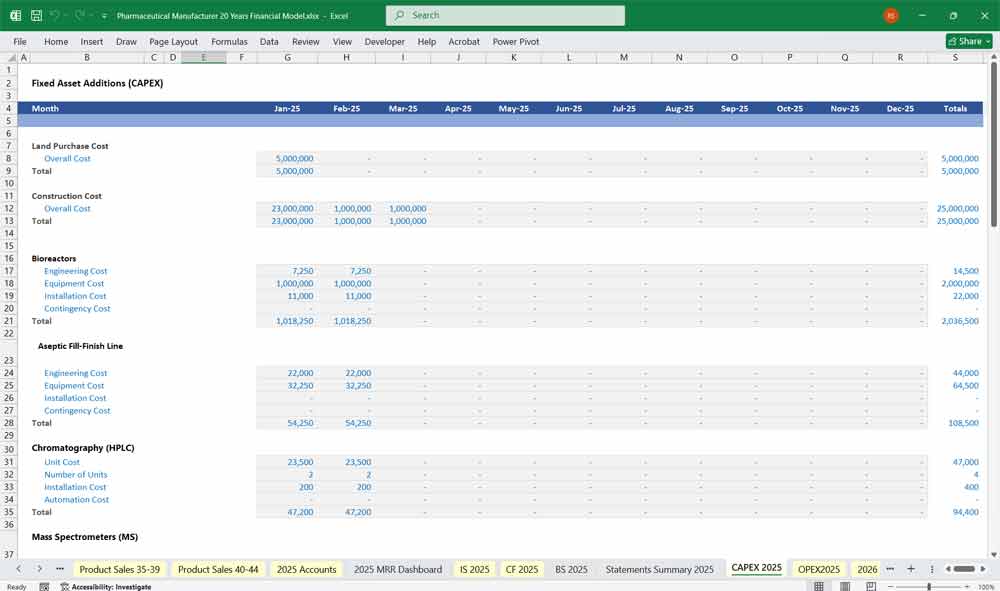
Investing Activities
Capital Expenditures (CapEx): Cash spent on manufacturing facilities, equipment, and R&D infrastructure.
Acquisitions: Cash spent on acquiring other companies or product lines.
Investments: Cash spent on financial investments.
Financing Activities
Debt Issuance/Repayment: Cash from issuing or repaying debt.
Equity Issuance/Repurchase: Cash from issuing or repurchasing shares.
Dividends: Cash paid to shareholders.
Net Change in Cash
Net Change in Cash = Cash from Operating Activities + Cash from Investing Activities + Cash from Financing Activities
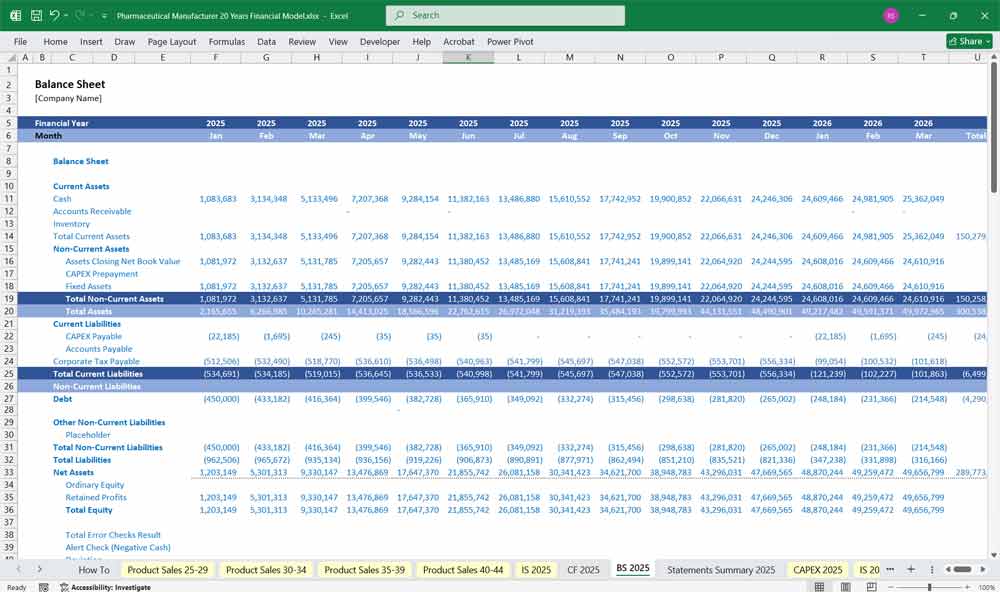
Pharmaceutical Manufacturer Balance Sheet
The Balance Sheet provides a snapshot of the company’s financial position at a specific point in time.
Assets
Current Assets:
Cash and Cash Equivalents
Accounts Receivable (from product sales)
Inventory (raw materials, work-in-progress, finished goods)
Prepaid Expenses
Non-Current Assets:
Property, Plant, and Equipment (PP&E): Manufacturing facilities, labs, and equipment.
Intangible Assets: Patents, trademarks, and licenses.
Goodwill: From acquisitions.
Liabilities
Current Liabilities:
Accounts Payable (to suppliers)
Accrued Expenses (wages, taxes, etc.)
Short-Term Debt
Non-Current Liabilities:
Long-Term Debt
Deferred Revenue (from licensing or upfront payments)
Equity
Shareholder’s Equity:
Common Stock
Retained Earnings
Treasury Stock (if applicable)
Assumptions and Drivers for a Pharmaceutical Manufacturer
The financial model should include key assumptions and drivers, such as:
Volume Growth: Projected growth in unit sales for each product.
Price Changes: Expected changes in pricing due to market conditions or competition.
R&D Success Rates: Probability of success for drugs in the pipeline.
Regulatory Approval Timelines: Expected timelines for FDA or other approvals.
Patent Expirations: Impact of patent cliffs on revenue.
80 Product Lines
This section provides a detailed breakdown of the financial performance of each of the 80 product lines.
1. Pharmaceutical Analgesics (Pain Relief)
- Pharmaceutical Non-opioid analgesics (paracetamol, ibuprofen)
- Pharmaceutical Opioid analgesics (morphine, oxycodone)
- Pharmaceutical Topical pain relief (gels, patches)
- Combination analgesics
- Pharmaceutical Pediatric pain relief
2. Pharmaceutical Anti-Inflammatories
- Pharmaceutical Non-Steroidal Anti-Inflammatory Drugs (NSAIDs)
- Pharmaceutical Corticosteroids (oral, injectable)
- Pharmaceutical Topical anti-inflammatories
- Pharmaceutical Biologics for chronic inflammation
- Pharmaceutical Plant-based anti-inflammatory supplements
3. Pharmaceutical Antibiotics
- Pharmaceutical Broad-spectrum antibiotics
- Pharmaceutical Narrow-spectrum antibiotics
- Pharmaceutical Topical antibiotics
- Pharmaceutical Pediatric antibiotics
- Antibiotic combination therapies
4. Pharmaceutical Antivirals
- Pharmaceutical Influenza antivirals
- HIV antiretroviral therapy (ART)
- Pharmaceutical Hepatitis B and C treatments
- Pharmaceutical Herpes simplex virus treatments
- Pharmaceutical COVID-19 antivirals
5. Pharmaceutical Antifungals
- Pharmaceutical Topical antifungals (creams, sprays)
- Oral antifungals
- Pharmaceutical Intravenous antifungals
- Antifungal shampoos
- Pharmaceutical Nail fungus treatments
6. Cardiovascular Pharmaceutical Medications
- Pharmaceutical Antihypertensives
- Pharmaceutical Antiarrhythmics
- Pharmaceutical Anticoagulants and antiplatelets
- Lipid-lowering agents
- Pharmaceutical Heart failure medications
7. Respiratory Pharmaceutical Medications
- Pharmaceutical Asthma inhalers (bronchodilators, corticosteroids)
- Pharmaceutical COPD treatments
- Pharmaceutical Antihistamines for allergies
- Pharmaceutical Cough suppressants and expectorants
- Pharmaceutical Oxygen therapy products
8. Endocrine and Hormonal Pharmaceutical Therapies
- Pharmaceutical Diabetes medications (insulin, metformin)
- Pharmaceutical Thyroid treatments
- Pharmaceutical Hormone replacement therapy (HRT)
- Pharmaceutical Growth hormone therapies
- Polycystic Ovary Syndrome (PCOS) Treatments
9. Neurological and Psychiatric Pharmaceutical Medications
- Pharmaceutical Antidepressants
- Pharmaceutical Antipsychotics
- Pharmaceutical Anti-epileptics
- Pharmaceutical Parkinson’s disease treatments
- Pharmaceutical Migraine management drugs
10. Gastrointestinal Pharmaceutical Treatments
- Pharmaceutical Antacids and Proton Pump Inhibitors (PPIs)
- Pharmaceutical Anti-diarrheal medications
- Pharmaceutical Laxatives and stool softeners
- Pharmaceutical Irritable Bowel Syndrome (IBS) Treatments
- Anti-emetics for nausea and vomiting
11. Pharmaceutical Oncology (Cancer Treatments)
- Pharmaceutical Chemotherapy drugs
- Pharmaceutical Immunotherapy agents
- Pharmaceutical Hormonal therapies for cancer
- Pharmaceutical Supportive care medications
- Targeted therapy drugs
12. Pharmaceutical Vaccines
- Pharmaceutical Influenza vaccines
- Pharmaceutical COVID-19 vaccines
- Pharmaceutical Hepatitis vaccines
- Pharmaceutical HPV vaccines
- Pharmaceutical Childhood immunization programs
13. Dental Pharmaceuticals
- Local anesthetics
- Pharmaceutical Antibiotics for dental infections
- Mouth rinses and antiseptics
- Pharmaceutical Pain relief gels
- Fluoride treatments
14. Sleep and Pharmaceutical Sedation
- Pharmaceutical Sleep aids (melatonin, benzodiazepines)
- Pharmaceutical Anesthesia agents
- Anti-anxiety medications
- Pharmaceutical Post-operative sedation drugs
- Pharmaceutical Herbal sleep remedies
15. Dermatological Pharmaceutical Products
- Acne treatments
- Psoriasis medications
- Pharmaceutical Eczema creams
- Anti-aging formulations
- Skin lightening agents
16. Injectable Pharmaceutical Products
- Pharmaceutical Vaccines
- Insulin pens
- Injectable antibiotics
- Pharmaceutical Biologics
- Pharmaceutical Pain management injections
17. OTC (Over-the-Counter) Pharmaceutical Medications
- Cold and flu remedies
- Pain relief tablets
- Pharmaceutical Digestive aids
- Pharmaceutical Allergy medications
- Pharmaceutical Topical antiseptics
18. Ophthalmic Pharmaceutical Solutions
- Dry eye treatments
- Glaucoma medications
- Pharmaceutical Anti-infective eye drops
- Pharmaceutical Allergy relief eye drops
- Surgical eye lubricants
19. Otological Pharmaceutical Products (Ear Treatments)
- Pharmaceutical Ear infection treatments
- Pharmaceutical Earwax removal solutions
- Pharmaceutical Pain relief drops
- Anti-fungal ear drops
- Swimmer’s ear treatments
20. Pharmaceutical Nasal Care
- Pharmaceutical Nasal Decongestants
- Pharmaceutical Allergy nasal sprays
- Pharmaceutical Nasal saline solutions
- Pharmaceutical Nasal corticosteroids
- Sinusitis treatment sprays
Revenue by Pharmaceutical Products
Unit Sales: Number of units sold for each product.
Price per Unit: Average selling price per unit.
Total Revenue: Unit Sales × Price per Unit.
Cost of Goods Sold (COGS) by
Pharmaceutical Product
Raw Material Costs: Specific to each product.
Manufacturing Costs: Allocated based on production volume or complexity.
Packaging Costs: Specific to each product.
Gross Profit by Pharmaceutical Product
Gross Profit = Revenue – COGS
Operating Expenses Allocation
R&D Allocation: Based on the stage of development or product lifecycle.
Sales & Marketing Allocation: Based on promotional efforts or market share.
Regulatory Costs: Specific to each product.
Net Profit by Pharmaceutical
Product
Net Profit = Gross Profit – Allocated Operating Expenses
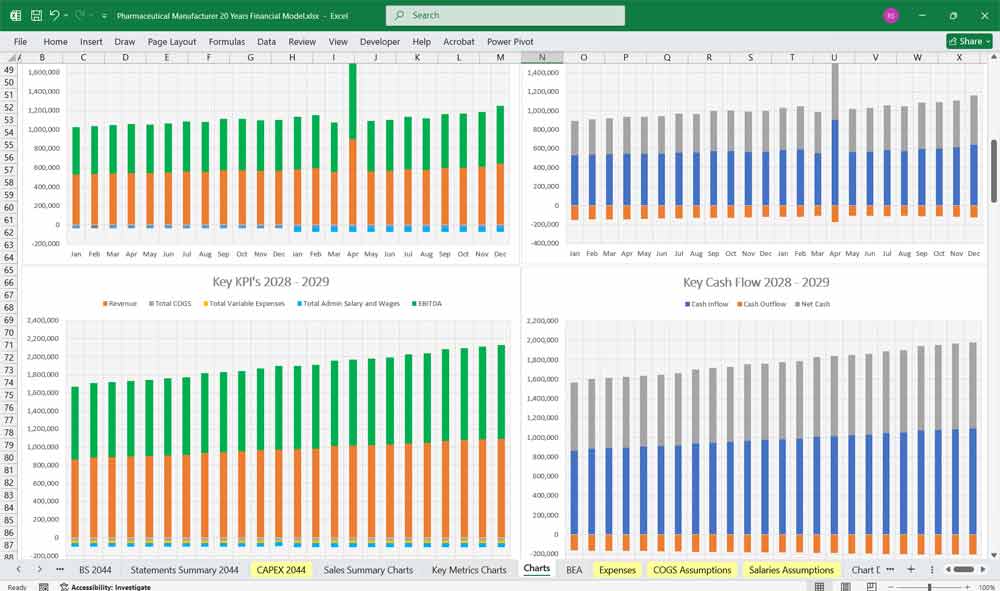
Key Metrics
Gross Margin %: Gross Profit / Revenue.
Contribution Margin: Revenue – Variable Costs.
Market Share: Percentage of total market sales for each product.
6-Tier Subscription For A Pharmaceutical Manufacturer
1. Starter Tier – Essential Access
Target: Small clinics, independent pharmacies, early-stage partners
Purpose: Provide reliable access to essential pharmaceutical products and basic support.
Key Features
Access to a core catalog of essential medications
Standard wholesale pricing
Monthly ordering allowance
Basic digital ordering platform access
Standard delivery timelines
Email-based customer support
Compliance documentation access (certificates, regulatory info)
Benefits
Affordable entry point
Simplified procurement
Predictable supply of essential drugs
Typical Value Add
Introductory discounts on selected medications
Access to educational newsletters and product updates
2. Professional Tier – Expanded Product Access
Target: Growing pharmacies, mid-sized clinics, outpatient centers
Purpose: Expand access to a broader drug portfolio with improved service levels.
Key Features
Full pharmaceutical catalog access
Volume-based pricing discounts
Priority order processing
Extended ordering limits
Dedicated account representative
Basic analytics dashboard (purchase history, inventory trends)
Benefits
Better pricing for higher volumes
Faster fulfillment
More efficient supply management
Typical Value Add
Early notification of new drug launches
Quarterly product training sessions
3. Clinical Tier – Operational Support
Target: Hospitals, specialty clinics, healthcare networks
Purpose: Support clinical operations with advanced services and logistics.
Key Features
Advanced inventory integration tools
Automatic restocking programs
Cold-chain logistics support
Clinical documentation and drug interaction resources
Access to pharmaceutical consultation services
Regulatory compliance assistance
Benefits
Reduced inventory shortages
Improved clinical decision support
Regulatory confidence
Typical Value Add
Clinical usage insights
Pharmacovigilance reporting tools
4. Enterprise Tier – Strategic Healthcare Partnership
Target: Large hospital groups, pharmacy chains, healthcare organizations
Purpose: Deliver large-scale pharmaceutical supply management and operational optimization.
Key Features
Custom pricing agreements
Dedicated supply chain management team
Predictive demand forecasting
Integrated procurement systems (ERP/API integration)
24/7 priority logistics support
Multi-location account management
Benefits
Optimized drug procurement
Reduced operational costs
Improved supply continuity
Typical Value Add
Annual strategic planning sessions
Bulk purchase incentives
5. Innovation Tier – Research & Development Collaboration
Target: Research institutions, biotech partners, academic hospitals
Purpose: Enable collaborative research and clinical development partnerships.
Key Features
Access to investigational compounds
Clinical trial support services
Research data collaboration platforms
Regulatory submission support
Pharmacokinetic and pharmacodynamic consultation
Benefits
Accelerated drug development
Improved trial management
Access to cutting-edge therapies
Typical Value Add
Co-authored research opportunities
Shared intellectual insights
6. Strategic Alliance Tier – Integrated Pharmaceutical Partnership
Target: Government health systems, global hospital networks, strategic partners
Purpose: Establish long-term integrated partnerships that extend beyond supply into innovation and health outcomes.
Key Features
Long-term supply agreements
Custom drug development partnerships
Population health analytics
Global logistics infrastructure
Joint commercialization opportunities
Executive-level collaboration teams
Benefits
End-to-end pharmaceutical ecosystem support
Reduced system-wide healthcare costs
Access to breakthrough therapies
Typical Value Add
Co-branded innovation programs
Public health initiatives
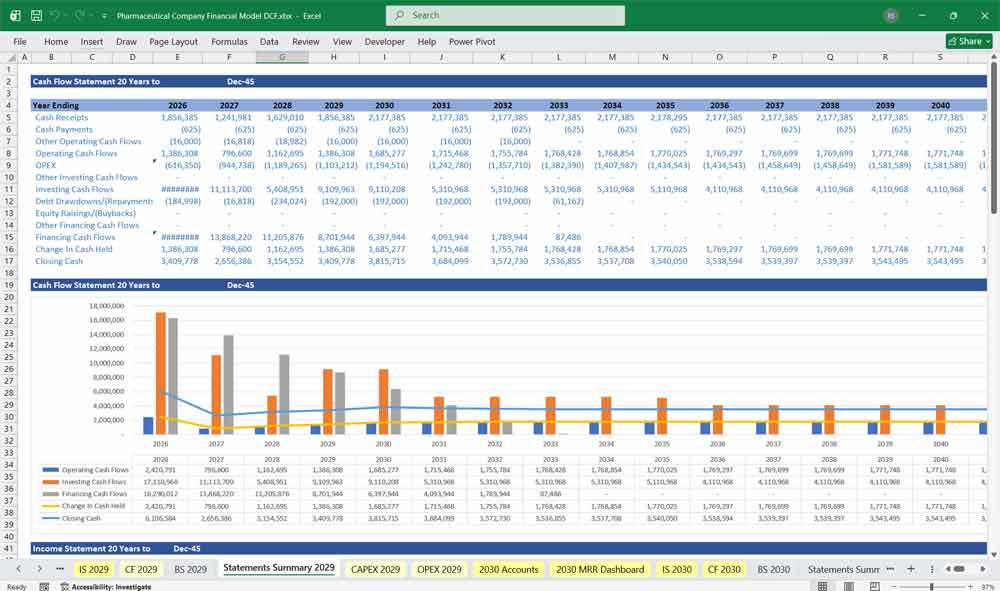
Value Your Pharmaceutical Manufacturing With A DCF Model
DCF: Valuing the Lifecycle and the “Patent Cliff”
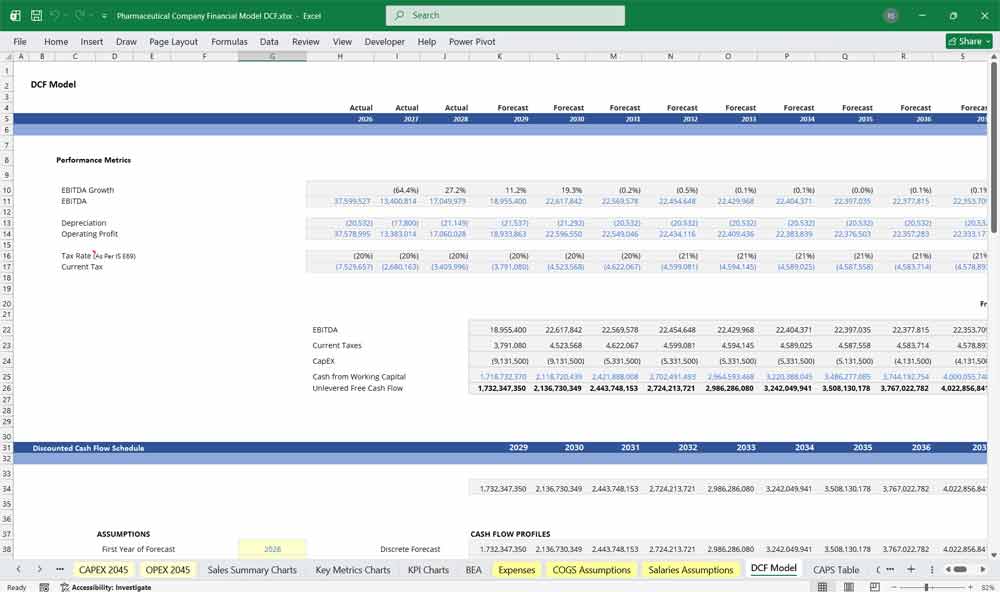
This 20-year Discounted Cash Flow (DCF) is a valuation method used to estimate the intrinsic value of a pharmaceutical company by forecasting its future cash flows and discounting them back to their present value. In the pharmaceutical industry, DCF models typically incorporate revenue projections from approved drugs, expected launches from the development pipeline, patent expiration timelines, and R&D spending. Because pharmaceutical firms often have long development cycles and high upfront research costs, the DCF approach helps investors evaluate whether the future cash flows from successful drug commercialization justify the current investment.
WACC: Pricing Regulatory Hurdles and Clinical Binary Risk
The Weighted Average Cost WACC represents the average rate of return that a pharmaceutical company is expected to pay its investors, including both equity holders and debt providers. It is used as the discount rate in a DCF model because it reflects the overall risk and capital structure of the company. For pharmaceutical firms, WACC may be influenced by factors such as regulatory risk, patent protection, R&D uncertainty, and market competition. A higher perceived risk in drug development or approval processes can increase the cost of capital, which lowers the present value of projected cash flows.
Sensitivity Analysis: Stress-Testing Pricing and “PTRS”
Sensitivity analysis is used in pharmaceutical financial modeling to assess how changes in key assumptions impact the company’s valuation. Since drug development outcomes, regulatory approvals, pricing pressures, and market adoption rates can vary significantly, analysts test scenarios where variables such as revenue growth, R&D success rates, or WACC change. This analysis helps investors and management understand the range of possible valuations and identify which factors have the greatest influence on the company’s financial outlook.
Final Notes on the Financial Model
Financial model for a Pharmaceutical Manufacturer
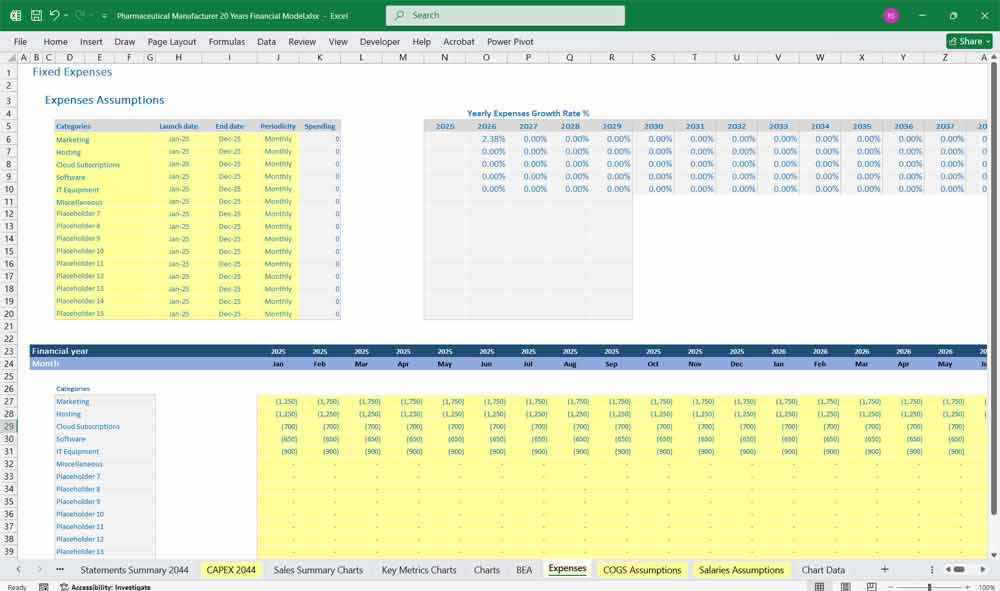
- Scenario Analysis: Create best-case, base-case, and worst-case projections.
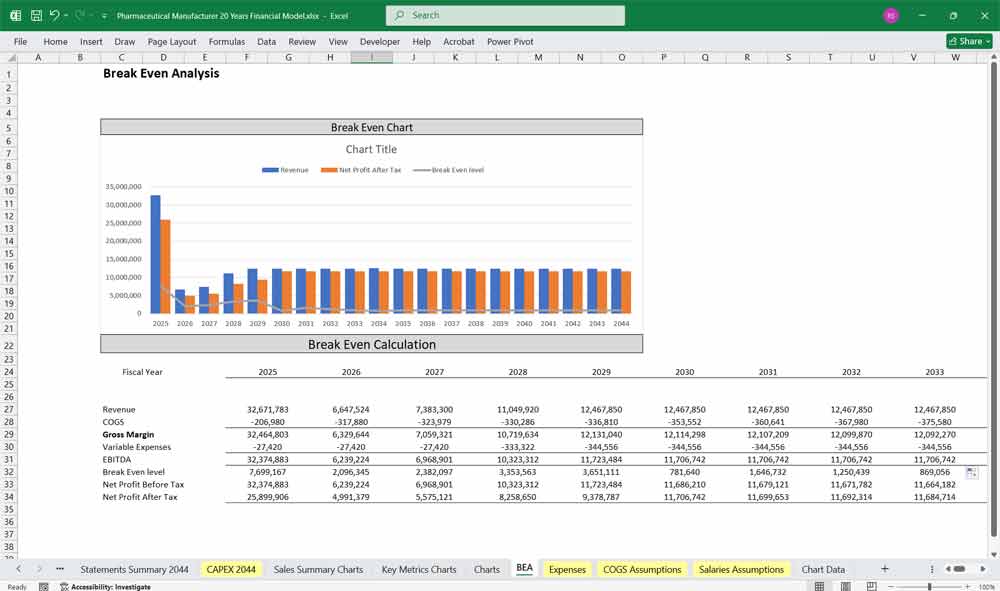
- Break-even Analysis: Determine the sales volume required to cover fixed & variable costs.
- Sensitivity Analysis: Assess how changes in raw material costs, pricing, or demand impact profitability.
This structured model helps a pharmaceutical manufacturing company address a broad market spectrum, offering the right balance between cost, production capacity, and support.
Download Link On Next Page
Download Link On Next Page