
Paper Mill Financial Model Template Excel
This Paper Mill Financial Model is a fully integrated Excel financial model built for pulp and paper mills, containerboard producers, tissue manufacturers and packaging paper operations. It combines three years of monthly historical data with a ten-year forecast, five years monthly with annual roundups and five years annual, so you can plan production, raw materials, energy, capex and financing in one bankable workbook. Every number flows through a linked income statement, balance sheet and cash flow statement.
Financial Model for a Paper Mill
Designed for mill owners, investors, lenders, consultants and corporate finance teams, this paper manufacturing financial model turns machine capacity, operating days, downtime, yields and product mix into tonnes produced and sold. It then layers on recovered paper and virgin pulp costs, electricity, gas, CHP generation, steam, water, carbon costs, labour and logistics. The result is a detailed, driver-based view of paper mill EBITDA, margins and cost per tonne.
Change one Model Start Date and the entire timeline re-dates automatically: every header, fiscal year, escalation index, commissioning date and debt maturity. A scenario selector switches between Base, Upside, Downside, Severe Downside and Custom cases. DCF valuation, equity IRR, sensitivity tables and 19 built-in integrity checks make this paper mill business plan template ready for feasibility studies, bank financing, acquisitions and board reporting.
What’s Inside: Tab-by-Tab Overview
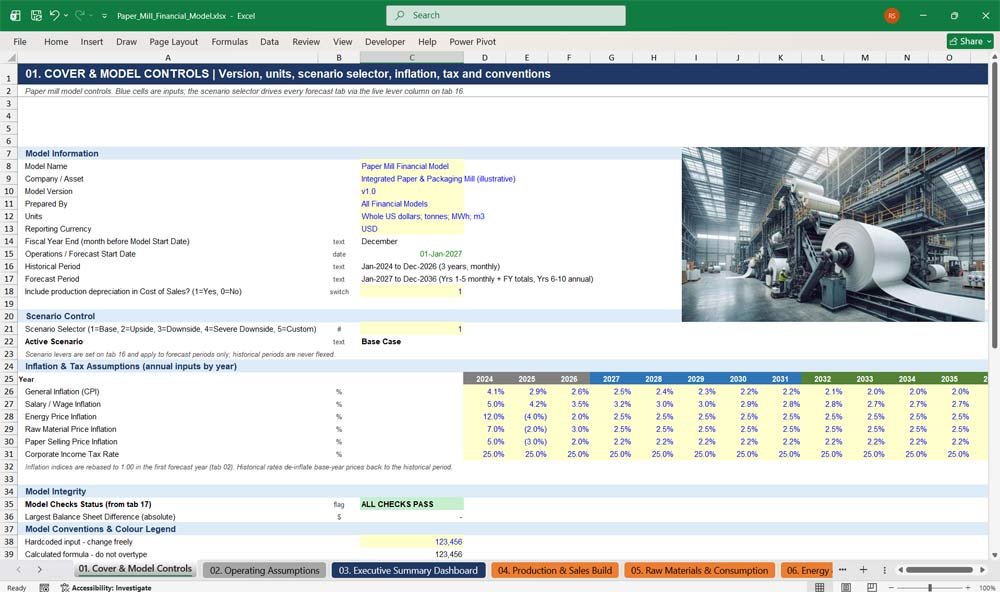
01. Cover & Model Controls
The control centre of the paper mill financial model. Set the model version, units, currency and fiscal year, choose the active scenario, and enter year-by-year inflation and corporate tax assumptions. A live status flag confirms all model checks pass before you share results.
- Scenario selector: Base, Upside, Downside, Severe Downside, Custom
- Annual CPI, wage, energy, raw material and selling price inflation
- Corporate tax rate by year
- Colour-coded legend and model conventions
- Hyperlinked table of contents to every tab
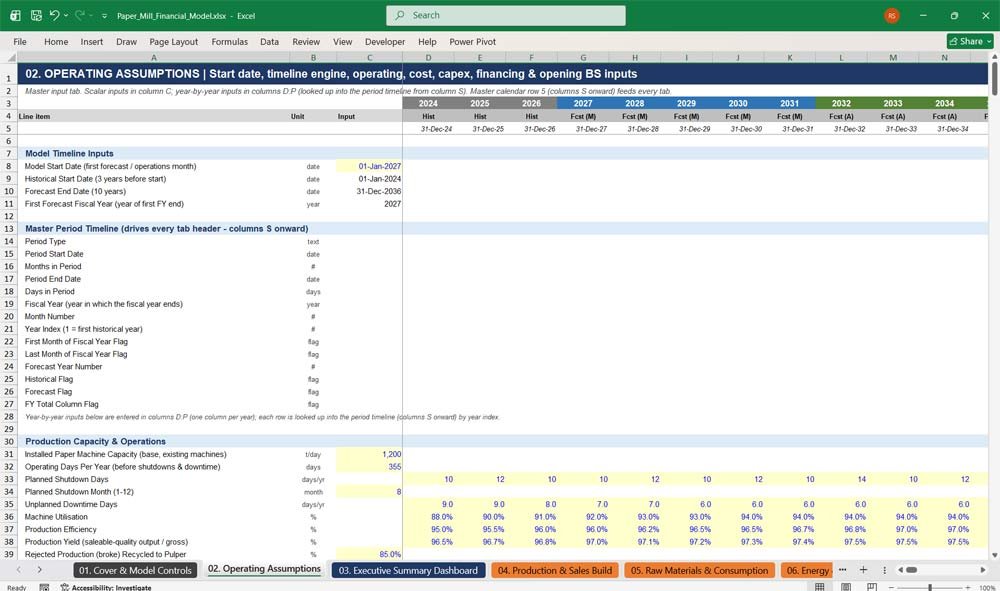
02. Operating Assumptions
The master input tab for your paper mill business plan. Enter the start date, machine capacity, operating days, shutdowns, downtime, yields, product mix, selling prices, raw material and energy costs, salaries, payment terms, capex, financing and the opening balance sheet, all in one place.
- Single Model Start Date drives the entire workbook
- Year-by-year input grids for utilisation, efficiency and yields
- Base-year prices for nine paper grades
- Capex programme, debt terms and dividend policy
- Self-balancing opening balance sheet
Paper Mill Revenues & Costs
03. Executive Summary Dashboard
A one-page paper mill performance dashboard for investors and lenders. Track revenue, EBITDA, EBITDA margin, tonnes produced and sold, capacity utilisation, free cash flow and net debt across all thirteen years, with headline valuation, equity returns and key sensitivities.
- Annual KPI summary for history and forecast
- Revenue and EBITDA chart, plus net debt and free cash flow chart
- Enterprise value, equity value, IRR and MOIC
- EBITDA impact of price, fibre, energy and volume changes
- Live model check status
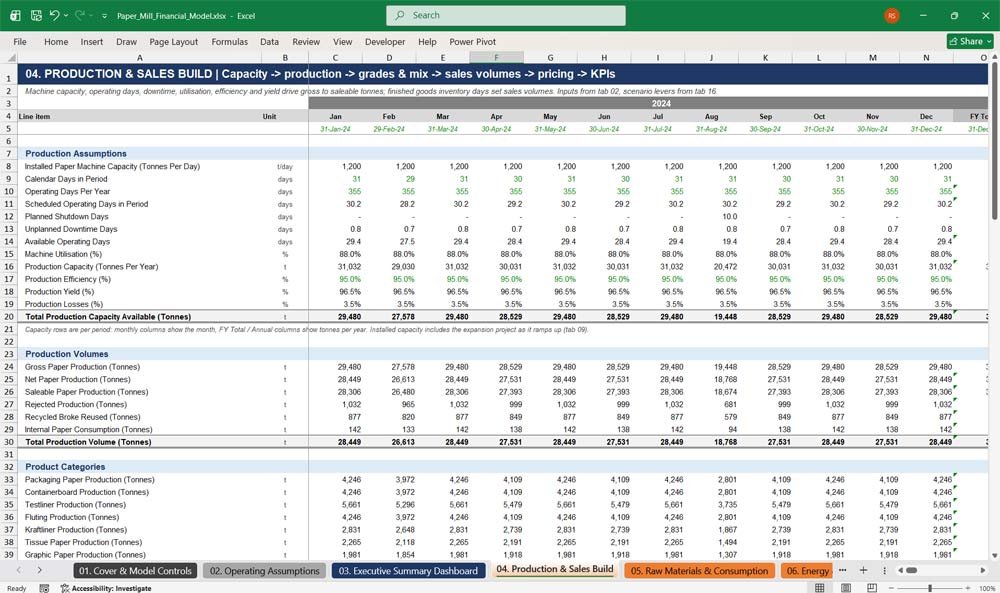
04. Production & Sales Build
The operational engine of the paper production model. Machine capacity in tonnes per day, operating days, planned shutdowns, unplanned downtime, utilisation, efficiency and yield calculate gross, net and saleable paper production, then split it across grades, markets and finished goods inventory.
- Capacity build from tonnes per day to tonnes per year
- Nine product grades including containerboard, testliner, fluting, kraftliner and tissue
- Domestic, export and intercompany sales volumes
- Grade-level selling prices with inflation
- Production KPIs including tonnes per employee and downtime
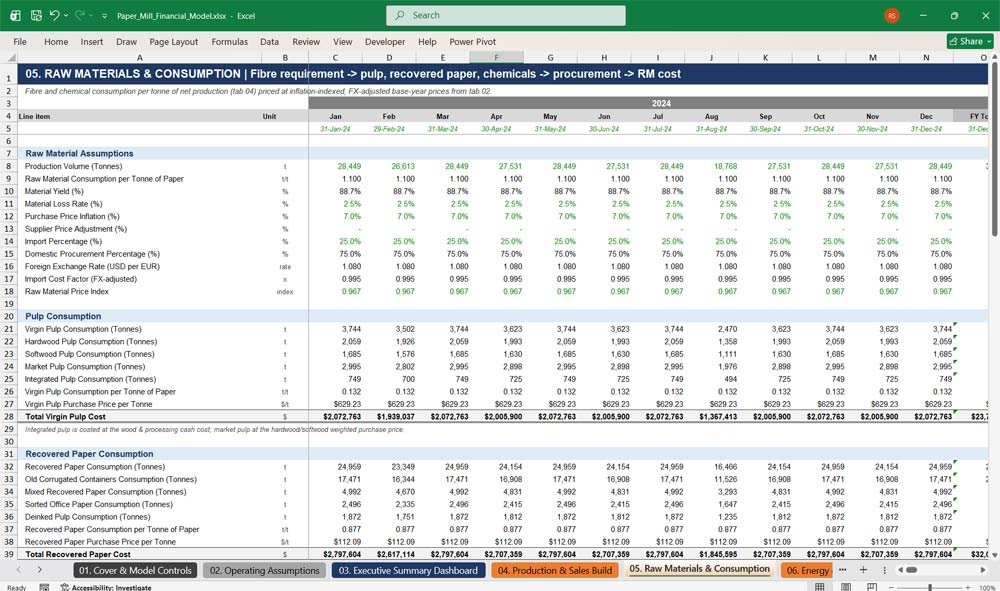
05. Raw Materials & Consumption
Model fibre and chemical costs with precision. Calculate virgin pulp, hardwood, softwood, market and integrated pulp, recovered paper (OCC, mixed, sorted office), purchased pulp, alternative fibre and ten chemical additives, with FX-adjusted import pricing, freight, duties and raw material inventory.
- Fibre requirement per tonne with material losses and broke reuse
- Recovered paper and virgin pulp price builds
- Starch, fillers, calcium carbonate and coating chemicals
- Raw material procurement and inventory in tonnes
- Raw material cost per tonne and percentage of revenue
06. Energy & Utilities
A detailed paper mill energy model covering electricity by process area, grid, contracted, spot and renewable purchases, on-site CHP power generation, natural gas, biomass, coal, steam, water and wastewater, plus carbon emissions, emissions trading costs and energy hedging.
- Electricity consumption across nine process areas in MWh
- Combined heat and power generation and fuel cost
- Steam balance and boiler utilisation
- Scope 1 and Scope 2 emissions with carbon pricing
- Energy hedging, unhedged exposure and energy cost per tonne
07. Labour & Other Operating Costs
Build your mill’s operating cost base. Headcount by department drives salaries, overtime, shift allowances, bonuses, payroll taxes, pensions and benefits, alongside maintenance, utilities, manufacturing overheads, logistics and distribution, SG&A and other operating costs, all escalated with inflation.
- Eight departments with hires, attrition and closing headcount
- Full maintenance budget including planned shutdowns and overhauls
- Manufacturing overheads, logistics and export shipping costs
- SG&A and other operating costs
- Fixed versus variable cost split and cost per tonne
Paper Mill Financial Statements
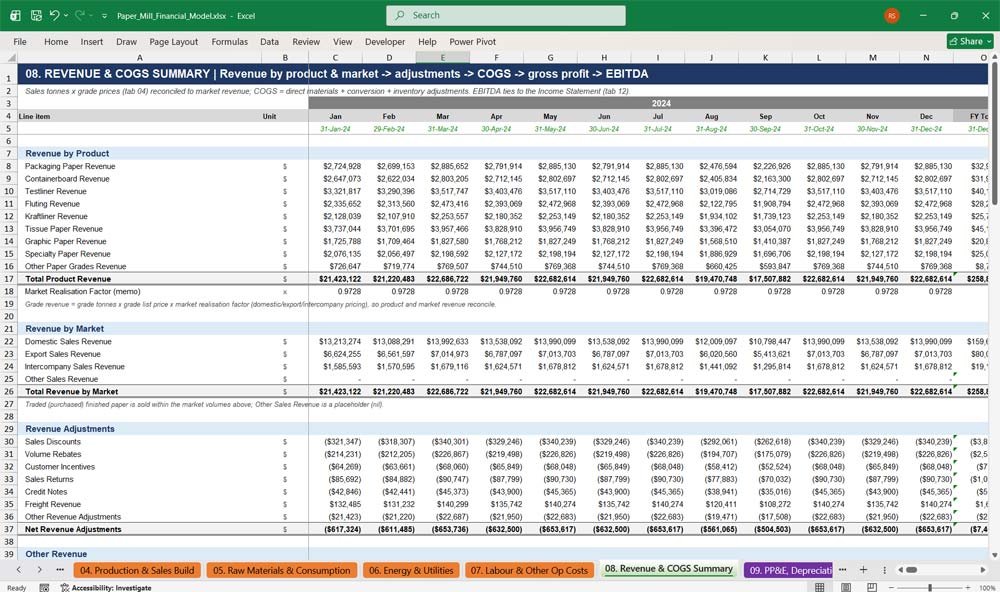
08. Revenue & COGS Summary
Bring revenue and cost of goods sold together. Revenue by product reconciles to revenue by market, with discounts, rebates, returns and freight recharges. Direct materials, conversion costs and inventory adjustments build total COGS, gross profit and paper mill EBITDA.
- Revenue by product and by market, fully reconciled
- Revenue adjustments and other revenue such as scrap, energy and steam sales
- Direct material and conversion cost breakdown
- Inventory adjustments for WIP and finished goods
- Gross profit, EBITDA, EBIT and per-tonne margins
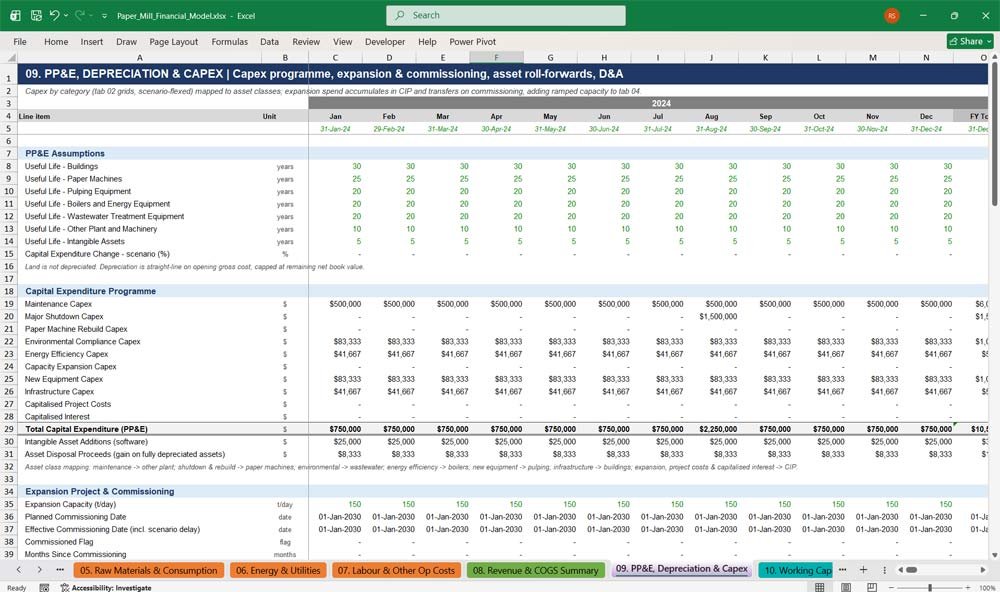
09. PP&E, Depreciation & Capex
Plan capital investment for paper machines, boilers, pulping equipment and environmental assets. Capex by category maps to asset classes, expansion spending accumulates in construction in progress and transfers on commissioning, with ramp-up capacity flowing straight into production.
- Ten capex categories including maintenance, rebuild and expansion
- Capacity expansion project with commissioning date and ramp-up
- Asset roll-forwards for six asset classes plus land and CIP
- Straight-line depreciation by useful life
- Intangible and right-of-use asset schedules
10. Working Capital
A days-based working capital model for a paper mill. Calculate receivables by market, raw material, WIP, finished goods and spare parts inventory, supplier payables by category, accruals, VAT and customer deposits, with full cash flow impact and net working capital days.
- Domestic, export and intercompany receivables
- Expected credit loss allowance and bad debt expense
- Inventory balances with obsolescence provision
- Payables for raw materials, chemicals, energy, maintenance and logistics
- Net operating working capital summary and cash impact
11. Debt & Interest
A lender-ready debt schedule covering senior debt, term loans, a revolving credit facility, shareholder loans, other debt and lease liabilities. An automatic revolver protects minimum cash, a cash sweep repays senior debt, and covenant metrics track leverage, coverage and liquidity.
- Drawdowns, scheduled repayments, prepayments and bullet maturity
- Revolver drawdowns and repayments to maintain minimum cash
- Cash sweep, arrangement fees and commitment fees
- Capitalised interest during construction
- Net debt to EBITDA, DSCR, interest cover and covenant headroom
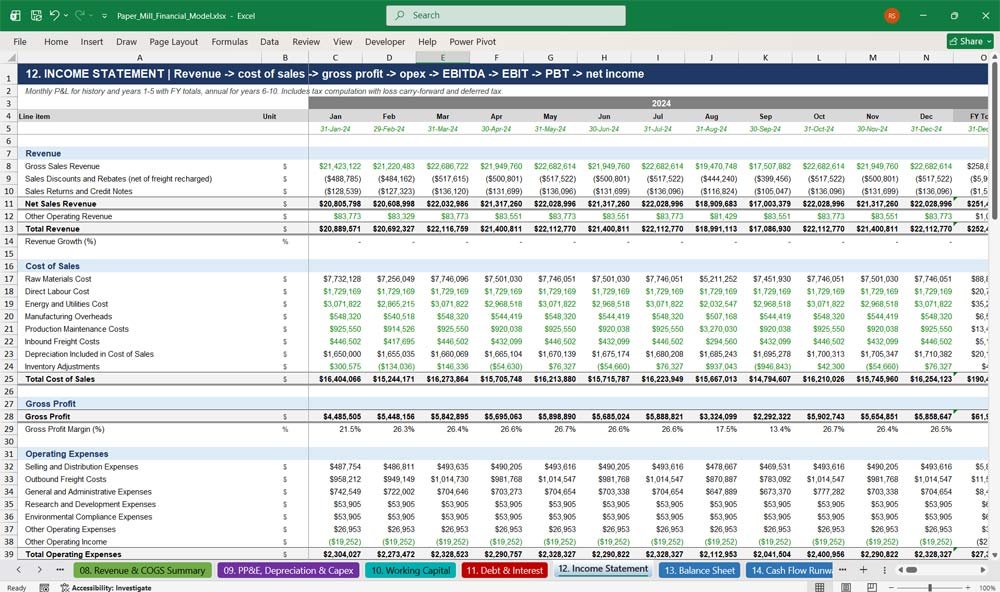
12. Income Statement
A complete monthly and annual profit and loss statement for the paper mill. Gross sales flow through discounts, cost of sales, operating expenses, exceptional items, depreciation, finance costs and tax to net income, with a full tax computation including losses and deferred tax.
- Revenue, cost of sales and gross profit
- Adjusted and reported EBITDA with margins
- Depreciation by asset type and EBIT
- Tax computation with loss carry-forward and deferred tax
- Earnings per share and per-tonne profitability KPIs
13. Balance Sheet
A fully balancing paper mill balance sheet for every month and year. Assets, liabilities and equity link directly from the supporting schedules, with a balance check, net working capital, net debt, tangible net worth and roll-forward reconciliations for cash, debt, PP&E and retained earnings.
- Current assets including detailed inventory categories
- Gross PP&E by asset class less accumulated depreciation
- Current and non-current debt and lease classification
- Shareholders’ equity with year-to-date income and dividends
- Balance check and roll-forward reconciliations
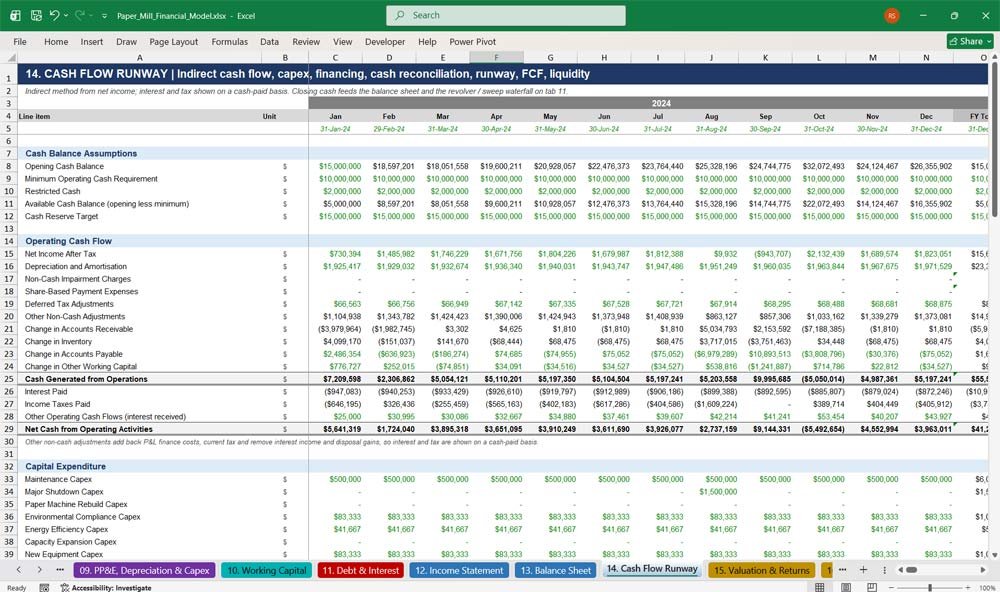
14. Cash Flow Runway
An indirect cash flow statement with liquidity analysis. Operating, investing and financing cash flows reconcile opening to closing cash, while the runway section measures cash burn, available liquidity and funding requirements. Unlevered and levered free cash flow support valuation and lending decisions.
- Operating cash flow with working capital movements
- Capex by category and asset disposal proceeds
- Debt, lease, equity and dividend financing flows
- Cash runway, liquidity shortfall and funding requirement
- Free cash flow margin, conversion and cash conversion cycle
Key Financial Metrics for a Paper Mill
15. Valuation & Returns
Value the paper mill and measure investor returns. A WACC-based DCF with terminal value sits alongside trading and transaction multiples, an enterprise-to-equity bridge and exit valuation. Equity IRR, MOIC, cash yield and payback period show the investment case clearly.
- WACC build from cost of equity and cost of debt
- Ten-year unlevered DCF with mid-year convention
- Trading and precedent transaction multiples
- Exit valuation at a chosen exit year
- Equity IRR, MOIC, cash yield and payback period
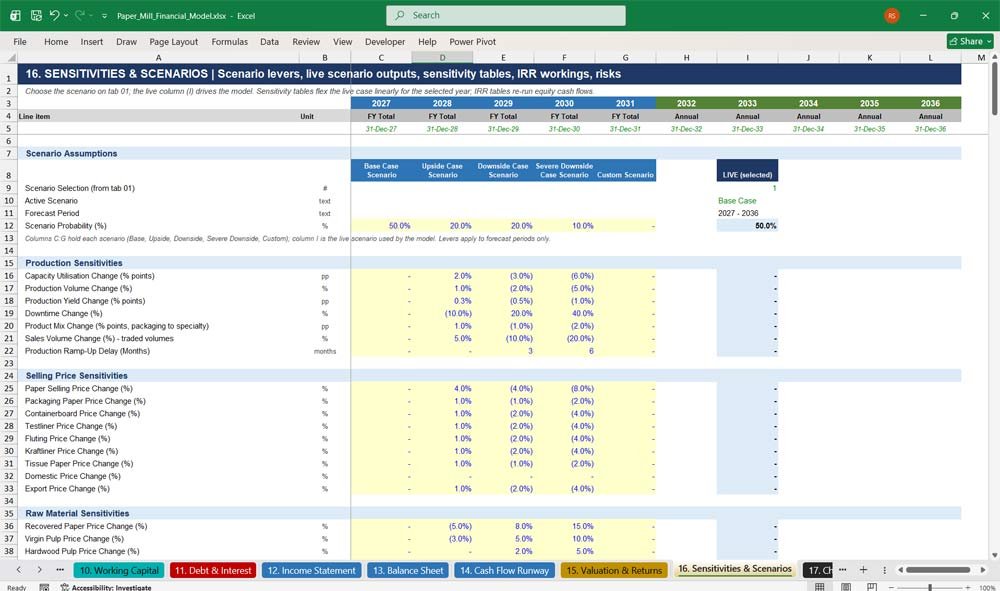
16. Sensitivities & Scenarios
Stress-test the paper mill business plan. Fifty-plus scenario levers cover production, prices, fibre, energy, operating costs, finance and capex risks across five scenarios. Two-way sensitivity tables, IRR sensitivities and a structured risk register show what really moves value.
- Five scenarios with a live selected column
- Production, price, raw material and energy levers
- Scenario output table for the live case
- Two-way tables for price versus fibre and electricity costs
- Equity IRR versus exit multiple and exit year, plus risk analysis
17. Checks & Reconciliation
Confidence built in. Nineteen integrity checks run every period, covering balance sheet balancing, cash and debt roll-forwards, production-to-sales, PP&E, revenue, EBITDA, COGS, energy and formula errors, with a clear PASS or REVIEW flag per month and year.
- Balance sheet, cash and debt roll-forward checks
- Production-to-sales and product mix checks
- PP&E, depreciation and capex reconciliations
- Revenue, EBITDA and cost cross-checks
- Formula error count with colour-coded PASS / REVIEW flags
Why Buy This Model
Building a credible paper mill financial model from scratch takes weeks of specialist work, and a single broken link can undermine a bank submission or investment decision. This template gives you a professionally structured, fully linked model that already captures the economics that matter in pulp and paper: capacity and downtime, fibre mix, recovered paper and pulp prices, energy and CHP, carbon costs, maintenance shutdowns and expansion projects. It follows lender-style formatting, with blue inputs, black formulas and green links, so reviewers can audit it quickly. Everything is driven from clear inputs, one start date re-dates the whole model, and scenario levers and sensitivity tables let you answer “what if” questions in seconds. With integrated financial statements, DCF valuation, debt covenants and 19 automated checks, you get a decision-ready tool you can adapt to your mill and present with confidence.
Paper Milling Frequently Asked Questions
Is this model suitable for my type of mill? We produce tissue, not containerboard.
Yes. The model covers nine product grades: packaging paper, containerboard, testliner, fluting, kraftliner, tissue, graphic, specialty and other grades. Set the mix to match your mill, for example 100% tissue, and enter your own prices and cost assumptions.
Can I use it for a new greenfield mill, not just an existing operation?
Yes. The model includes a capacity expansion project with construction in progress, commissioning date, ramp-up period and capitalised interest. For a greenfield mill, set low opening balances and use the capex, equity and debt inputs to fund construction.
How do I change the timeline? Our financial year doesn’t start in January.
Change the Model Start Date on tab 02 and every date in the workbook updates automatically. If you start in April, for example, the model uses an April to March fiscal year and labels each year by the year in which it ends.
What timeline does the model cover?
Three historical years shown monthly, then a ten-year forecast. Years 1 to 5 are monthly, with an annual roundup column for each year, and Years 6 to 10 are annual.
Do I need advanced Excel skills to use it?
No. All inputs are blue cells on yellow backgrounds, mainly on tab 02. Formulas are black and links between tabs are green, so you know exactly what to change and what to leave alone. Each tab has a title band explaining what it contains.
Does it include macros or VBA?
No. The model is built entirely with standard Excel formulas, with no macros and no circular references. It opens and calculates normally in Microsoft Excel.
Can I run different scenarios?
Yes. Choose Base, Upside, Downside, Severe Downside or Custom on tab 01. Tab 16 holds over 50 scenario levers covering utilisation, prices, recovered paper, pulp, energy, wages, interest rates, capex overruns and commissioning delays.
Will the balance sheet actually balance?
Yes. The income statement, balance sheet and cash flow are fully integrated, and the balance sheet balances in every month and year. Tab 17 confirms this alongside 18 other checks, and the cover shows “ALL CHECKS PASS”.
Is it suitable for a bank loan or investor presentation?
Yes. It includes a full debt schedule with senior debt, a term loan, a revolving credit facility and a cash sweep. Covenant metrics such as net debt to EBITDA, DSCR and interest cover sit alongside a DCF valuation, equity IRR and an executive dashboard designed for lenders and investors.
How does the model handle energy costs, which are a big part of our costs?
Tab 06 models electricity by process area, grid and contracted purchases, spot and renewable power, on-site CHP generation, natural gas with hedging, biomass, coal, steam, water and carbon costs. It reports energy cost per tonne and energy intensity.
Can I value the business?
Yes. Tab 15 calculates a WACC-based DCF, trading and transaction multiples, and an enterprise-to-equity bridge. It also produces a weighted selected valuation, exit value, equity IRR, MOIC and payback period.
Are the numbers in the template real data?
No. The model comes pre-filled with illustrative assumptions for a typical mid-sized mill so you can see how it works. Replace the blue inputs with your own mill’s data to produce your plan.
What currency is the model in?
The model is presented in US dollars. Imported raw materials can be priced against a EUR/USD exchange rate. You can relabel the currency on tab 01 and enter your own values in any currency.
Can I add more product grades, departments or capex projects?
Yes. The model is fully unlocked, so experienced Excel users can extend it. Follow the existing row patterns and the checks on tab 17 will help confirm that everything still reconciles. If you need further work to this model, talk to us, there is rarely any charge for model reworking.
Final Notes on the Financial Model
This 5 Year Paper Mill Financial Model must focus on balancing capital expenditures with steady revenue growth from reliable revenue-raising services. By optimizing operational costs, and power efficiency, and maximizing high-margin services like Finished Paper Products, Pulp, Cardboard and Custom Orders, this 20-year model ensures sustainable profitability and cash flow stability.