
Mobile App DCF Financial Model (2026 Excel)
This 5-Year, 3-Statement Mobile App DCF Financial Model (2026 Excel) includes revenue streams, cost structures, Discounted Cash Flow (DCF) with Terminal Value, Sensitivity Analysis, WACC, and financial statements to forecast the financial health of a mobile application. The model assumes revenue generation through subscriptions, in-app purchases, advertisements, and partnerships for total tracking of financial revenue for your mobile app.
DCF Financial Model for a Mobile App
A mobile app can generate revenue from various sources, including:
- Subscription Model (multi-tier pricing)
- In-App Purchases (one-time purchases, premium content, virtual goods)
- Advertising Revenue (banner ads, video ads, affiliate marketing)
- Sponsorships & Partnerships (corporate sponsorships, co-branded content)
- Freemium Model Upsells (free version with paid upgrades)
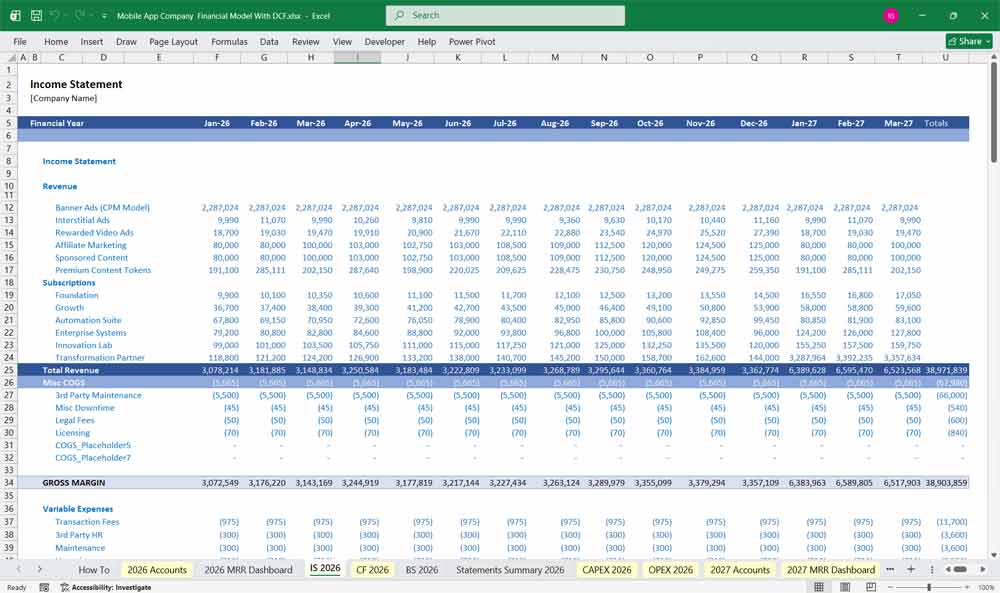
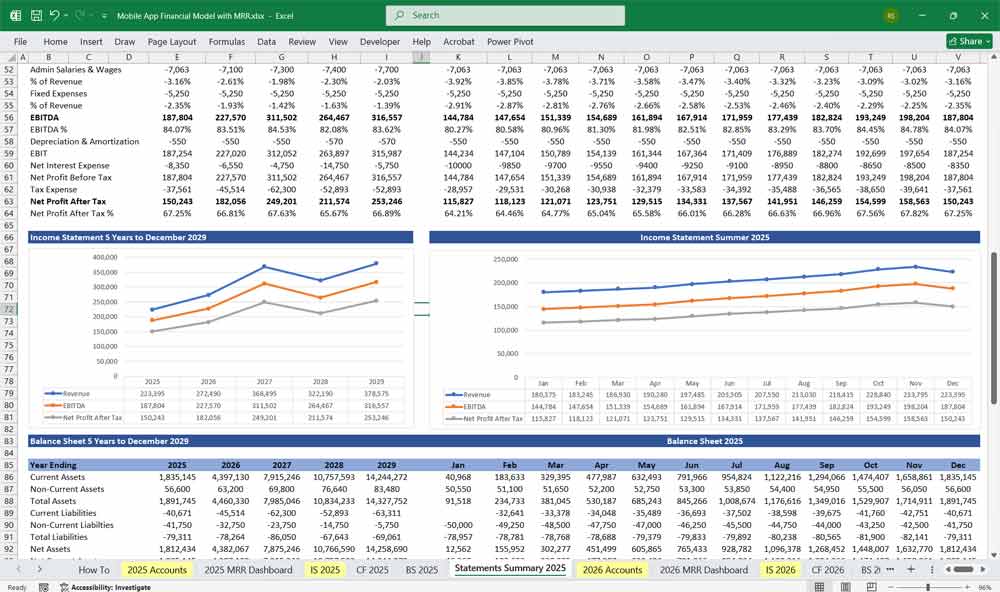
Income Statement (Profit & Loss Statement)
The income statement outlines revenue, expenses, and net income over a period.
Revenue:
- Subscription Revenue – Based on a 6-tier subscription model.
- In-App Purchases – Revenue from one-time purchases.
- Advertising Revenue – Revenue from ad networks, sponsorships.
- Partnership Revenue – Deals with brands or other apps.
Cost of Goods Sold (COGS):
- Payment Processing Fees – Fees from App Store, Google Play, Stripe, etc.
- Server Costs – Hosting, cloud storage, bandwidth.
- Customer Support – Personnel, chatbots, ticketing system.
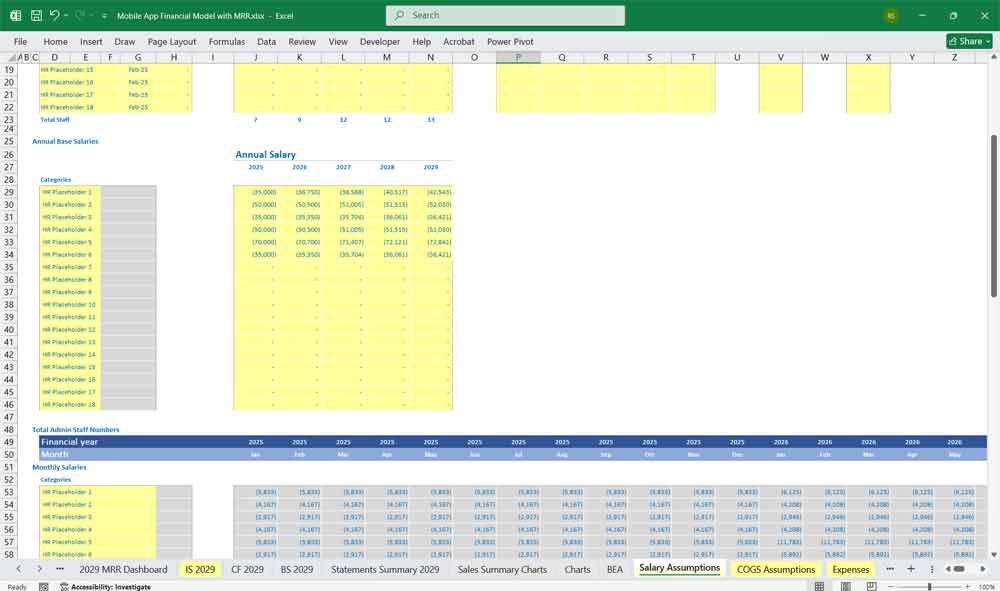
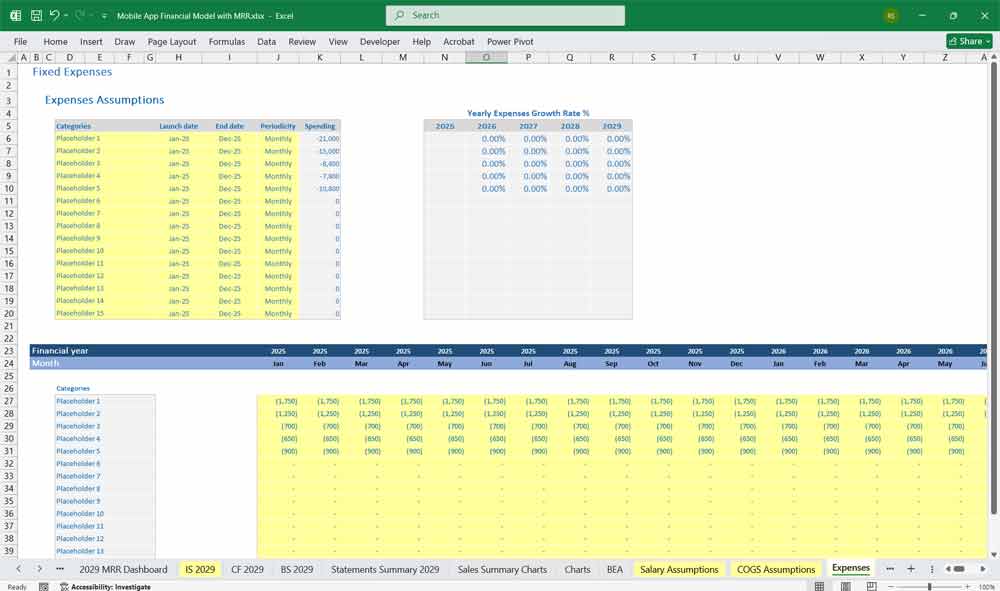
Operating Expenses:
- Development Costs – Salaries for developers, designers, QA teams.
- Marketing & User Acquisition – Social media ads, influencer marketing.
- Administrative Expenses – Office rent, legal fees, accounting.
Net Income Calculation:
Net Income = Total Revenue – (COGS + Operating Expenses + Taxes)
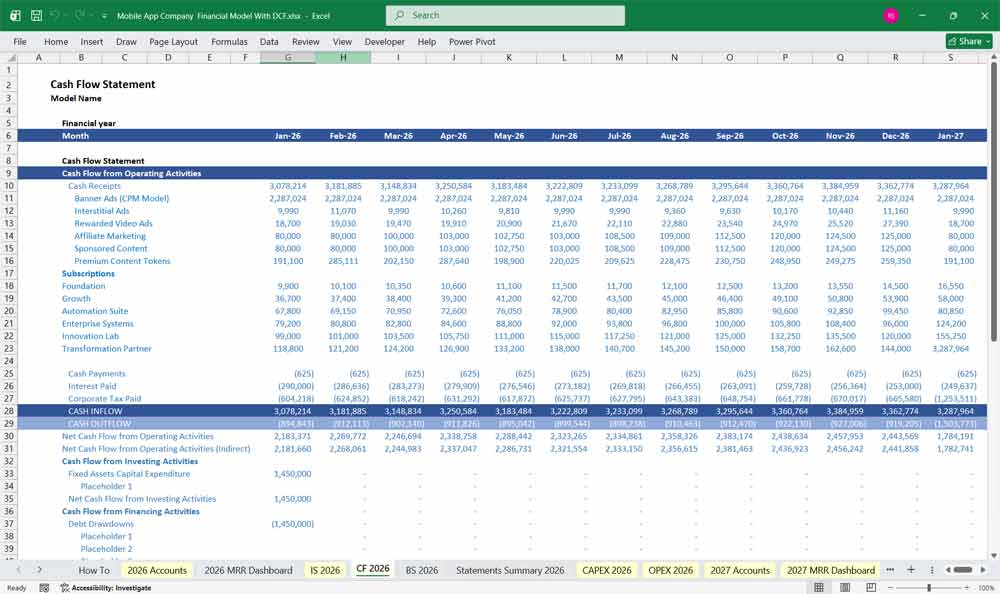
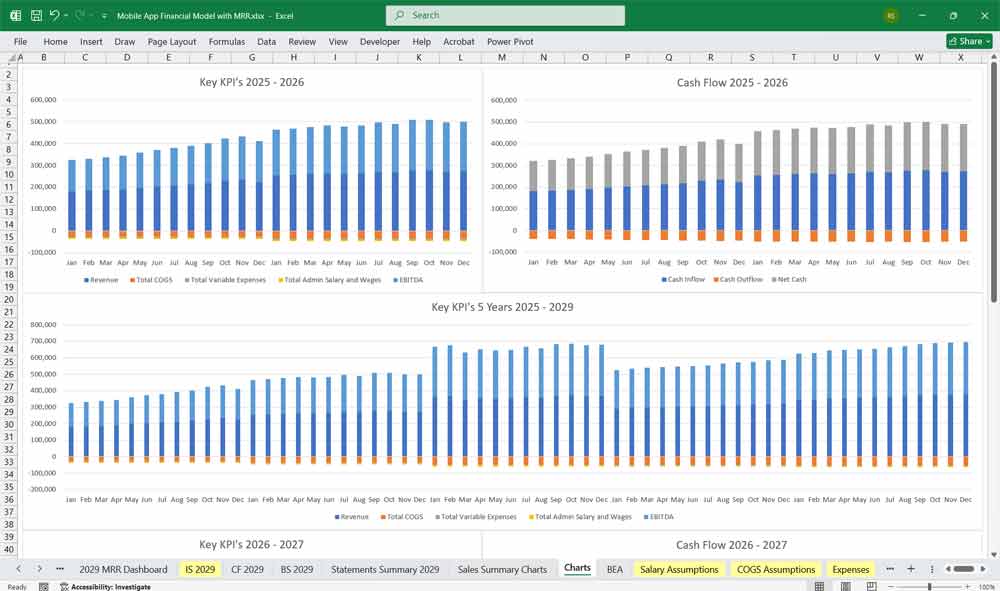
Mobile App Cash Flow Statement
The cash flow statement tracks cash inflows and outflows to assess liquidity.
Operating Cash Flow:
- Cash Inflows:
- Subscription payments
- Ad revenue payouts
- In-app purchase payments
- Cash Outflows:
- Server costs, payroll, marketing expenses
- Payment processing fees
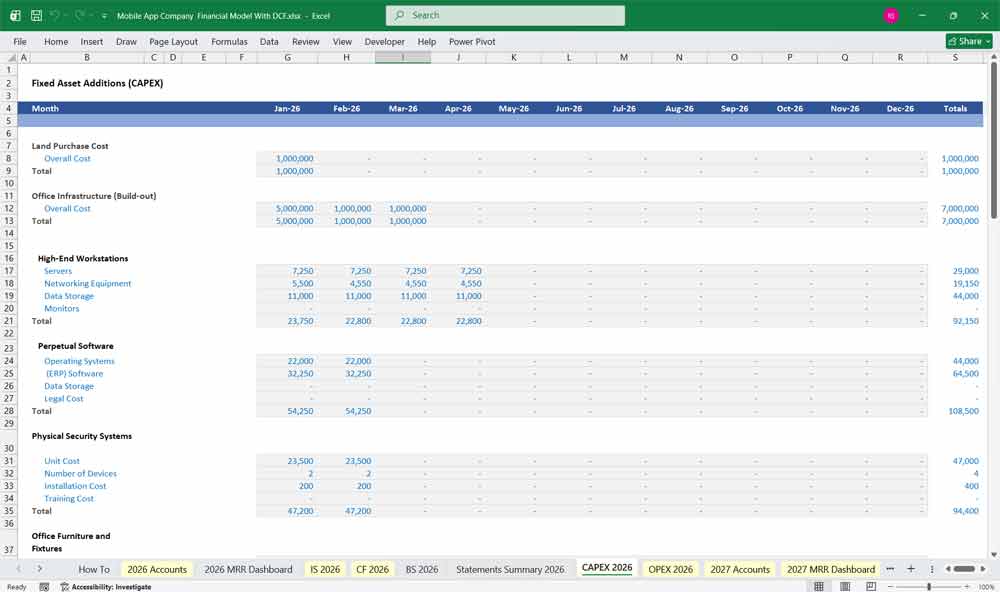
Investing Cash Flow:
- Investment in new features, platform updates
- Capital expenditures (new server infrastructure)
Financing Cash Flow:
- Investment from venture capital or angel investors
- Loan repayments (if applicable)
Net Cash Flow = Total Inflows – Total Outflows
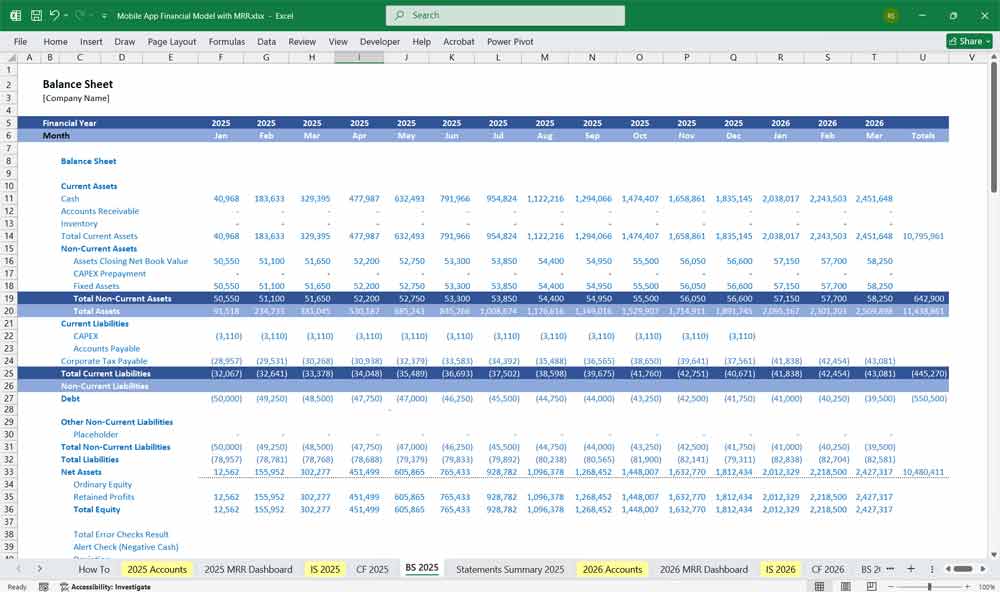
Mobile App Balance Sheet
The balance sheet provides a snapshot of the app’s financial position.
Assets:
- Current Assets:
- Cash & cash equivalents
- Accounts receivable (ad network payments pending)
- Subscription revenue due (deferred revenue)
- Long-term Assets:
- Software development costs (capitalized R&D)
- Servers, equipment
Liabilities:
- Current Liabilities:
- Vendor payments
- Ad payout obligations
- Taxes payable
- Long-term Liabilities:
- Loans, venture funding
- Deferred revenue from annual subscriptions
Equity:
- Retained earnings
- Shareholder equity (if funded by investors)
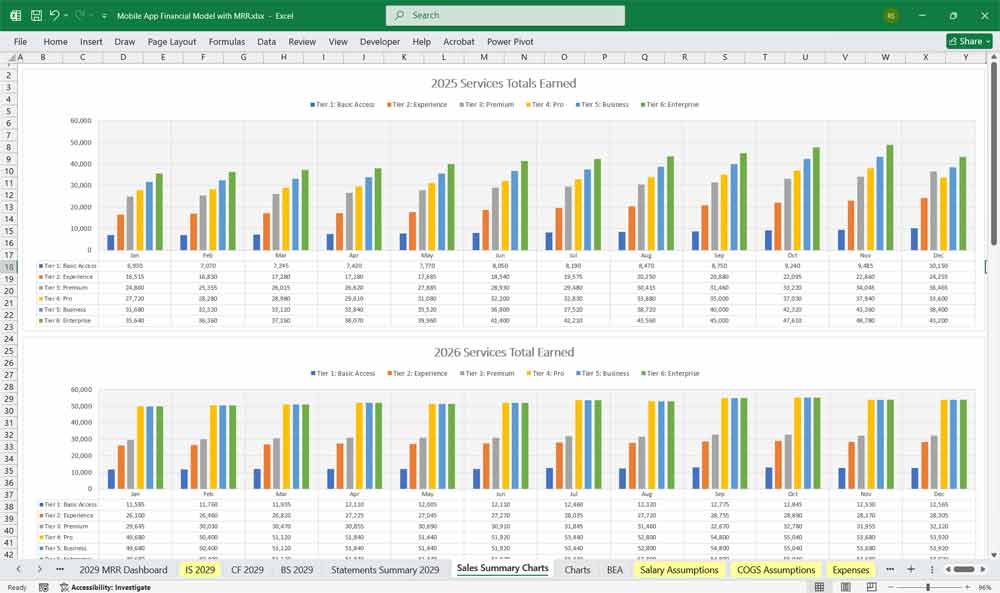
6-Tier Subscription Ideas for a Mobile App
A tiered subscription model maximizes revenue by offering varied features at different price points.
Subscription Tiers:
Tier 1: Free (Forever)
Price: $0/month
Target: Casual users, students, entry-level professionals
Features:
Basic task management (up to 50 tasks/month)
Simple Pomodoro timer (25/5 min only)
1 basic focus sound playlist
3 project templates
Limited task history (30 days)
Community support only
Monetization: Ad-supported (non-intrusive banner ads
Tier 2: Explorer
Price: $2.99/month or $29/year
Target: Serious individuals, freelancers, students
Features: (Everything in Free, plus:)
Ad-free experience
Unlimited tasks & projects
Advanced Pomodoro (custom intervals)
10+ focus sound playlists
15+ premium templates
Task priority labeling
6-month task history
Basic export (CSV/PDF)
Email mobile app support (48hr response)
Early access to new features
Tier 3: Pro
Price: $7.99/month or $79/year
Target: Professionals, solopreneurs, power users
Features: (Everything in Explorer, plus:)
AI Task Assistant (basic)
Calendar integration (2-way sync)
Focus analytics (weekly reports)
Custom project templates
Priority mobile app support (24hr response)
2-year task history
Advanced export options (Excel, JSON)
Cloud backup (encrypted)
2 “guest collaborator” slots
1GB file storage
Tier 4: Team
Price: $12.99/user/month or $129/user/year
Target: Small teams (3-10 people), startups
Features: (Everything in Pro, plus:)
Team workspaces
Shared projects & templates
Team productivity analytics
Role-based permissions
Team goal tracking
Meeting agenda templates
10GB mobile app shared file storage
Admin controls
Standard onboarding support
Monthly team reports
Minimum: 3 users
Tier 5: Enterprise
Price: $24.99/user/month (annual billing only)
Target: Medium to large organizations (10+ users)
Features: (Everything in Team, plus:)
Dedicated success manager
Custom onboarding & training
Single Sign-On (SSO) integration
Advanced mobile app security & compliance (GDPR, HIPAA-ready)
Custom feature requests (quarterly review)
API access
Unlimited file storage
Custom contract/SLA
On-premise deployment option
24/7 priority support
Minimum: 10 users
Annual commitment required
Tier 6: Enterprise Plus
Price: Custom (typically $39.99+/user/month)
Target: Large corporations, government, institutions
Features: (Everything in Enterprise, plus:)
White-label mobile app option
Full custom development (dedicated engineer)
Dedicated infrastructure
On-site training sessions
Executive analytics dashboard
Custom integration development
Quarterly strategy sessions
Disaster recovery guarantee
Advanced mobile app AI customization
Industry-specific compliance packages
Minimum: 50 users
3-year contract preferred
Key Implementation Mobile App Financial Strategies
Pricing Psychology:
Clear value stacking (each tier = 2-3x more value)
Annual discounts (save 15-20%)
Free trial for paid tiers (14 days)
Easy downgrade/upgrade paths
Churn Analysis for your Mobile App
Churn is one of the biggest revenue killers for App Developer services. A 1% reduction in churn can significantly increase profits over time. Analyzing churn by subscription tier, revenue impact, and reasons for cancellation helps implement data-driven retention strategies to maximize long-term user value.
Strategies to Reduce Churn
Retention Strategies
✅ Content Personalization: Use AI-driven recommendations to increase engagement.
✅ Loyalty Programs: Discounts for long-term subscribers.
Payment Recovery for Involuntary Churn
✅ Automated Payment Retries: Retries for failed transactions.
✅ Card Update Reminders: Notifications for expiring payment methods.
Engagement Tactics
✅ Win-Back Campaigns: Email campaigns offering discounts to churned users.
✅ Surveys & Exit Polls: Understand cancellation reasons and address pain points.
Advertising & Additional Revenue Models
A. Ad Revenue Streams For Your Mobile App
- Banner Ads (CPM Model)
- Displayed on UI screens ($1–$5 per 1,000 impressions)
- Interstitial Ads
- Shown between app transitions (higher CPM: $5–$20)
- Rewarded Video Ads
- Users watch an ad to gain an in-app reward (engagement-focused)
- Affiliate Marketing
- Revenue-sharing by promoting third-party products
- Sponsored Content
- Paid sponsorships with brands
B. Mobile App Partnerships & Co-branding
- Cross-promotions with other apps
- Exclusive sponsorship deals
C. PAYG One-Time In-App Purchases
- Digital goods (stickers, skins, themes)
- Limited-time premium content
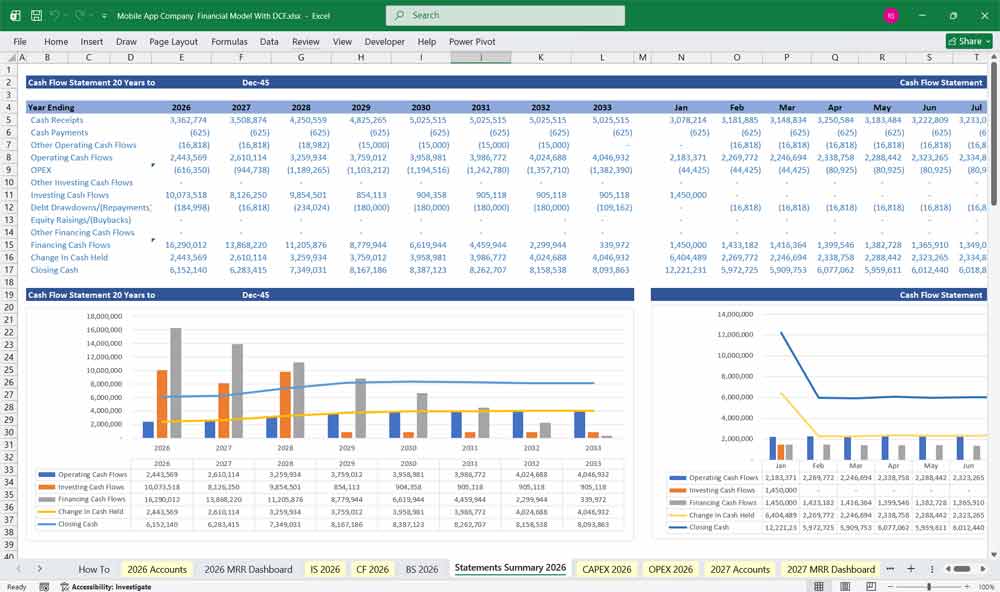
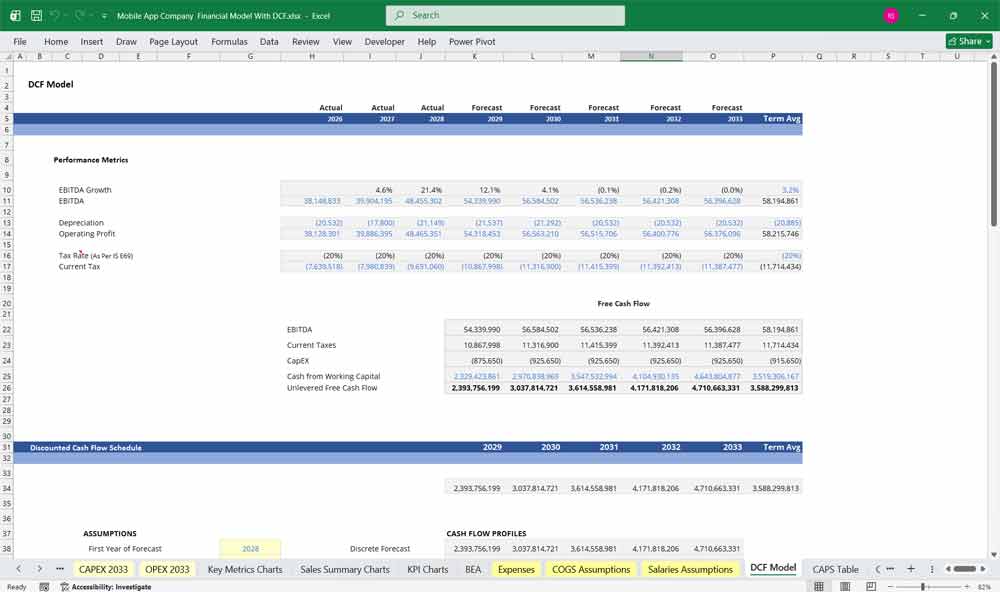
Valuing Your Mobile App With A DCF
Discounted Cash Flow (DCF): Valuing the “Pocket Real Estate”
This Discounted Cash Flow (DCF) analysis for a mobile app business estimates the company’s value based on projected future cash flows generated from app downloads, subscriptions, in-app purchases, advertising revenue, and partnerships. Revenue forecasts are driven by user acquisition, active user growth, monetization rates, and pricing strategies, while costs include app development, cloud hosting, marketing, customer support, and ongoing feature updates. The projected free cash flows over a defined growth period, along with a terminal value reflecting the app’s long-term user base and recurring revenue potential, are discounted to present value to determine the app’s intrinsic value.
WACC: Pricing Platform Risk and the “Gatekeeper Tax”
Weighted Average Cost of Capital (WACC) is used as the discount rate in valuing a mobile app company and reflects the blended cost of equity and debt financing. The risk profile of a mobile app business is influenced by rapid technological change, competition in app marketplaces, user retention challenges, platform dependency on app stores, and monetization uncertainty. The WACC incorporates investors’ required returns, the company’s capital structure, and any tax benefits of debt, representing the minimum return necessary to justify investment in the business.
Sensitivity Analysis: Stress-Testing Churn and the “CAC-to-LTV” Ratio
Sensitivity analysis is particularly important in valuing a mobile app due to uncertainties in user growth, engagement levels, monetization rates, marketing efficiency, and operating costs. Analysts typically test changes in key assumptions such as monthly active users, conversion rates to paid services, revenue per user, operating margins, and WACC. By evaluating how variations in these inputs affect the DCF valuation, sensitivity analysis highlights the most influential value drivers and provides a range of potential outcomes to support strategic and investment decisions.
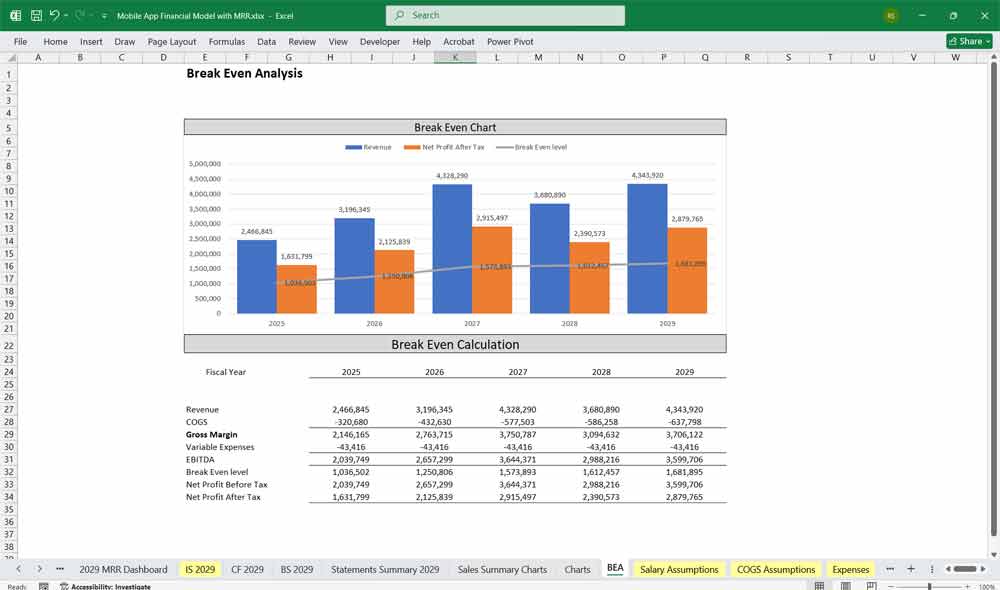
Final Thoughts for the Financial Model
A solid Mobile App Financial Model combines multiple revenue streams, optimized pricing strategies, and strong cash flow management. The six-tier subscription model ensures a broad user base while ad revenues and in-app purchases provide alternative income sources.
Download Link On Next Page
Download Link On Next Page