
Mineral Water Financial Model Template
The Mineral Water Bottling Financial Model Template is a professional Excel workbook for founders, investors, lenders and consultants who need to plan, fund or value a bottled water business. Built from the factory floor upward, it links plant capacity, utilization and bottles produced directly to revenue, EBITDA, free cash flow and valuation. With one year of monthly historicals and a five-year monthly forecast with annual totals, this bottled water business plan model gives you a bankable, investor-ready view of your mineral water company.
5-year Financial Model For A Mineral Water Manufacturer
Unlike generic startup templates, this spring water and mineral water financial model is purpose-built for the beverage industry. It forecasts six SKUs (330ml, 500ml, 750ml, 1.0L, 1.5L and 5L) across eight sales channels, from modern trade and wholesale to e-commerce, direct-to-consumer and export. Packaging costs for PET bottles, glass, caps, labels, shrink wrap, cartons and pallets are modelled per SKU, so your cost per bottle, gross margin and unit economics reflect how a real water bottling plant operates.
Every output is formula-driven and fully integrated across a three-statement financial model: P&L, cash flow statement and balance sheet. Change the start date and the entire timeline re-dates automatically. Adjust pricing, capacity, headcount, capex or financing, and your IRR, MOIC, DCF valuation and sensitivity tables update instantly. With 18 colour-coded tabs, built-in integrity checks and a balance sheet that balances every month, it is ready for bank loan applications, investor pitches, feasibility studies and expansion planning.
What’s Inside: Tab-by-Tab Overview
01. Cover Summary
A one-page executive dashboard presenting headline financials, investor returns and the funding requirement. Ideal for pitch decks and lender packs, it summarises revenue, EBITDA, free cash flow, IRR, MOIC and DCF valuation, with a model integrity status and clickable navigation.
- Six-year headline KPI table (FY actual + 5 forecast years)
- Revenue and EBITDA chart
- Sources & uses funding requirement for the expansion project
- IRR, MOIC, exit value and DCF enterprise value
- Model integrity PASS/REVIEW indicator and linked model map
02. Assumptions
The central control panel holding every input in one place. Edit capacity, SKU pricing, packaging costs, headcount, operating expenses, capex, working capital, financing, tax and valuation assumptions. A single start date drives the master calendar used throughout the financial model.
- One “Model Start Date” re-dates every tab automatically
- Annual inputs for utilization, price growth, inflation and customers
- Per-SKU mix, litres, case size, wastage, prices and discounts
- Itemised capex schedule with spend month, useful life and asset group
- Colour-coded inputs (blue on yellow) versus formulas and links
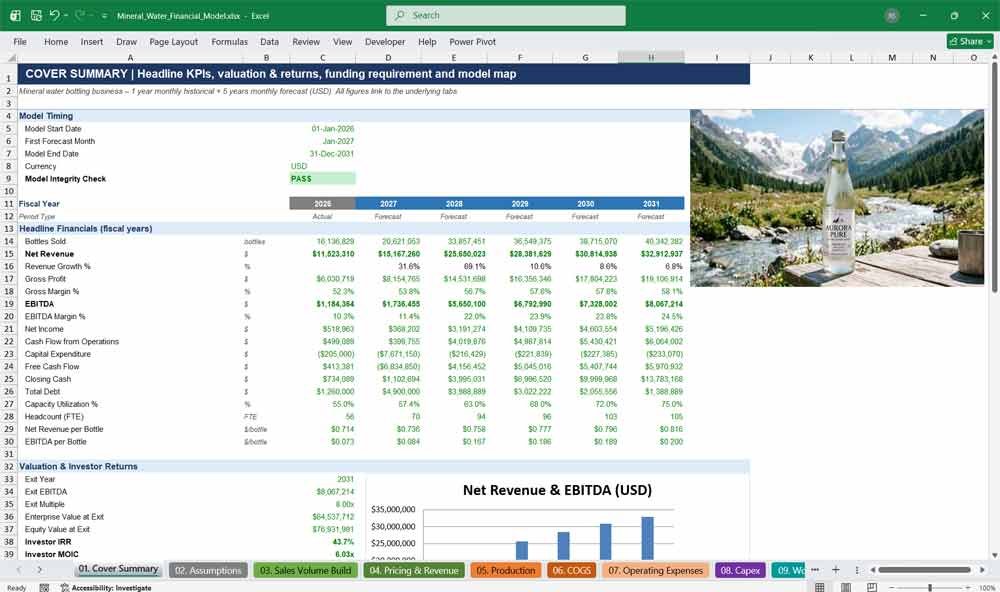
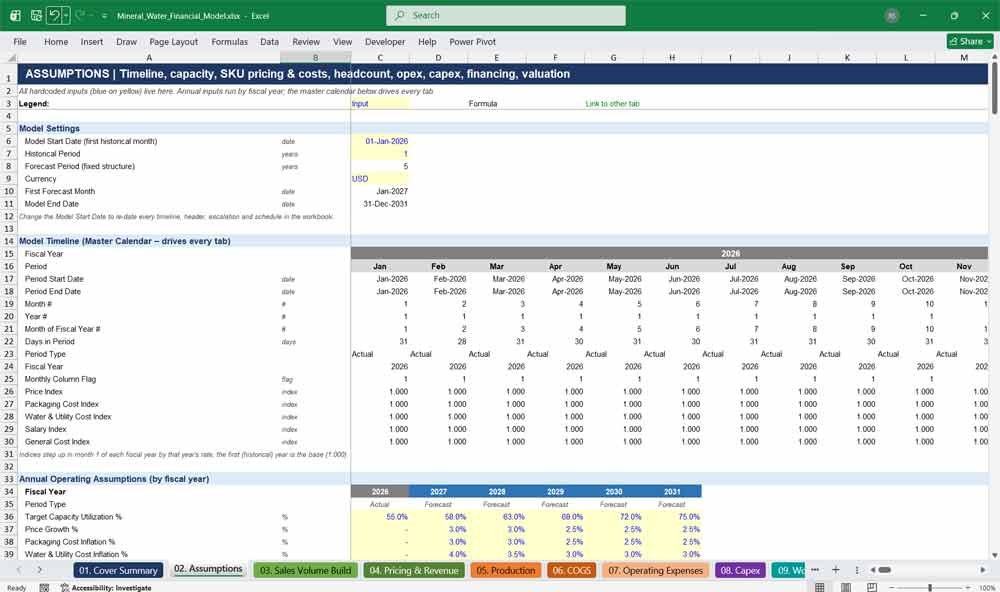
Mineral Water Manufacturer Revenues & Expenses
03. Sales Volume Build
Converts production into bottles and cases sold for each of six SKUs and eight sales channels. Tracks customers, churn and bottles per customer, applies wastage and inventory movements, and reports total litres sold and volume growth month by month.
- Volume by SKU: 330ml, 500ml, 750ml, 1.0L, 1.5L and 5L
- Eight channels including modern trade, foodservice, e-commerce and export
- Customer build: opening, new, churned and active customers
- Production volume, wastage % and net sellable volume per SKU
- Total bottles, cases and litres sold with growth rates
04. Pricing & Revenue
Builds net revenue from SKU list prices, trade, distributor and promotional discounts, and returns and rebates. Prices escalate annually, and revenue is reported by SKU and channel alongside average selling price, revenue per litre and revenue per production hour.
- List price to net selling price bridge for every SKU
- Revenue per case and average selling price per bottle
- Revenue by SKU and by sales channel
- Gross-to-net revenue waterfall with returns and rebates
- VAT/sales tax memo line (revenue modelled ex-tax)
05. Production
Models your bottling plant from bottles per hour to actual output. Covers nameplate capacity, seasonal utilization, an expansion line with ramp-up, yield, OEE, water processing, packaging materials, production labour and manufacturing overheads, delivering cost per bottle, case and litre.
- Two bottling lines with configurable expansion ramp-up
- Monthly seasonality applied to target utilization
- Yield, wastage, reject rate, downtime and OEE metrics
- Water intake, treatment, filtration and mineralisation costs
- Cost per bottle, case, litre, production hour and SKU
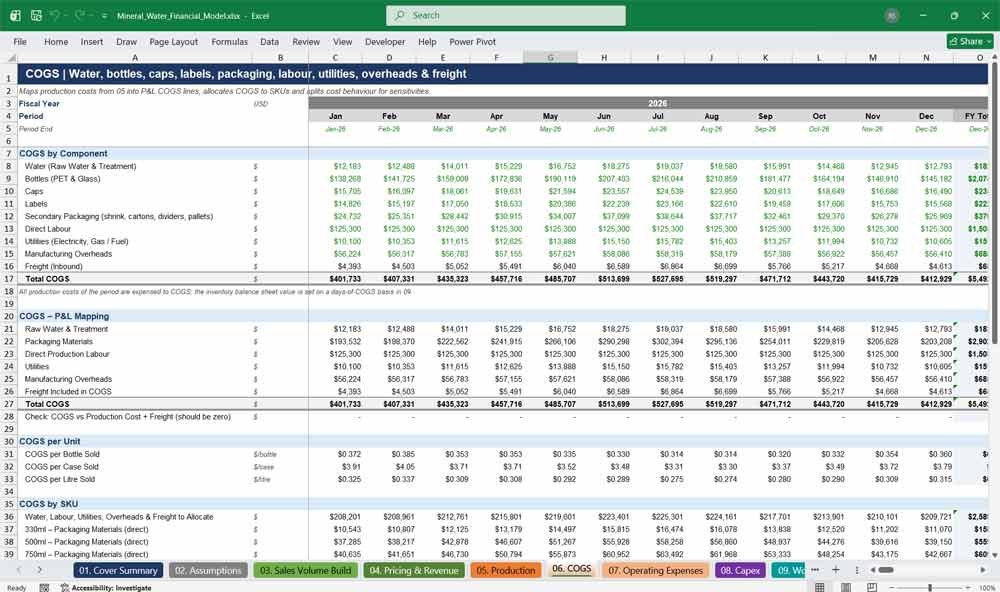
06. COGS
Translates production costs into a clean cost of goods sold for the income statement. Breaks COGS into water, bottles, caps, labels, secondary packaging, labour, utilities, overheads and freight, then allocates costs by SKU to reveal product-level profitability.
- COGS by component and mapped to P&L lines
- COGS per bottle, per case and per litre sold
- SKU-level COGS allocation and cost per bottle produced
- Variable versus fixed cost split for sensitivity analysis
- Reconciliation check against total production cost
07. Operating Expenses
A detailed operating cost budget covering personnel, sales and marketing, distribution and logistics, administration, insurance, regulatory compliance, technology and other expenses. Costs are driven by revenue, cases shipped, fixed monthly amounts with inflation, or headcount, making forecasts realistic and easy to adjust.
- Over 60 expense lines across eight categories
- Drivers: % of revenue, $ per case, fixed monthly or headcount
- Outbound freight, 3PL, warehouse and fleet costs
- Opex per bottle, per case and as % of revenue
- Selling and administrative expense ratios
08. Capex
Plans your full capital expenditure programme, from land, buildings and water treatment plant to bottling machines, trucks, IT and pre-opening costs. Includes maintenance capex, straight-line depreciation by asset, and fixed asset roll-forwards feeding the balance sheet.
- Over 45 itemised capex lines across seven categories
- Initial, growth and maintenance capex totals
- Depreciation by asset, maintenance layer and opening asset base
- D&A by group: factory, equipment, vehicles, office, software
- PP&E and intangible asset roll-forward schedules
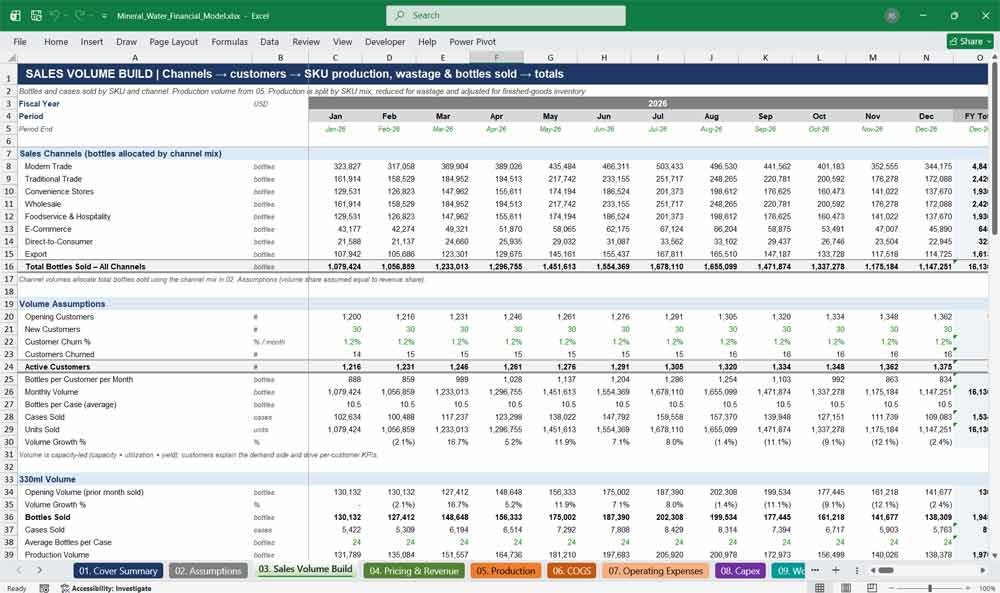
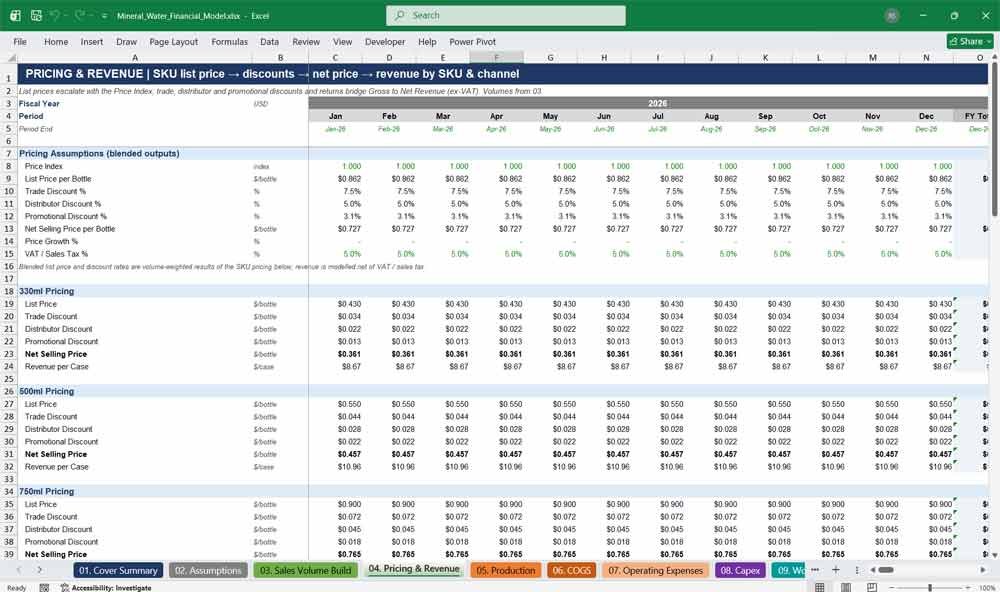
Mineral Water Manufacturer Financial Statements
09. Working Capital
Calculates receivables, inventory, prepayments, payables and accruals using days-outstanding assumptions applied to monthly flows. Tracks tax payable with quarterly payments and measures the cash conversion cycle, showing exactly how growth absorbs or releases cash.
- AR, inventory, payable, accrual and prepaid days drivers
- Net working capital balance every month
- Cash flow impact of each working capital movement
- Quarterly corporate tax payment schedule
- AR days, inventory days, AP days and cash conversion cycle
10. Headcount
A complete staffing plan for 12 roles across production, sales, marketing, finance, administration, IT and delivery drivers. Salaries escalate annually, with benefits, payroll taxes, recruitment and training added, then personnel costs are allocated between COGS, distribution and operating expenses.
- FTE plan by role and fiscal year
- Base salaries, benefits and payroll taxes
- Recruitment and training costs linked to hires
- Fully loaded cost per role with allocation check
- Cost per employee and revenue per employee
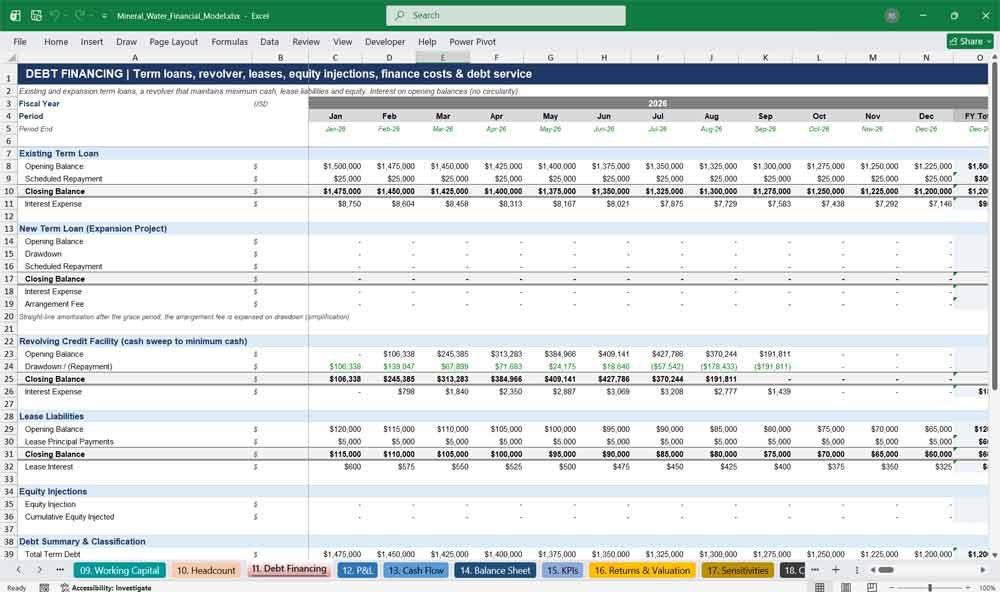
11. Debt Financing
Models existing and new term loans, a revolving credit facility, lease liabilities and equity injections. The revolver automatically draws to protect minimum cash and repays from surplus, while interest on opening balances keeps the model free of circular references.
- Existing term loan and new expansion loan with grace period
- Automatic revolver draws and repayments
- Lease liabilities with interest and principal
- Current versus long-term debt classification
- Finance costs and debt service totals
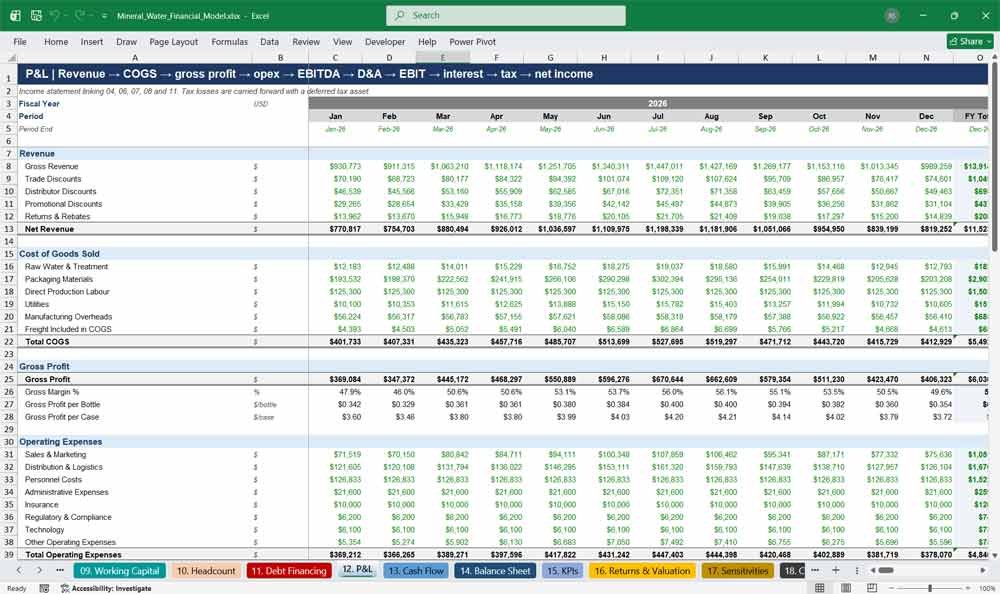
12. P&L
A full monthly and annual income statement, from gross revenue through discounts, COGS, gross profit, operating expenses and EBITDA to depreciation, finance costs, tax and net income. Tax losses carry forward with deferred tax, and profitability margins are calculated automatically.
- Gross-to-net revenue presentation
- Gross profit, EBITDA and EBIT with margins
- Gross profit and EBITDA per bottle and per case
- Current and deferred tax with loss carry-forward
- Net income, net margin and return on sales
13. Cash Flow
An indirect-method cash flow statement showing operating, investing and financing cash flows every month. It reconciles opening to closing cash, calculates free cash flow and cash conversion, and reports the debt service coverage ratio lenders look for.
- Cash flow from operations, investing and financing
- Beginning to ending cash reconciliation
- Free cash flow build from EBITDA
- Dividends linked to prior-year profit and payout ratio
- Debt service coverage ratio and cash conversion
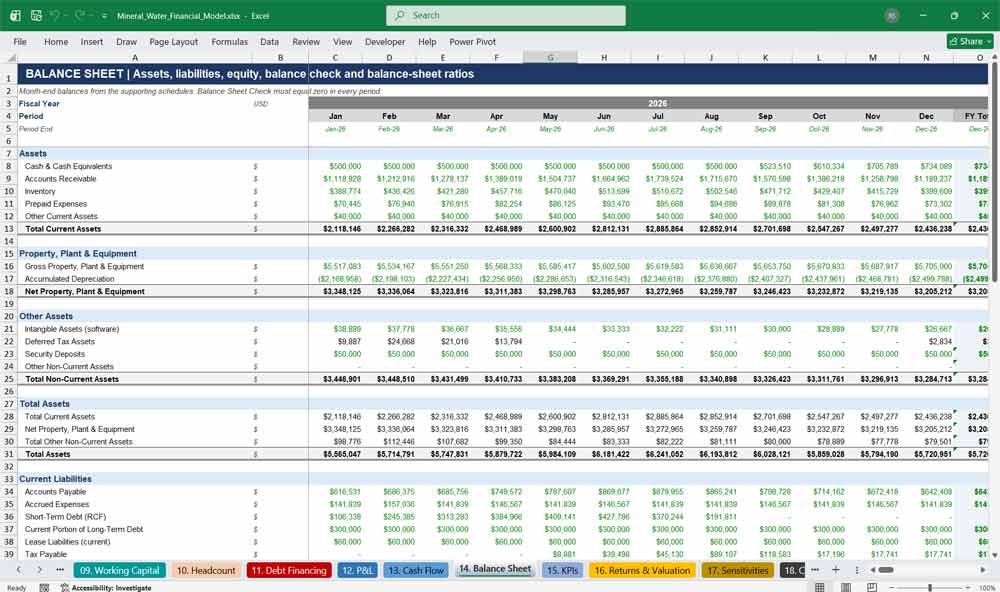
14. Balance Sheet
A fully integrated monthly balance sheet covering cash, receivables, inventory, PP&E, intangibles, deferred tax, debt, leases and equity. Retained earnings roll forward correctly, and the balance sheet check equals zero in every period, giving reviewers complete confidence.
- Current and non-current assets and liabilities
- Share capital, paid-in capital and retained earnings roll-forward
- Balance sheet check equal to zero every month
- Current ratio, quick ratio and debt to equity
- Net debt to EBITDA and working capital metrics
15. KPIs
A dedicated unit economics and performance dashboard. Track revenue, COGS, gross profit and EBITDA per bottle, case and litre, plus customer acquisition cost, revenue per customer, capacity utilization and growth rates, monthly and annually.
- Unit economics per bottle, per case and per litre
- Production cost, opex and free cash flow per bottle
- Customer acquisition cost and revenue per customer
- Volume growth and revenue growth
- Capacity utilization, headcount and revenue per employee
Key Financial Metrics for a Mineral Water Company
16. Returns & Valuation
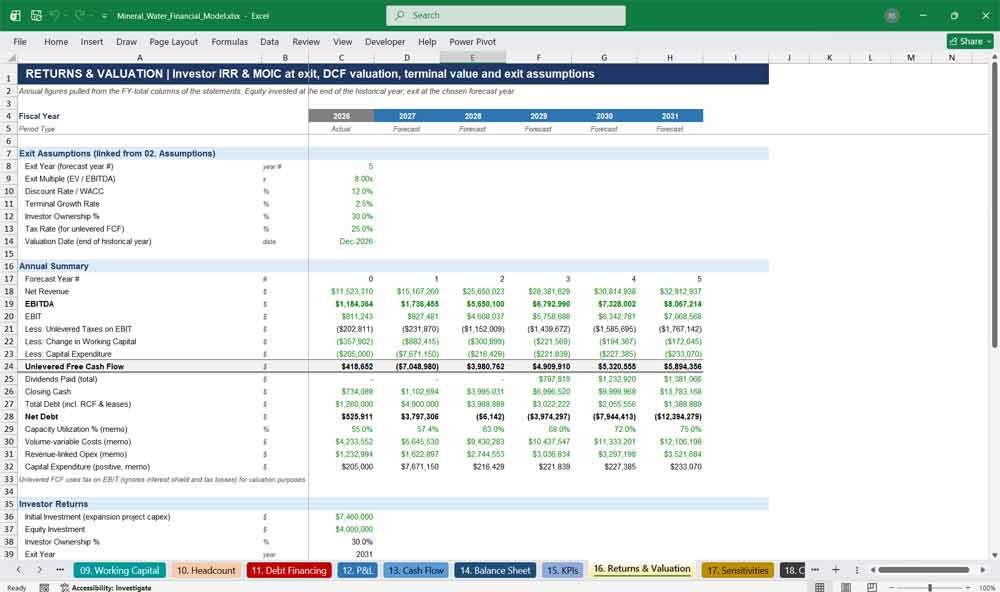
Calculates investor returns and company valuation. Choose the exit year and multiple to derive enterprise value, equity value, investor proceeds, IRR and MOIC, alongside a discounted cash flow valuation with terminal value, WACC and an exit-multiple cross-check.
- Selectable exit year, exit multiple, WACC and terminal growth
- Enterprise value, net debt and equity value at exit
- Investor cash flows, IRR and MOIC
- Unlevered free cash flow and DCF enterprise value
- Terminal value analysis and implied exit multiple
17. Sensitivities
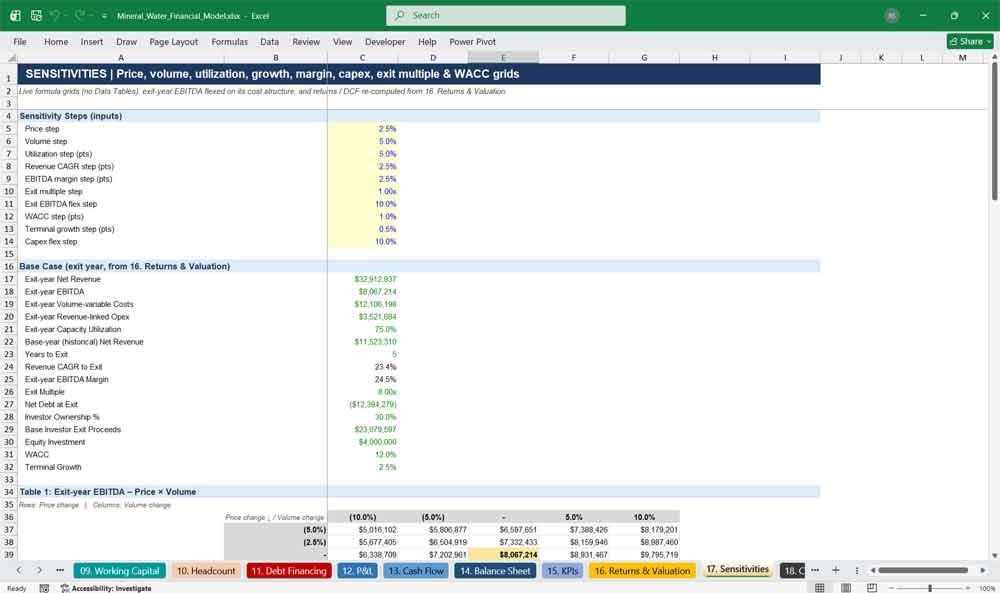
Seven live sensitivity tables show how value responds to key drivers. Flex price, volume, capacity utilization, revenue growth, EBITDA margin, capex, exit multiple and WACC, with results updating instantly without Excel Data Tables or macros.
- Price × volume impact on EBITDA
- Utilization × price impact on EBITDA
- Revenue growth × EBITDA margin impact on exit value
- Exit multiple × EBITDA impact on IRR and MOIC
- WACC, terminal growth and capex impact on DCF value
18. Checks
An integrity dashboard that monitors 19 reconciliation checks in every month, including balance sheet balance, cash agreement, revenue and COGS reconciliations, volume flows and mix totals. Each period shows PASS or REVIEW, rolling up to the cover summary.
- 19 automated integrity and reconciliation checks
- PASS/REVIEW status for every month and year
- Balance sheet, cash, revenue, COGS and volume tie-outs
- Minimum cash and non-negative balance checks
- Overall model status linked to the cover page
Why Buy This Model?
Building a credible bottled water financial model from scratch can take weeks, and one broken link can undermine an investor pitch or bank application. This template gives you a complete, fully integrated three-statement model designed specifically for mineral and spring water bottling, so you start with the right structure: capacity-led production, SKU-level pricing and packaging costs, channel revenue, headcount, capex, working capital, debt and equity. Every forecast figure is formula-driven, colour-coded and checked, with a balance sheet that balances every month. Simply replace the illustrative assumptions with your own and instantly produce investor-ready outputs, including EBITDA, free cash flow, IRR, MOIC, DCF valuation and sensitivity analysis, saving time while presenting your business with the rigour lenders and investors expect.
Frequently Asked Questions
Q: I’m planning a brand-new water bottling plant, not an existing business. Can I still use this model?
A: Yes. The model includes one historical year, but you can set opening balances to zero, reduce historical capacity, and use the capex schedule and funding inputs to model a greenfield plant from construction through to commissioning and ramp-up.
Q: Do I need advanced Excel skills to use it?
A: No. All inputs sit on the 02. Assumptions tab and are clearly marked in blue on a yellow background. You change those cells, and every schedule, statement and chart updates automatically. Formulas are in black and should not be overtyped.
Q: Can I change the start date of the forecast?
A: Yes. Change the Model Start Date on the Assumptions tab and every timeline, year header, month label, escalation index and schedule across all 18 tabs re-dates automatically.
Q: Can I change the bottle sizes or product range?
A: The model is structured around six SKUs (330ml, 500ml, 750ml, 1.0L, 1.5L and 5L). You can rename them and change litres per bottle, case size, prices, discounts, wastage and packaging costs to match your own product range, such as sparkling water or glass-bottled premium water.
Q: Is the model monthly or annual?
A: Both. It runs monthly for one historical year and five forecast years, with an FY Total column after each year that automatically aggregates the monthly figures. Monthly columns are grouped, so you can collapse the view to annual totals.
Q: Will lenders and investors accept this format?
A: The model follows lender and investor formatting conventions: separate assumptions, calculations and financial statements; colour-coded inputs; a fully integrated P&L, cash flow and balance sheet; debt service coverage; and 19 integrity checks. It is designed to stand up to financial due diligence, though you should always tailor assumptions to your own market evidence.
Q: Does it include a valuation?
A: Yes. The 16. Returns & Valuation tab calculates enterprise value and equity value at exit using an EBITDA multiple, investor IRR and MOIC, and a discounted cash flow valuation with terminal value based on your chosen WACC and growth rate.
Q: Can it model bank loans and investor equity?
A: Yes. It covers an existing term loan, a new expansion loan with grace period and arrangement fee, a revolving credit facility that maintains minimum cash, lease liabilities, equity injections, investor ownership and dividends based on a payout ratio.
Q: Does it use macros or VBA?
A: No. The model contains no macros, VBA or Excel Data Tables. Every calculation, including the sensitivity tables, uses standard formulas, so it is transparent, fast and easy to audit.
Q: What currency is the model in?
A: The template is presented in US dollars. The calculations work in any currency, so you can enter your inputs in pounds, euros or another currency and update the currency label on the Assumptions tab; the $ symbol in the number formats can be changed in Excel’s cell formatting.
Q: How do I know the model is working correctly?
A: The 18. Checks tab runs 19 automated reconciliations every month, including the balance sheet check, cash agreement, revenue and COGS tie-outs and volume flows. The result rolls up to a single PASS or REVIEW flag on the cover summary.
Q: Are the numbers in the model based on real market data?
A: No. The figures supplied are illustrative placeholders showing how the model works. Replace them with your own pricing, costs, volumes and financing terms, ideally supported by supplier quotes and market research, before relying on the outputs.
Q: Can I use it for sensitivity and scenario analysis?
A: Yes. The 17. Sensitivities tab includes seven live grids covering price, volume, capacity utilization, revenue growth, EBITDA margin, capex, exit multiple and WACC, so you can quickly test downside and upside cases.
Key Financial Ratios & Metrics
- Gross Profit Margin = (Revenue – COGS) / Revenue
- Operating Margin = Operating Profit / Revenue
- EBITDA Margin = (Earnings Before Interest, Taxes, Depreciation, and Amortization) / Revenue
- Current Ratio = Current Assets / Current Liabilities
- Debt-to-Equity Ratio = Total Debt / Shareholder’s Equity
- Return on Investment (ROI) = Net Profit / Investment Cost
Scenario Analysis
- Best Case: High subscription retention, strong retail demand, cost efficiency.
- Base Case: Steady sales growth with manageable costs.
- Worst Case: Supply chain disruptions, high churn, increased competition.
Conclusion
This Excel financial model for a mineral (bottled water) company balances product variety, cost structure, and revenue channels. By incorporating retail sales, bulk distribution, and a 6-tier subscription model, your business can stabilize cash flow and achieve long-term growth