
Manufacturing Startup Financial Model Template
This Manufacturing Startup Financial Model Template is a fully integrated Excel workbook built for founders, CFOs, investors and lenders who need a bankable, investor-ready forecast for a new manufacturing business. It covers seven years: Years 1–3 month by month, with an annual roll-up column for each year, and Years 4–7 annually. It produces a linked P&L, cash flow statement and balance sheet in USD. Every figure is formula-driven and traces back to one Assumptions tab, so you can test pricing, volumes, yields and funding in minutes.
Financial Model for a Manufacturing Startup
Unlike generic startup templates, this model follows the full manufacturing operational chain: Customers → Orders → Units → Production → Yield/Scrap → Finished Goods → Units Sold → Revenue. Units produced then drive materials, direct labor and manufacturing overhead into cost of goods sold (COGS). It tracks machine capacity, utilization, scrap, rework, raw material, work-in-progress (WIP) and finished goods inventory. You can see exactly when you will run out of capacity, when to buy the next machine and when a second factory is needed.
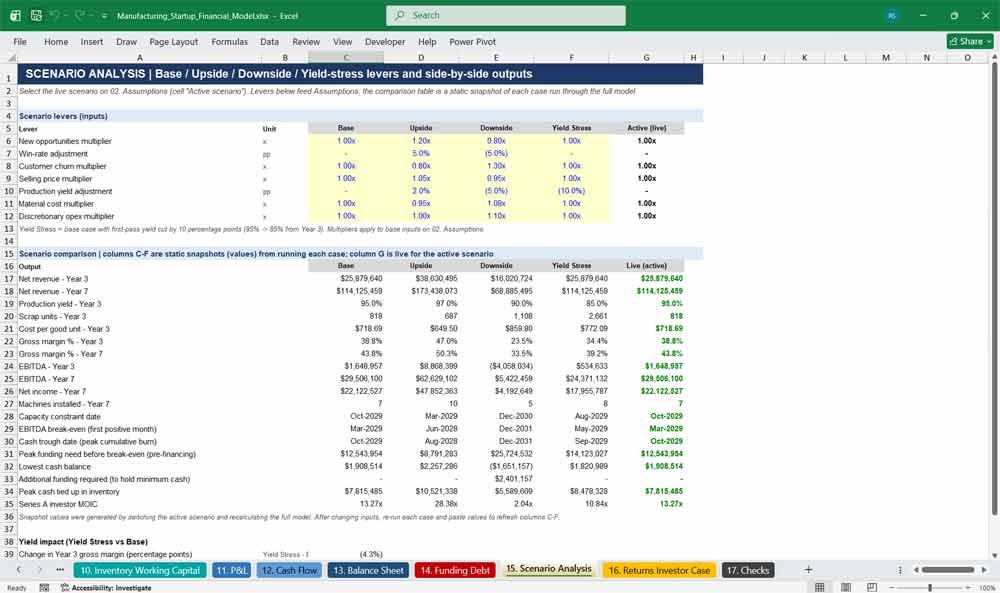
The model answers the questions investors and lenders ask first: how much funding is required before break-even, when the business becomes cash-flow positive, how much cash is tied up in inventory, and what happens to gross margin if yield falls from 95% to 85%. It includes a Cover Dashboard, scenario analysis (Base, Upside, Downside, Yield Stress), a cap table with investor returns (MOIC and IRR), and automated balance sheet checks. Change one start date and every date, header and schedule in the workbook updates.
What’s Inside: Tab-by-Tab Guide
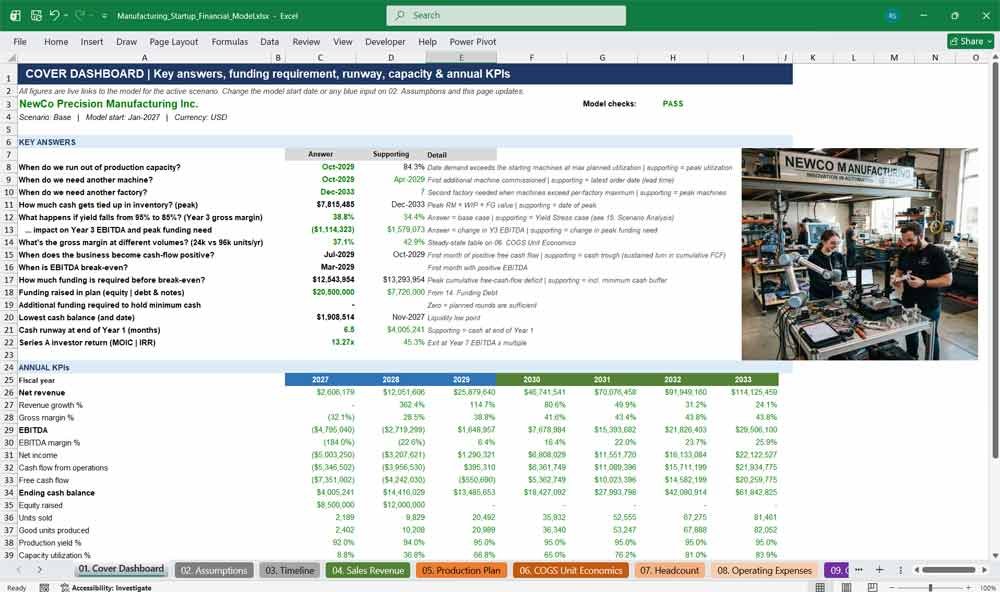
01. Cover Dashboard
A one-page executive summary of your manufacturing startup forecast. It answers the key investor questions straight away: capacity constraint date, machine and factory timing, peak inventory cash, break-even month, funding requirement, cash runway and investor returns. Annual KPIs and charts are included.
- Key answers to 15 investor and lender questions, all live-linked
- Annual KPI table: revenue, gross margin, EBITDA, free cash flow, cash, units, headcount
- Revenue, EBITDA and ending cash charts
- Model check status (PASS/REVIEW) on the front page
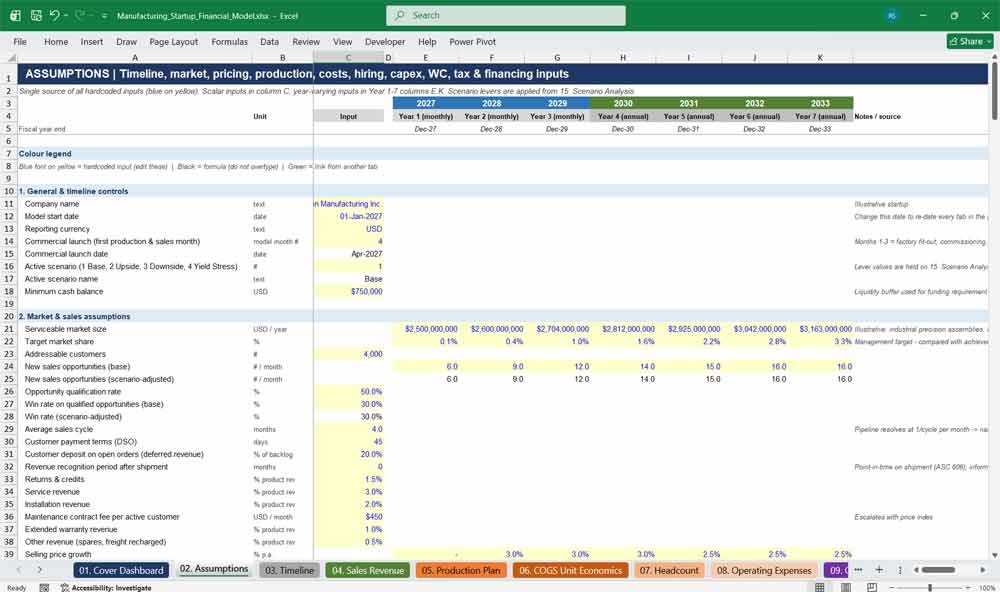
02. Assumptions
One central inputs tab for every operating, pricing, cost, hiring, capex, working capital, tax and financing driver. Inputs are colour-coded (blue on yellow), have notes, and change by year where relevant. That makes the whole manufacturing financial model easy to audit, update and adapt to your business.
- One model start date re-dates the entire workbook
- 3 customer segments and 3 product SKUs with mix, pricing and bill of materials
- Hiring plan for 40 roles with department, start month and salary
- Capex, useful lives, working capital days, tax/NOL and funding terms
Manufacturing Startup Economics
03. Timeline
The time engine behind the model. It holds monthly periods for Years 1–3 with FY Total columns, and annual periods for Years 4–7. Period dates, month counts, fiscal years and operating flags are all calculated from the start date, so every schedule stays aligned.
- Fully dynamic dates: start date → every header, label and flag
- Pre-launch and commercial-operations flags drive ramp-up timing
- Months-in-period logic keeps monthly and annual calculations consistent
- Model controls: start, end, launch date, active scenario
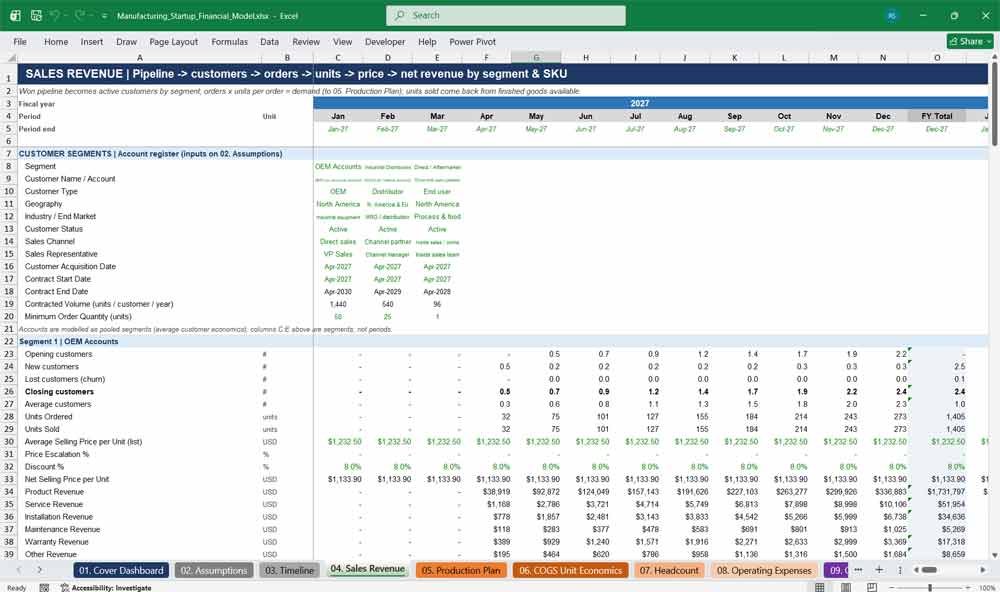
04. Sales Revenue
A detailed revenue build that runs from sales pipeline to active customers, orders, units and pricing, then to net revenue. It is broken out by customer segment and product SKU. It covers product, service, installation, maintenance, warranty and other revenue, and books discounts, returns, bookings, backlog and deferred revenue.
- Sales pipeline: opportunities, qualification, conversion rate, sales cycle and wins
- Customer segment register and revenue build with churn and customer counts
- Product revenue by SKU with price escalation, revenue mix % and average revenue per unit
- Sales KPIs: average contract value, average order value, market share, revenue per customer
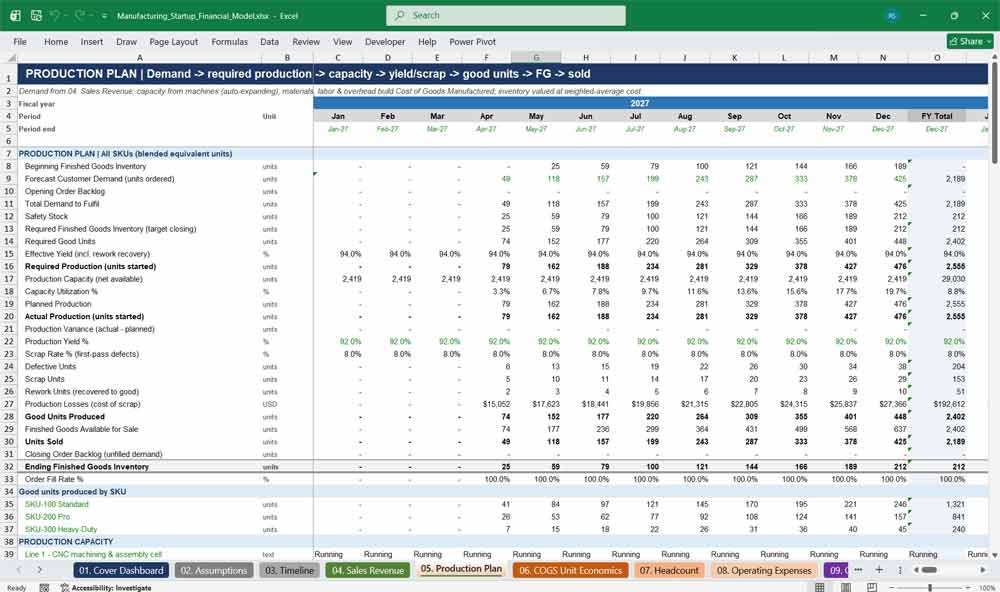
05. Production Plan
The operational heart of the model. It turns customer demand into required production, safety stock, machine capacity and utilization, yield, scrap and rework, and good units produced. Materials, direct labor, manufacturing overhead, inventory rollforward and capacity expansion are calculated here too.
- Capacity planning: machines, hours, downtime, net capacity, excess capacity and shortfall
- Automatic machine and factory expansion with purchase, installation and commissioning dates
- Yield, scrap, rework and cost-of-scrap tracking
- Raw materials, WIP and finished goods inventory valued at weighted-average cost
06. COGS Unit Economics
Understand your true cost per unit and gross margin. This tab breaks COGS into materials, labor, overhead, freight, packaging, write-offs and warranty. It also calculates contribution margin, break-even units, and a volume sensitivity table showing gross margin at different production volumes.
- Cost per unit sold and cost per good unit produced
- Contribution margin and break-even volume analysis
- Gross margin at nine production volume levels, including machine and factory steps
- COGS tie-out check against the P&L
07. Headcount
A role-by-role hiring plan that calculates FTEs, base salaries, benefits, payroll taxes, bonuses and stock-based compensation for eight departments. Direct production operators link from the production plan, giving a complete personnel cost forecast for your manufacturing company.
- 40 configurable roles with start month, FTE count and salary
- Department roll-ups: executive, production, quality, engineering, sales, support, finance
- Salary inflation, benefits, payroll tax and bonus assumptions
- New hires feed recruitment costs and IT/furniture capex
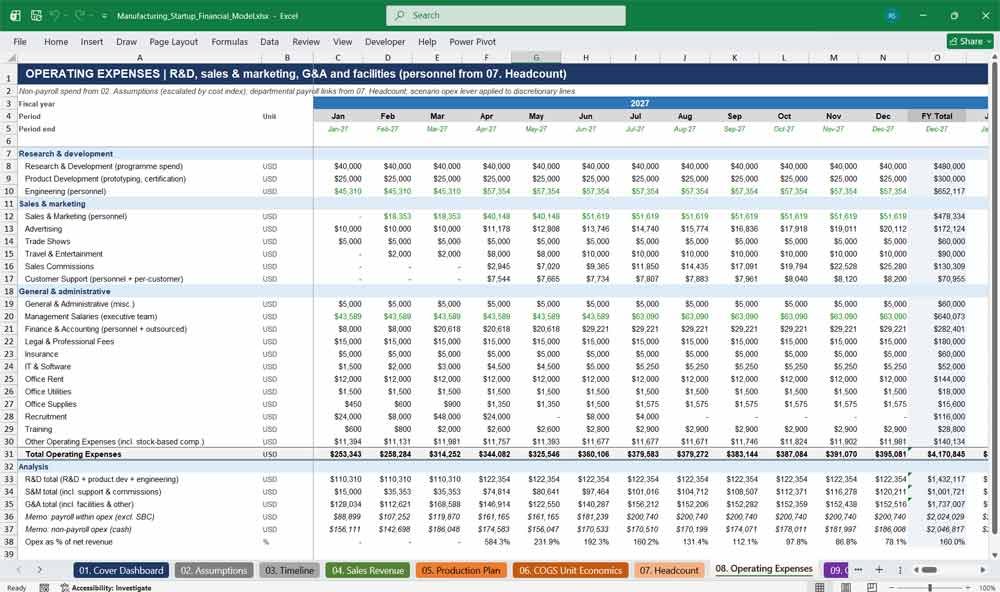
08. Operating Expenses
A complete operating expense forecast covering R&D, product development, engineering, sales and marketing, advertising, trade shows, commissions, customer support, and general and administrative costs. Costs are driven by revenue, headcount, customers and inflation, not flat guesses, so opex scales realistically.
- 21 opex line items grouped into R&D, S&M and G&A
- Variable drivers: % of revenue, per head, per customer
- Cost inflation index and scenario opex multiplier
- Opex as % of revenue tracking
09. Capex Fixed Assets
Plans machinery, production equipment, tooling, factory build-out, vehicles, IT, software, capitalized development, patents and trademarks. Machinery capex is triggered automatically by capacity needs. Straight-line depreciation and amortization produce gross cost, accumulated depreciation and net book value by asset class.
- 13 asset classes with individual useful lives
- Capex driven by machines commissioned, factories opened and new hires
- Factory depreciation absorbed into manufacturing overhead
- Full fixed asset register roll-forward feeding the balance sheet
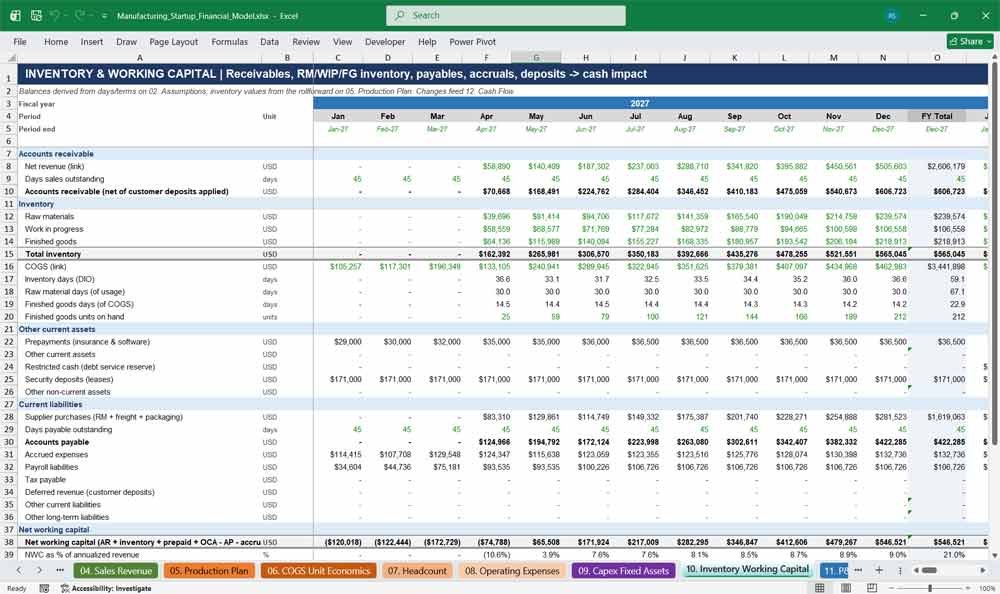
10. Inventory Working Capital
Shows how much cash is tied up in working capital. It models accounts receivable, raw materials, WIP and finished goods inventory, prepayments, security deposits, accounts payable, accruals, payroll and tax liabilities, and customer deposits. Inventory days and the cash conversion cycle are included.
- DSO, DPO, inventory days (DIO) and cash conversion cycle
- Net working capital and NWC as % of revenue
- Period-by-period working capital changes feeding the cash flow
- Customer deposits recorded as deferred revenue
Manufacturing Startup Financial Statements
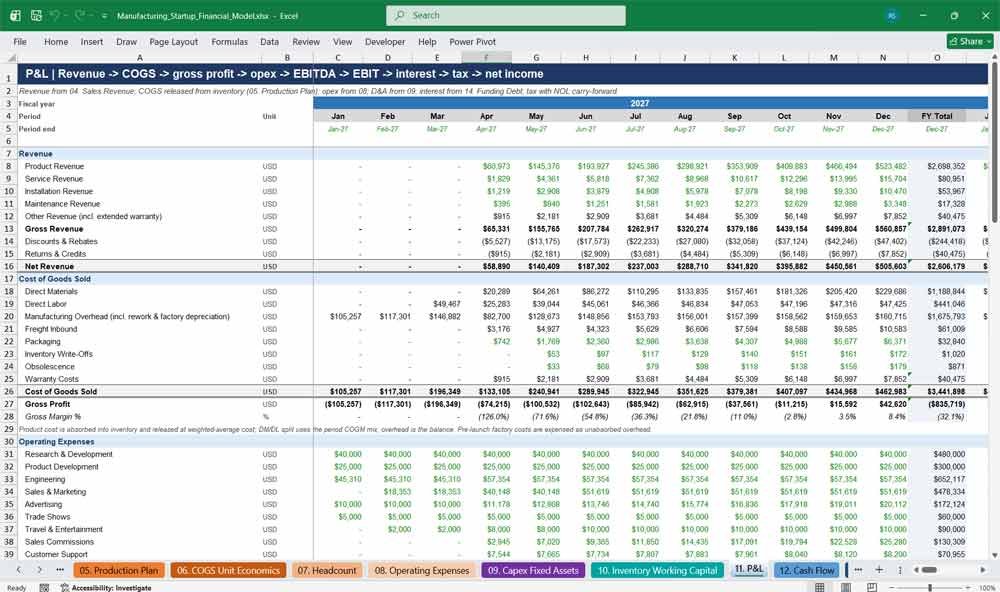
11. P&L
A full profit and loss statement: revenue by type, discounts and returns, detailed COGS, gross margin, 21 operating expense lines, a personnel memo, depreciation and amortization, EBITDA, EBIT, interest, FX, tax and net income. Built to the level of detail lenders and investors expect.
- Gross margin, EBITDA margin, EBIT margin and net income margin
- Tax with net operating loss (NOL) carry-forward and utilization cap
- Optional deferred tax asset recognition
- Interest income and expense linked to funding schedules
12. Cash Flow
An indirect-method cash flow statement covering operating, investing and financing cash flows, cash reconciliation and minimum cash. A dedicated funding requirement section and cash flow metrics show burn rate, runway and free cash flow at a glance.
- Monthly cash burn, average burn and annualized burn
- Cash runway in months and free cash flow margin
- Funding requirement: shortfall to minimum cash and funding round dates
- Ending cash balance reconciled to the balance sheet every period
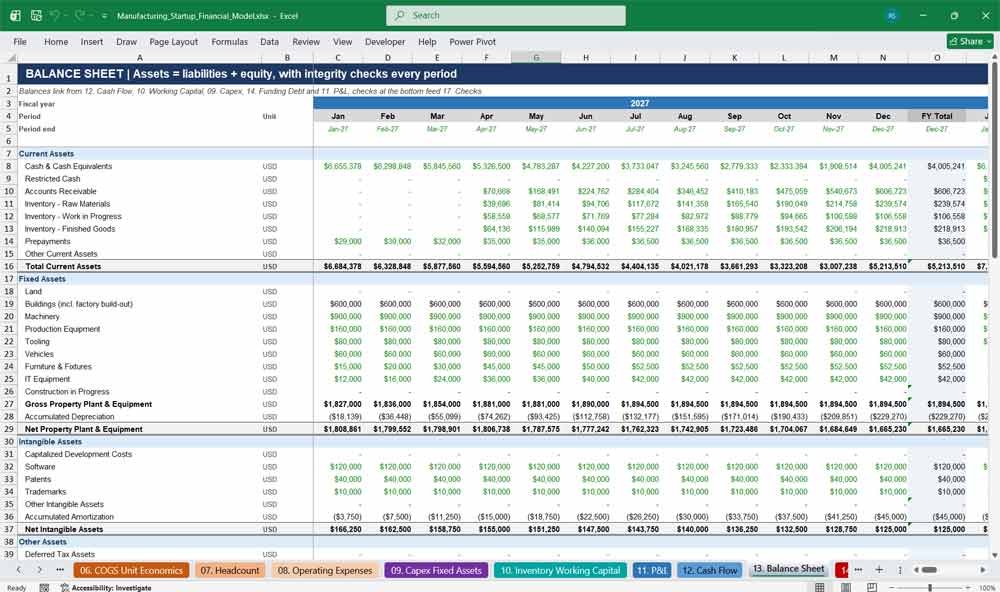
13. Balance Sheet
A fully balancing balance sheet with current assets, three inventory classes, fixed assets, intangibles, current and long-term liabilities, and a detailed equity section. Built-in checks confirm that total assets equal liabilities plus equity in every monthly and annual period.
- Separate raw material, WIP and finished goods inventory
- Debt split into current and non-current portions
- Equity: share capital, founder and investor capital, SBC reserve, retained earnings
- Balance, minimum cash, debt, retained earnings and working capital checks
14. Funding Debt
Models every source of capital: founder equity, Series A and Series B rounds, convertible notes with PIK interest and conversion, a bank term loan with grace period, equipment financing and finance leases. Interest, repayment schedules and debt balances all flow to the financial statements.
- Equity round timing and issuance costs
- Convertible note conversion at the lower of discounted price or valuation cap
- Term loan amortization after an interest-only grace period
- Net debt and debt service coverage ratio (DSCR)
Key Financial Metrics for a Manufacturing Startup
15. Scenario Analysis
Stress-test your manufacturing business plan with Base, Upside, Downside and Yield Stress scenarios. Seven levers adjust sales opportunities, win rate, churn, price, yield, material cost and opex. A side-by-side comparison shows revenue, margins, EBITDA, funding need and investor returns.
- One-click scenario switch from the Assumptions tab
- Yield Stress case models a 95% → 85% yield drop
- 19 outputs compared across all four scenarios
- Yield impact summary: gross margin, EBITDA, unit cost and funding need
16. Returns Investor Case
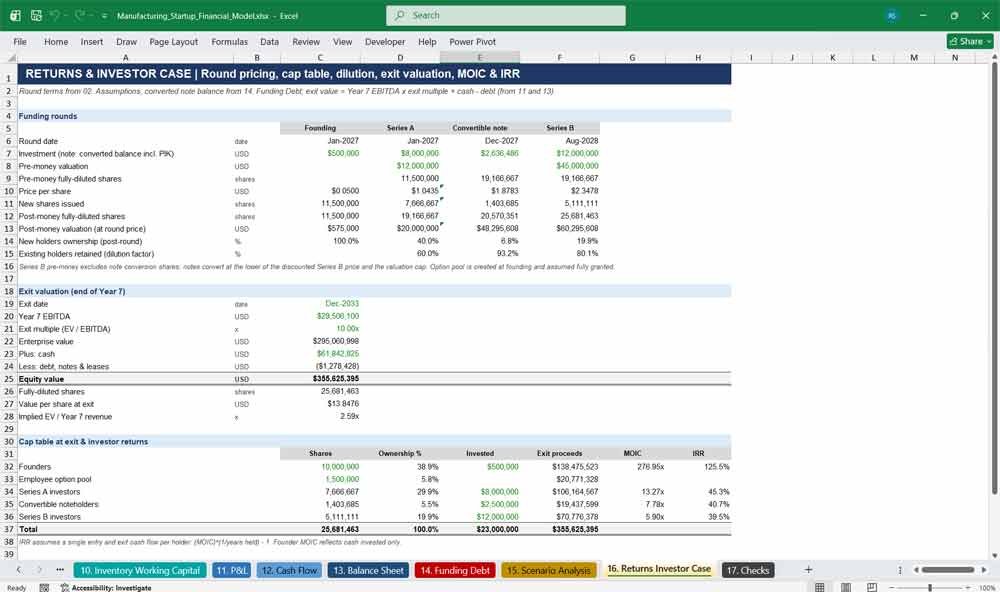
The investor returns analysis. It prices each funding round, builds the cap table, tracks founder dilution and values the company at exit using an EBITDA multiple. MOIC and IRR are calculated for founders, Series A, noteholders and Series B investors.
- Round pricing, pre/post-money valuation and new shares issued
- Fully diluted cap table and ownership % at exit
- Exit enterprise value and equity value bridge
- Founder dilution walk from founding to Series B
17. Checks
An automated integrity dashboard that tests the model every period. It covers balance sheet balance, cash reconciliation, revenue and unit tie-outs, inventory, EBIT, debt, retained earnings and capacity. It also scans every tab for formula errors and returns a single PASS/REVIEW status.
- 11 error checks and 3 warnings per period
- Formula error scan across 13 calculation tabs
- Overall model status shown on the Cover Dashboard
- Built for audit, lender and due diligence confidence
Why Buy This Model?
Building a credible manufacturing financial model from scratch takes weeks and demands both operational and finance expertise. This template gives you both, ready to use. It links your sales pipeline to production capacity, yield, inventory and cash, so your forecast reflects how a factory actually works, not just a revenue growth rate. It is formatted to lender and investor standards, with colour-coded inputs, a fully dynamic timeline, a three-statement structure that balances, scenario analysis and automated checks. You can go into investor meetings, bank loan applications and board discussions with numbers you can defend. It answers the hard questions for you: when capacity runs out, when to buy the next machine, how much cash inventory absorbs, and exactly how much funding you need before break-even.
Manufacturing Startup Frequently Asked Questions ( Faq)
Is this model suitable for my type of manufacturing business?
Yes. The model is built around a general manufacturing process of machines, labor hours per unit, bill of materials, yield and overhead. That covers most discrete manufacturers, such as industrial components, consumer products, electronics assembly, food production or equipment. You set your own units per hour, material costs, prices and capacity inputs.
Do I need advanced Excel skills to use it?
No. All inputs sit on one Assumptions tab and are clearly marked in blue on yellow. You only change those cells, and everything else calculates automatically. Each tab has a title band and a short description, and the Checks tab tells you if anything is out of balance.
Can I change the start date of the forecast?
Yes. Enter a new model start date on the Assumptions tab, and every date, month label, year header, hiring date, funding round and exit date across all 17 tabs updates automatically.
What time period does the model cover?
Seven years. Years 1–3 are monthly, each with an annual FY Total column, and Years 4–7 are annual. That gives you the monthly detail needed for cash planning and fundraising, plus a long-term view for valuation.
Does it include a full three-statement financial model?
Yes. It includes a fully linked Profit & Loss, Cash Flow Statement and Balance Sheet, all integrated with the operating schedules. The balance sheet balances in every period, and this is verified automatically on the Checks tab.
How does the model tell me when I need another machine or factory?
The Production Plan compares required production with net machine capacity at your maximum planned utilization. When demand exceeds capacity, it adds machines automatically and reports the capacity constraint date, machine purchase date, installation date and commissioning date. It also flags when you exceed the machines-per-factory limit and need a second factory. You can switch to manual machine additions if you prefer.
Can I see how much funding I need?
Yes. The Cover Dashboard shows the peak funding requirement before break-even, the lowest cash balance and its date, cash runway, and any additional funding needed to maintain your minimum cash balance. The Funding Debt tab lets you model equity rounds, convertible notes, bank loans and equipment financing to close the gap.
Can I run different scenarios?
Yes. Choose Base, Upside, Downside or Yield Stress from a single cell on the Assumptions tab. Seven scenario levers adjust sales, win rate, churn, pricing, yield, material cost and operating expenses. A comparison table on the Scenario Analysis tab shows the key outputs side by side.
How is inventory handled?
Inventory is tracked in three stages: raw materials, work-in-progress and finished goods. Days-based targets drive the balances, and finished goods are valued at weighted-average cost. Obsolescence and write-offs are included, and the model shows exactly how much cash is tied up in inventory each period.
Does it calculate investor returns and dilution?
Yes. The Returns Investor Case tab prices each funding round, builds the fully diluted cap table (including option pool and convertible note conversion), values the business at exit on an EBITDA multiple, and calculates MOIC and IRR for each investor class.
How many products, customer segments and employees can I model?
The model includes three product SKUs, three customer segments and a hiring plan with 40 roles across eight departments. You can rename each product, segment and role, and set its own pricing, mix, volumes and salaries.
Are there any macros or hidden code?
No. The model uses only standard Excel formulas, with no macros or VBA, so it is transparent, fully auditable and safe to share with investors, lenders and advisors.
Which currency does the model use?
The model is presented in USD. You can change the currency label on the Assumptions tab and enter your own figures in any currency. Only the number formats display a dollar sign.
Can I use it for a bank loan or investor pitch?
Yes. The formatting follows professional lender and investor conventions: colour-coded inputs, formulas and links, consistent number formats, section headers, and visible tie-out checks. The Cover Dashboard gives you a ready-made summary for pitch decks and loan applications.
Conclusions on the Financial Model
Financial model for a Manufacturing Startup
- Scenario Analysis: Create best-case, base-case, and worst-case projections.
- Break-even Analysis: Determine sales volume required to cover fixed & variable costs.
- Sensitivity Analysis: Assess how changes in raw material costs, pricing, or demand impact profitability.
This 7-year DCF model provides a structured way to project profitability, cash flow, and financial stability for a manufacturing startup.