
Logistics Company Financial Model Excel Template
This 20–Year, 3-Statement Logistics Company Financial Model Excel Template includes revenue streams from Logistical Operations, Warehousing, etc. Cost structures, Discounted Cash Flow (DCF) with Terminal Value, Sensitivity Analysis, WACC, NPV and IRR and financial statements to forecast the financial health of your logistics company.
20-Year Financial Model for a Logistics Company
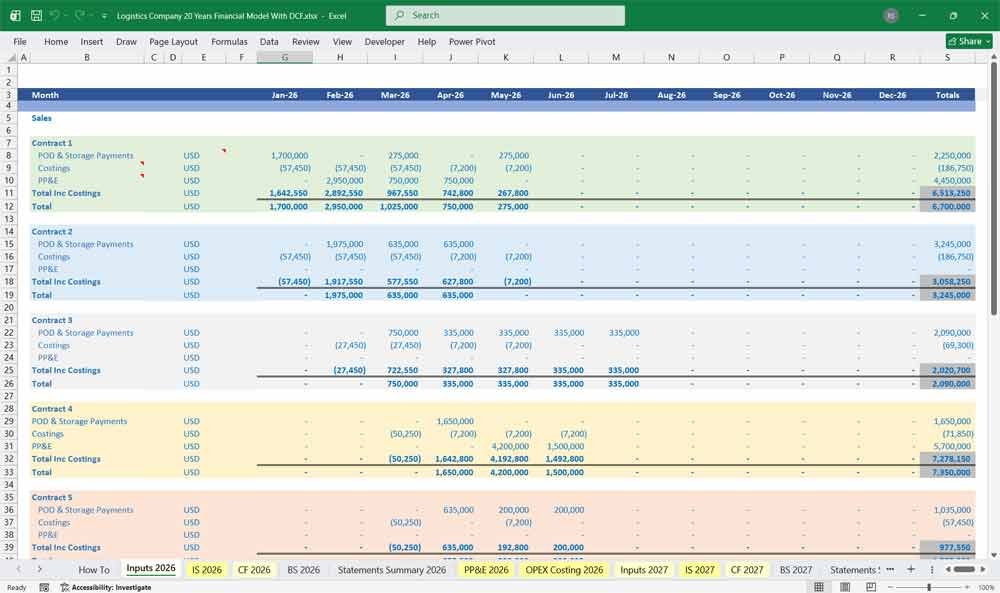
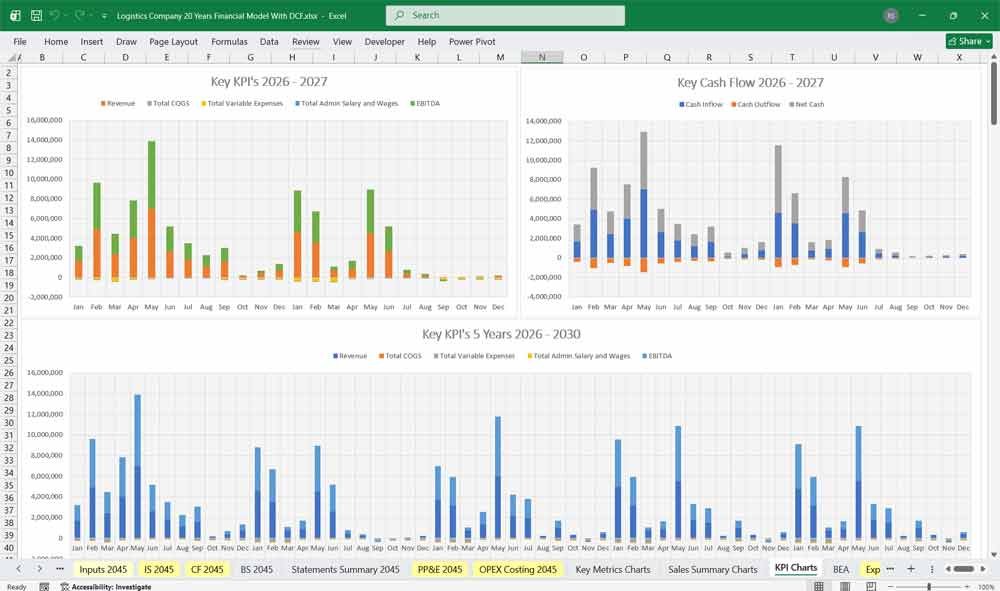
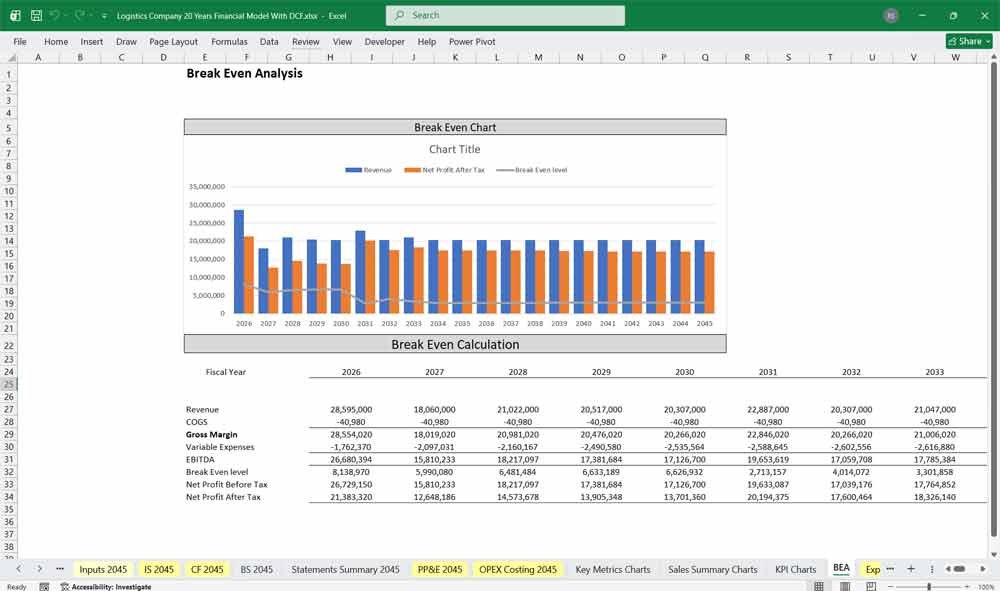
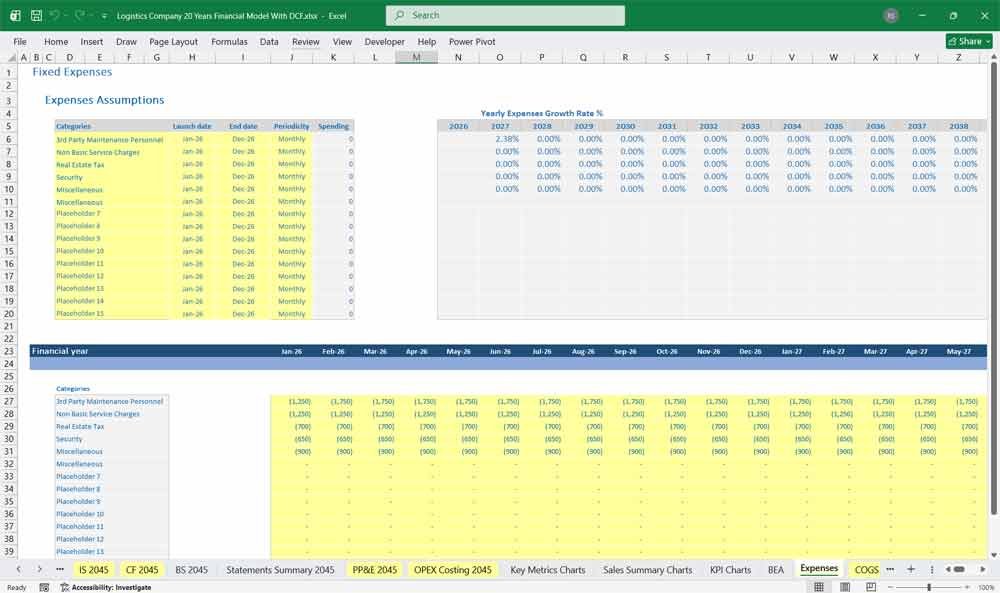
This very extensive 20 Year logistics company Model involve detailed revenue projections, cost structures, capital expenditures, and financing needs. This model provides a thorough understanding of the financial viability, profitability, and cash flow position of your plant’s financials. Includes: 20x Income Statements, Cash Flow Statements, Balance Sheets, CAPEX sheets, OPEX Sheets, Statement Summary Sheets, and Revenue Forecasting Charts, with the revenue streams, BEA charts, sales summary charts, employee salary tabs and expenses sheets.
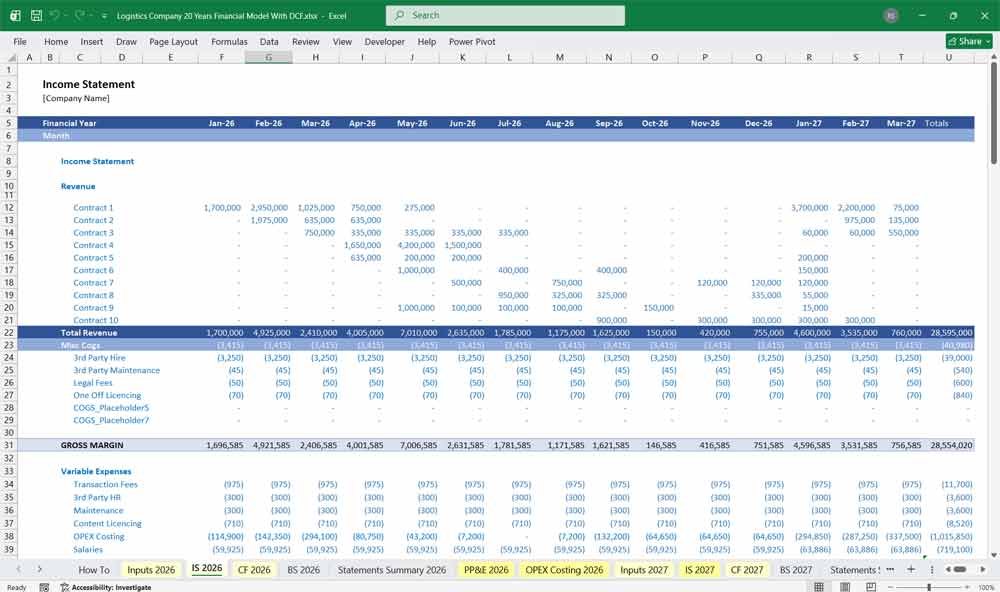
Income Statement (P&L)
The Income Statement reflects operational profitability by matching revenues earned against direct operating costs and administrative overhead over a specific period.
Gross Revenue
Transport Revenue (POD-verified)
Storage & Warehousing Revenue
Accessorial & Fuel Surcharge Revenue
Cost of Goods Sold (COGS / Direct Logistics Costs)
Direct Driver Costs: Driver wages, overtime, mileage pay, benefits, and third-party driver staffing/subcontractor costs.
Fuel Expenses: Gross diesel/gasoline expenditures for tractors/trucks.
Direct Warehouse Labor: Forklift operator wages, warehouse staff pay, and picker/packer costs.
Material Costs & Warehouse Consumables (Detailed OPEX):
Wooden Pallets: Expenses related to purchasing standard block/stringer pallets, GMA pallets, pallet rental costs (e.g., CHEP/PECO pooling fees), and ongoing pallet repair/maintenance costs.
Ratchet Straps: Ongoing replacement costs for load securement straps, wear-and-tear replacement, and compliance inspections.
Chains & Binder Systems: Heavy-duty load securement hardware, chain replacements, tensioners, and tie-down maintenance for flatbed and specialized trailers.
Secondary Packaging: Stretch wrap, banding, edge protectors, and corrugated packing materials.
Direct Fleet Operational Expenses: Road tolls, weigh station fees, scale charges, third-party cargo insurance, and fleet tracking (ELD/telematics) software subscriptions.
Operating Expenses (OPEX / SG&A)
Sales & Marketing: Broker commissions, customer acquisition costs, client entertainment, and marketing campaigns.
General & Administrative (G&A): Management salaries, HR, accounting, back-office IT systems (TMS/WMS software licenses), legal fees, and office expenses.
Facility Operating Overhead: Non-direct warehouse expenses including facility utilities (power, heating, lighting), building maintenance, security systems, and property insurance.
Equipment Maintenance & Operations: Scheduled and unscheduled vehicle maintenance, oil changes, tire replacement/recapping, engine overhauls, and general truck/trailer repairs.
Depreciation & Amortization (D&A)
Depreciation of Heavy Trucks (Tractors)
Depreciation of Freight Trailers
Depreciation of Warehouse Buildings & Yard Infrastructure
Depreciation of Material Handling Equipment (Forklifts, Racking)
Amortization of Intangible Assets (Logistics Software, Customer Contracts)
Non-Operating Items & Net Income
Interest Expense: Interest payments on equipment financing loans, truck leases, terminal mortgages, and revolving lines of credit.
Interest Income: Earnings on cash reserves.
Tax Provision: State, local, and federal income taxes.
Non-Operating Items & Net Income
Interest Expense: Interest payments on equipment financing loans, truck leases, terminal mortgages, and revolving lines of credit.
Interest Income: Earnings on cash reserves.
Tax Provision: State, local, and federal income taxes.
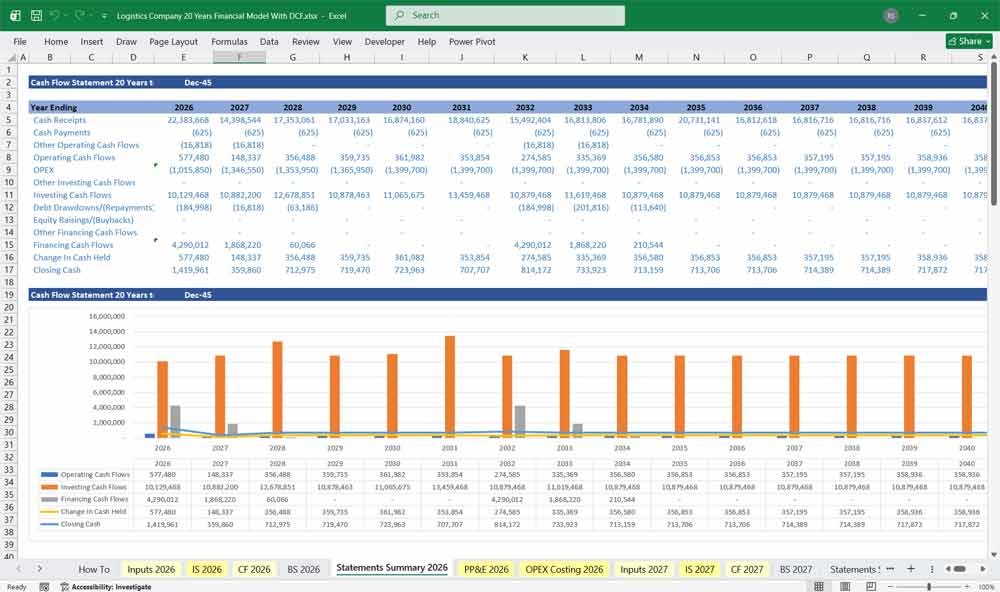
Logistics Company Cash Flow Statement
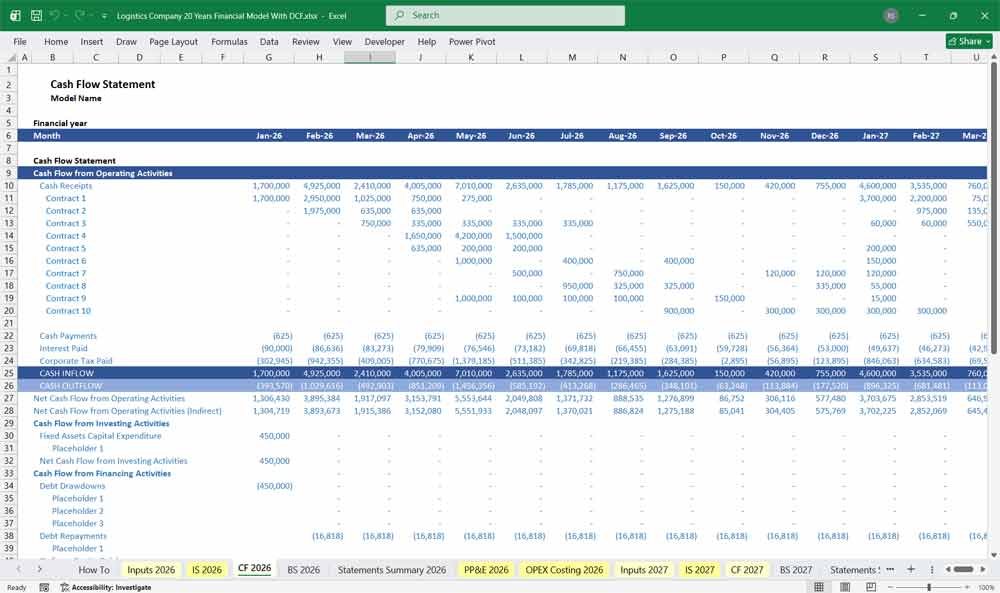
The Cash Flow Statement tracks the actual inflow and outflow of cash, reconciling net income from the Income Statement to the change in cash on the Balance Sheet.
1. Cash Flow from Operating Activities (Indirect Method)
Net Income (Starting point from the Income Statement)
Adjustments for Non-Cash Items:
(+) Depreciation & Amortization (trucks, trailers, warehouses, racking, forklifts)
(+) Stock-based compensation or non-cash losses on asset sales
(-) Gains on the sale of used trucks or trailers
Changes in Working Capital:
(-/+) Change in Accounts Receivable (Growth locks up cash in unpaid POD invoices)
(-/+) Change in Unbilled Logistics Revenue
(-/+) Change in Consumable Material Inventory (Cash spent to stockpile pallets, straps, chains, and wrap)
(-/+) Change in Prepaid Expenses
(+/-) Change in Accounts Payable (Delaying supplier payments preserves operational cash)
(+/-) Change in Accrued Expenses
2. Cash Flow from Investing Activities
Capital Expenditures (CapEx):
(-) Purchase of Class 7/8 Trucks and power units
(-) Purchase of Dry Vans, Reefers, and Flatbed Trailers
(-) Expansion or acquisition of Warehouses and Freight Terminals
(-) Purchase of Material Handling Equipment (Forklifts, high-density racking)
Asset Disposals:
(+) Cash proceeds received from selling aged/retired trucks, trailers, or real estate
3. Cash Flow from Financing Activities
Debt Issuance & Repayments:
(+) Proceeds from new fleet financing loans, equipment term loans, or mortgages
(-) Principal payments made on truck financing, trailer debt, and mortgages
(+/-) Net draws or repayments on revolving credit facilities (used for working capital smooth-out)
Equity & Shareholder Transactions:
(+) Injections of capital from equity partners or investors
(-) Cash dividend payments, distributions, or share repurchases
Net Reconciliation
Net Change in Cash = Operating Cash Flow + Investing Cash Flow + Financing Cash Flow
Beginning Cash Balance (From the start of the period)
Ending Cash Balance = Beginning Cash Balance + Net Change in Cash (Matches Cash on the Balance Sheet)
Logstics Company Balance Sheet
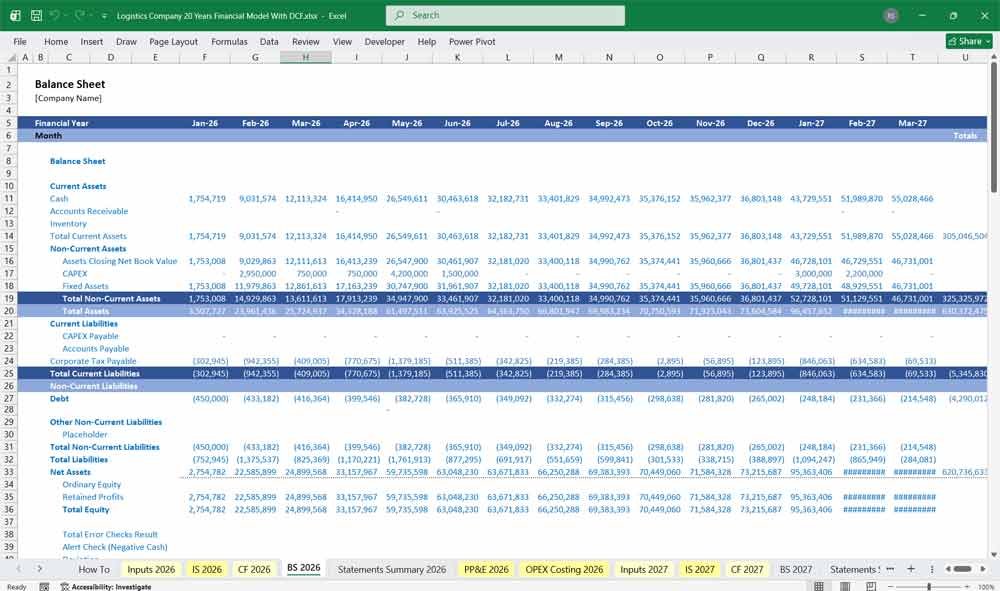
The Balance Sheet provides a snapshot of the company’s financial position, detailing assets, liabilities, and equity at a given point in time.
Current Assets
Cash & Cash Equivalents: Operating cash balances held for payroll, fuel, and working capital needs.
Accounts Receivable (A/R): Billed shipments awaiting payment from clients. Includes a deduction for Allowance for Doubtful Accounts. (Crucial metric: Days Sales Outstanding / DSO).
Unbilled Logistics Revenue: Shipments completed (signed PODs received) but not yet invoiced to customers.
Consumable Material Inventory: On-hand physical stock of wooden pallets, replacement ratchet straps, load securement chains, shrink wrap, and spare vehicle parts.
Prepaid Expenses: Upfront payments for commercial fleet insurance policies, software licenses, property taxes, and permits.
Non-Current Assets (Property, Plant & Equipment – PP&E)
PP&E Breakdown:
Trucks (Class 7 & Class 8 Tractors, Straight Trucks): Historical cost of power units used for line-haul and local delivery.
Trailers: Historical cost of dry vans, refrigerated units (reefers), flatbeds, and specialized chassis.
Warehousing & Buildings: Historical cost of owned distribution centers, cross-dock facilities, freight terminals, and land.
Warehouse Infrastructure & Equipment: Pallet racking systems, automated storage/retrieval systems (ASRS), dock levelers, yard ramps, and forklifts/reach trucks.
Less: Accumulated Depreciation (Combined accumulated depreciation across all PP&E asset classes).
Net PP&E: Total historical PP&E cost less Accumulated Depreciation.
Other Non-Current Assets: Long-term security deposits for leased warehouses, lease-of-right assets (under IFRS 16 / ASC 842), and goodwill/intangible software assets.
Current Liabilities
Accounts Payable (A/P): Outstanding vendor invoices for fuel, material suppliers (pallets, straps, chains), third-party repair shops, and subcontractors.
Accrued Expenses: Unpaid driver wages, driver performance bonuses, accrued utility bills, and accrued property taxes.
Short-Term Debt & Current Portion of Long-Term Debt (CPLTD): Principal payments due within 12 months on truck loans, equipment notes, and warehouse mortgages.
Operating Lease Liabilities (Current): Short-term lease obligations for rented trucks, trailers, or warehouse spaces.
Non-Current Liabilities
Long-Term Debt: Outstanding principal balances on vehicle financing, trailer loans, and real estate term loans due after 12 months.
Operating/Capital Lease Liabilities (Non-Current): Long-term obligations for leased fleet and facilities.
Deferred Tax Liabilities: Tax liabilities resulting from timing differences in depreciation methods (e.g., straight-line for financial reporting vs. accelerated tax depreciation).
Stockholders’ Equity
Contributed Capital / Common Stock: Initial and subsequent equity funding from investors/owners.
Retained Earnings: Cumulative net income generated by operations minus dividends/distributions paid to owners.
Key Financial Mechanics & Inter-Statement Integration
Consumable Material Accounting Flow (Pallets, Straps, Chains):
When pallets, straps, and chains are purchased in bulk, cash decreases on the Cash Flow Statement (Operating Cash Flow), and asset inventory increases on the Balance Sheet under Consumable Material Inventory.
As these items are used, damaged, or deployed in operations, their value is expensed through the Income Statement under COGS – Consumable Materials. This lowers taxable income and reduces inventory on the Balance Sheet.
Asset Purchase & Depreciation Dynamics (Trucks, Trailers, Warehouses):
Purchasing a fleet of trucks or a warehouse creates a cash outflow under Investing Activities (CapEx) on the Cash Flow Statement and increases Gross PP&E on the Balance Sheet.
Over time, Depreciation Expense is recognized on the Income Statement, reducing net income.
This non-cash depreciation is added back to Net Income in Operating Cash Flow and accumulates in Accumulated Depreciation on the Balance Sheet, lowering Net PP&E.
POD Revenue to Cash Conversion:
When a driver delivers freight and signs a POD, revenue is recognized on the Income Statement. Simultaneously, Accounts Receivable increases on the Balance Sheet.
Cash is not realized until the customer settles the invoice. The timing difference between POD sign-off and cash collection is captured in the Working Capital adjustments of the Cash Flow Statement.
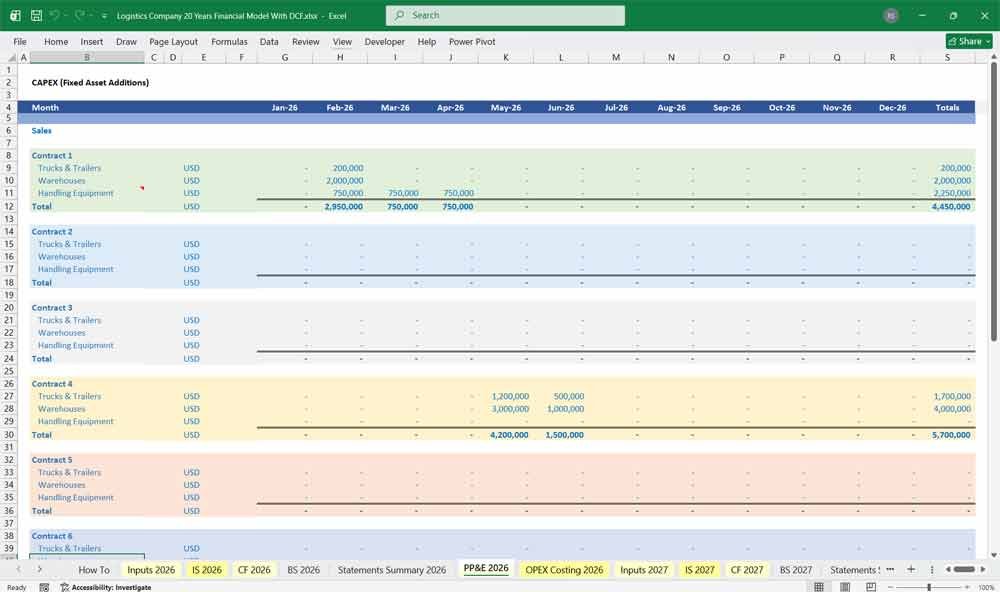
Capital Expenditure (CAPEX) Schedule
A logistics company requires substantial upfront and sustaining capital. The CAPEX schedule models the purchase price, delivery costs, useful life, and salvage value of warehouse machinery, which directly drives the depreciation schedule.
Key Items
Tractor Units: In a logistics company’s financial model, Trucks (straight trucks, and tractors) represent one of the largest ongoing Capital Expenditure (CapEx) requirements. Rather than being expensed immediately on the Income Statement, these major purchases are capitalized as long-term physical assets under Property, Plant & Equipment (PP&E) on the Balance Sheet. The cash outflow for acquiring new power units—or replacement vehicles to maintain fleet age standards—is recorded under Cash Flow from Investing Activities. Over their operational life (typically 3 to 7 years), the value of the trucks is systematically written off through depreciation expense on the Income Statement, which reduces Net PP&E on the Balance Sheet and is added back as a non-cash expense in Cash Flow from Operations.
Trailers: including dry vans, refrigerated units (reefers), and flatbeds—represent a major non-powered asset class within a logistics company’s Capital Expenditure (CapEx) strategy. When acquired, these long-term revenue-generating assets are capitalized on the Balance Sheet under Property, Plant & Equipment (PP&E), and their upfront purchase prices are recorded as cash outflows under Cash Flow from Investing Activities. Because trailers generally experience less mechanical wear than power units, they carry longer operational lifespans (typically 8 to 12 years). Over this period, their cost is systematically reduced via straight-line or accelerated depreciation on the Income Statement, which offsets gross revenue while being added back as a non-cash adjustment in Cash Flow from Operations.
Value Your Logistics Company With A DCF
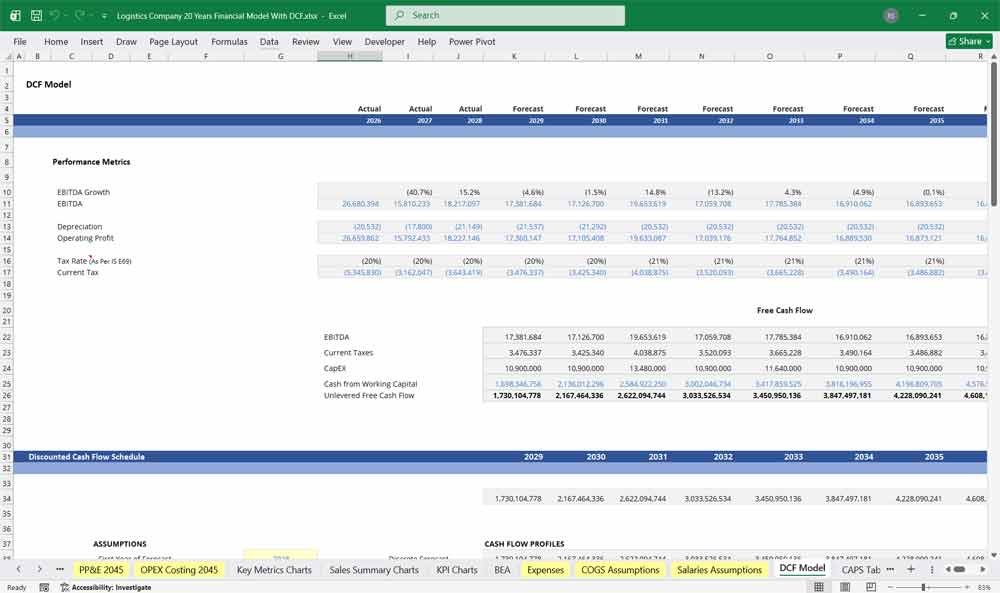
20-Year Discounted Cash Flow (DCF): Valuing Fleet Lifecycle Efficiency and Network Density
In a 20-year Discounted Cash Flow (DCF) analysis for a logistics company, the valuation models a long-term interplay between freight volume growth, route density, and heavy fleet replacement cycles. The model projects cash flows driven by long-haul transportation fees, last-mile delivery services, and contract warehousing, offset by recurring CapEx for tractor-trailer fleet refresh, automated sorting hubs, and fleet electrification or alternative-fuel conversions. Over a two-decade horizon, the DCF must factor in periodic macroeconomic freight recessions and fuel price spikes. The Terminal Value represents a significant portion of total NPV, reflecting the company’s permanent network moat—its strategically located distribution centers, cross-dock facilities, and proprietary route-optimization logistics software that cannot be easily replicated by new entrants.
WACC: Pricing Freight Cyclicality and Capital Assets
The Weighted Average Cost of Capital (WACC) for a logistics company typically ranges from 7.5% to 10.5%, reflecting a capital structure supported by tangible, asset-backed collateral. Because logistics providers own large fleets of vehicles, real estate hubs, and material-handling equipment, they can readily secure low-cost senior equipment debt and asset-backed loans, keeping the overall cost of debt low. However, the Cost of Equity carries a notable premium due to a high “Macroeconomic Freight Beta.” Investors demand a higher hurdle rate to shield future cash flows from consumer spending downturns, volatile diesel prices, rising driver wages, and potential supply-chain bottlenecks that can quickly erode operating margins across the network.
Sensitivity Analysis: Stress-Testing Load Factors and Fuel Margins
For a logistics business, Sensitivity Analysis is the primary tool for evaluating margin elasticity in a low-margin, high-volume environment. Financial analysts build sensitivity matrices to test how a 15% spike in net fuel expenses or a 10% drop in average freight rates per mile impacts the company’s operating margin and free cash flow. The most critical variables to cross-reference are Fleet Load Factor % (capacity utilization) and Deadhead Miles % (unloaded miles driven). Because vehicle financing, driver salaries, and insurance represent high fixed costs, carrying empty capacity directly destroys profitability. The sensitivity table pinpoints the exact capacity utilization rate needed to maintain positive cash flow when spot freight rates drop.
Final Notes on the Financial Model
This 20 Year Logistics Company Financial Model Excel Template focuses on balancing capital expenditures with steady revenue growth from various logistical services. By optimizing operational costs, and operating efficiency, and maximizing high-margin services, the models ensure sustainable profitability and cash flow stability.
Download Link On Next Page
Download Link On Next Page