
10 Year Hotel Financial Model Template Excel
This 10 Year Hotel Financial Model Template Excel is a fully-dynamic underwriting template built for hotel acquisitions, refinancings, and asset management. Modeled on industry-standard hospitality accounting, it tracks rooms revenue, food and beverage, meetings and banquets, spa, parking, and other operated departments, then rolls everything up through departmental profit, gross operating profit, and NOI — giving hotel investors, brokers, lenders, and asset managers a single, audit-ready source of truth for every deal.
10 Year Financial Model for a Hotel
Built across 14 fully-linked tabs, this hotel acquisition model combines monthly operating detail with a clean annual summary spanning two years of historical performance and a ten-year forecast. Every formula flows from a single assumptions tab, so changing occupancy, ADR, financing terms, or exit cap rate instantly recalculates the entire hotel pro forma — from Sources & Uses and the debt schedule through cash flow, DCF valuation, sponsor returns, and exit proceeds.
Whether you’re underwriting a hotel acquisition, preparing a lender or investment committee package, stress-testing a deal with sensitivity analysis, or teaching hospitality real estate finance, this hotel valuation model gives you a professional, error-checked framework in minutes instead of weeks. No macros, no plugins — just a clean, color-coded Excel hotel investment model ready to plug in your own numbers and go.
Why Buy This Model
Building a hotel financial model from scratch takes days of formula-wiring before you even get to the numbers that matter — occupancy, ADR, financing, and returns. This template skips that step. Every tab is pre-built, cross-linked, and stress-tested: change one assumption and the operating model, debt schedule, cash flow, DCF, returns, and exit analysis all update automatically, with zero broken formulas. It follows a familiar hospitality operating structure (rooms through NOI), so brokers, lenders, and investment committees can review it without a learning curve. A built-in Checks tab flags any inconsistency before you ever send the file out, and a genuine IRR sensitivity grid — not a rough estimate — lets you defend your underwriting under different rate and growth scenarios. For the price of a few hours of analyst time, you get a bank-grade, reusable hotel acquisition model you can run on every deal going forward.
Hotel Tab-By-Tab Breakdown Highlights
01. Cover Summary
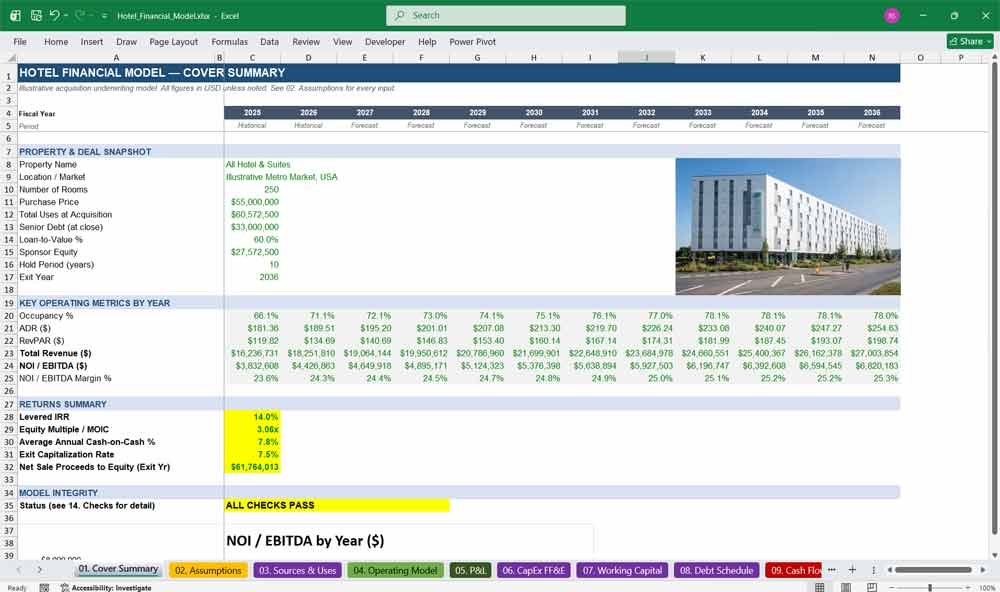
The Cover Summary tab gives investors and lenders an instant, one-page snapshot of the hotel deal — property profile, purchase price, capital structure, occupancy, ADR, RevPAR, NOI growth, levered IRR, equity multiple, and exit proceeds — backed by a live model-integrity status check.
Highlights:
- One-page deal snapshot: property details, purchase price, debt, and equity at a glance
- 12-year key operating metrics table (occupancy, ADR, RevPAR, revenue, NOI, margin)
- Levered IRR, equity multiple, average cash-on-cash, and exit cap rate front and center
- Live NOI trend chart and a real-time “all checks pass” model integrity indicator
02. Assumptions
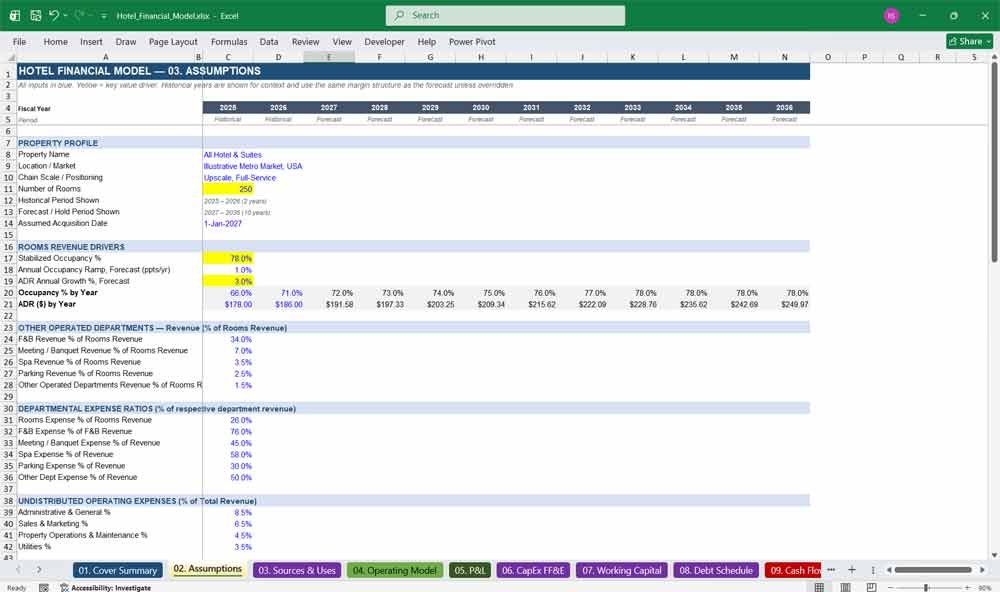
The Assumptions tab is the single control panel driving this hotel financial model — property profile, occupancy and ADR growth, departmental expense ratios, management and franchise fees, financing terms, exit cap rate, and monthly seasonality — so one edit updates the entire twelve-year forecast instantly.
Highlights:
- Every input clearly color-coded blue, with key value drivers flagged in yellow
- Occupancy ramp, ADR growth, and stabilization logic built in as live formulas
- Full financing, valuation, and working capital assumptions in one organized location
- Monthly occupancy and ADR seasonality index for realistic month-by-month modeling
03. Sources & Uses
The Sources & Uses tab lays out the full capital stack at acquisition — purchase price, closing costs, renovation budget, and loan origination fees against senior debt and sponsor equity — with an automatic balancing check, loan-to-cost ratio, and price-per-key metric for fast deal screening.
Highlights:
- Automated Sources = Uses balancing check, so the capital stack always ties out
- Loan-to-cost, equity percentage, and price-per-key calculated automatically
- Fully linked to the Debt Schedule and Returns tabs — change the price, everything updates
- Clean, lender-ready presentation format for term sheets and investment memos
Hotel Financing
04. Operating Model
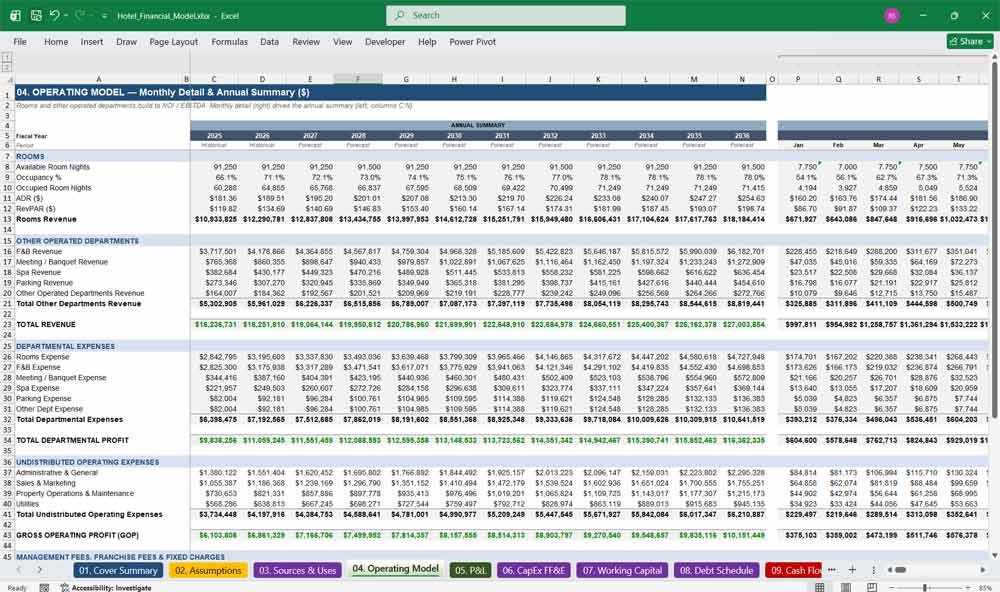
The Operating Model is the engine of this hotel pro forma, building monthly and annual rooms, F&B, and other-department revenue through departmental expenses, undistributed operating expenses, GOP, management and franchise fees, and NOI — a full USALI-style income statement with live monthly detail.
Highlights:
- Monthly detail (144 columns) plus a linked annual summary for every metric
- Complete rooms KPI build: available and occupied room nights, occupancy, ADR, RevPAR
- Every department (F&B, meetings, spa, parking, other) flows through to GOP and NOI
- Built-in margin memos (GOP margin, NOI margin) for instant benchmarking
05. P&L
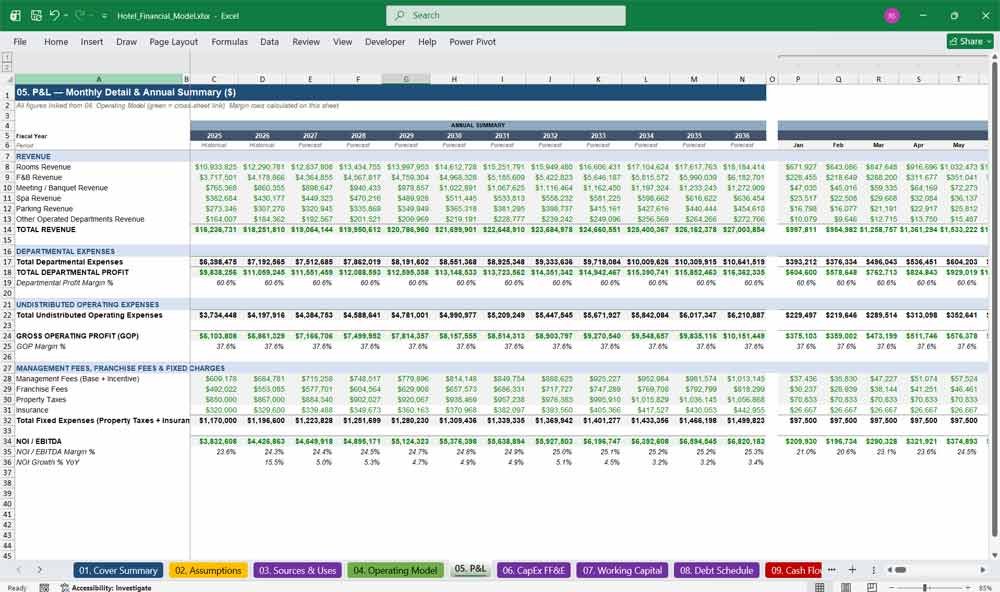
The P&L tab restates the full hotel operating statement in clean, presentation-ready form — revenue through NOI/EBITDA — with every figure linked live from the Operating Model, plus margin and year-over-year NOI growth calculations, making it ideal for investor decks, lender packages, and management reporting.
Highlights:
- Investor- and lender-ready income statement format, monthly and annual
- Departmental profit margin, GOP margin, and NOI margin calculated automatically
- Year-over-year NOI growth tracked at the annual level
- Fully linked (not re-typed) from the Operating Model — zero duplicate formulas
06. CapEx FF&E
The CapEx / FF&E tab models the ongoing furniture, fixtures and equipment reserve as a percentage of total revenue alongside the one-time renovation or PIP budget funded at acquisition, tracking cumulative reserve balances so buyers can plan capital needs across the full hold period.
Highlights:
- FF&E reserve automatically calculated as a % of total revenue, every year
- One-time PIP / renovation budget linked directly from Sources & Uses
- Running cumulative FF&E reserve balance tracked across the entire hold period
- Total CapEx by year, ready to feed the Cash Flow statement
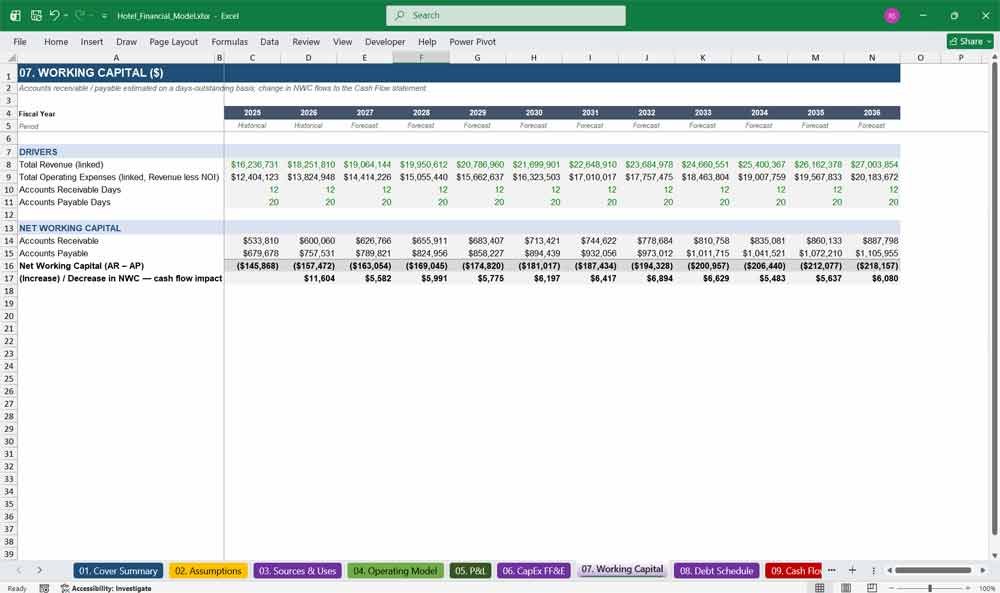
07. Working Capital
The Working Capital tab estimates accounts receivable and accounts payable on a days-outstanding basis tied to total revenue and operating expenses, then calculates the year-over-year change in net working capital that flows directly into unlevered free cash flow for accurate valuation.
Highlights:
- AR and AP modeled on configurable days-outstanding assumptions
- Net working capital calculated automatically every year of the hold period
- Change in NWC flows straight into the Cash Flow and DCF tabs
- Simple, editable drivers so buyers can match their own operating experience
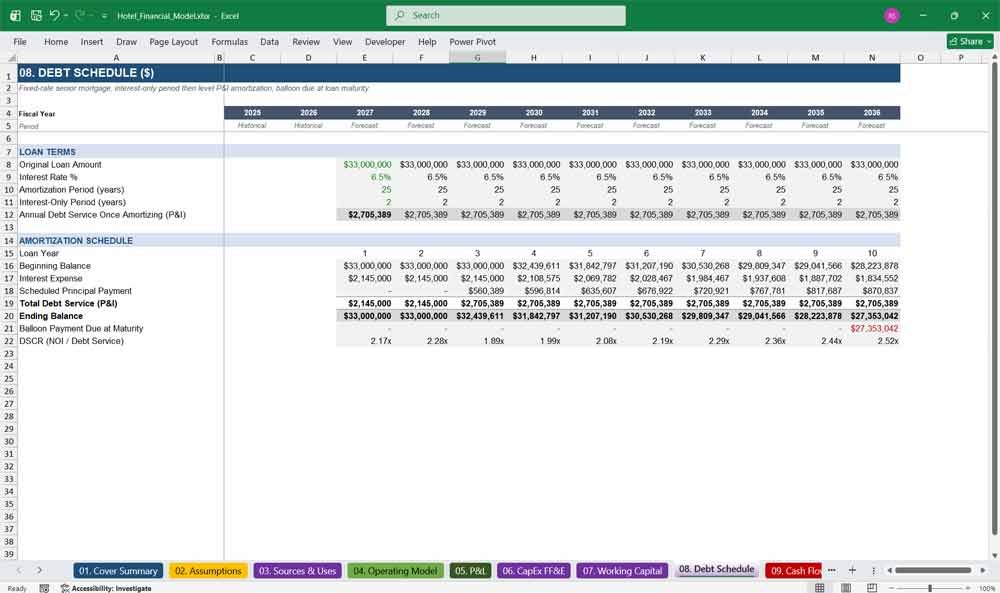
08. Debt Schedule
The Debt Schedule models a fixed-rate senior mortgage with an interest-only period followed by level amortization, tracking beginning and ending balances, interest, principal, total debt service, DSCR, and the balloon payment due at maturity — everything a lender or sponsor needs to underwrite financing.
Highlights:
- Interest-only period plus standard mortgage-style amortization, fully automated
- Beginning balance, interest, principal, and ending balance calculated year by year
- DSCR calculated automatically against NOI for lender covenant testing
- Balloon payment at maturity flows directly into the Exit tab payoff calculation
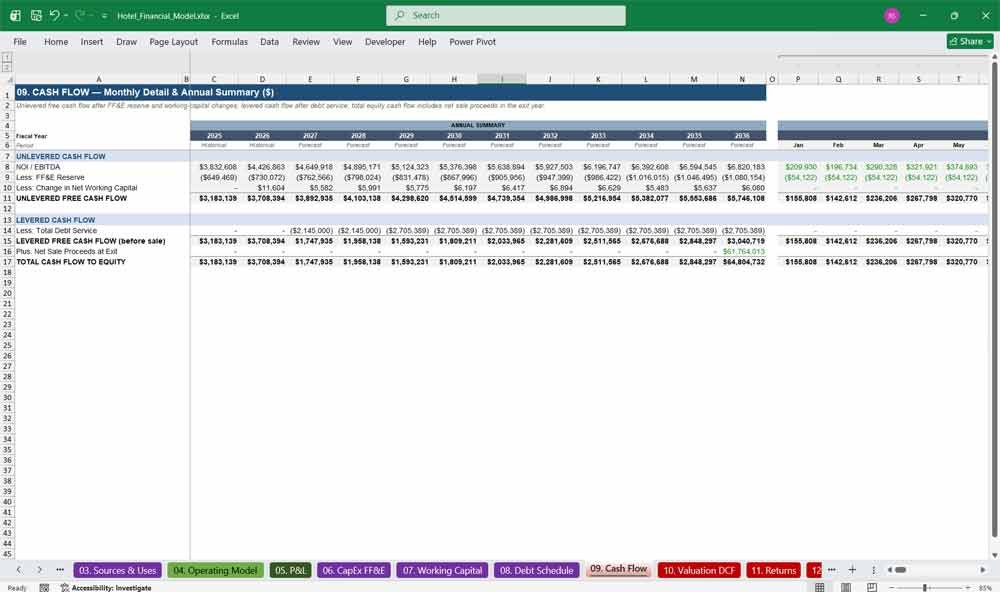
09. Cash Flow
The Cash Flow tab converts NOI into unlevered and levered free cash flow, deducting the FF&E reserve, working capital changes, and debt service, then layering in net sale proceeds at exit — the full monthly and annual cash flow stream driving returns and valuation.
Highlights:
- Monthly and annual unlevered and levered free cash flow, fully linked
- FF&E reserve and working capital changes automatically deducted from NOI
- Debt service flows directly from the Debt Schedule tab
- Net sale proceeds wired into the exit year for a complete cash flow picture
Value Your Hotel With A DCF
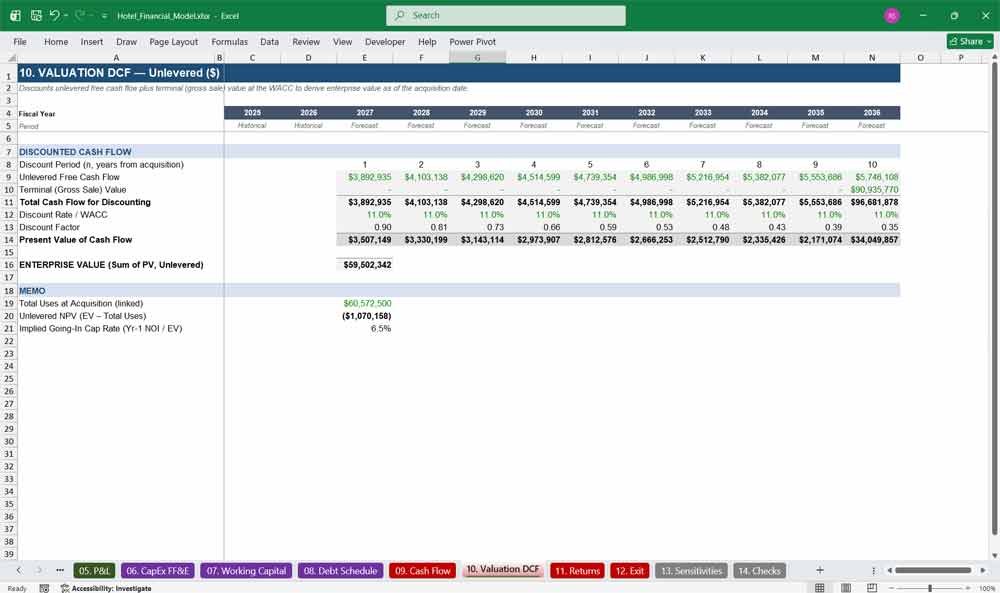
10. Discounted Cash Flow Valuation (DCF)
The Valuation DCF tab discounts unlevered free cash flow plus terminal exit value at the WACC to derive enterprise value as of the acquisition date, with an implied going-in cap rate and NPV check — a defensible discounted cash flow valuation for any hotel deal.
Highlights:
- Full ten-year discounted cash flow with a linked terminal/exit value
- Discount rate, discount factor, and present value calculated year by year
- Implied going-in cap rate and unlevered NPV shown automatically
- Cross-checks cleanly against the purchase price and Sources & Uses
11. Returns
The Returns tab calculates sponsor-level equity cash flows, levered IRR, equity multiple (MOIC), and annual cash-on-cash returns across the full hold period — the metrics every investor, partner, and investment committee asks for first when evaluating a hotel acquisition opportunity.
Highlights:
- Levered IRR and equity multiple calculated automatically from real cash flows
- Year-by-year cash-on-cash return, plus a clean average across the hold period
- Full equity cash flow waterfall from initial investment through final exit
- Investor-ready return metrics, highlighted for fast reference
12. Exit
The Exit tab dynamically calculates sale value in whichever year is chosen as the exit year, applying the exit cap rate to trailing NOI, deducting selling costs and outstanding debt, and solving for net sale proceeds to equity — fully automated, no manual re-linking.
Highlights:
- Exit year is a single adjustable assumption — the whole tab updates automatically
- Gross sale price calculated from exit NOI divided by exit cap rate
- Selling costs and outstanding loan payoff deducted automatically
- Cap rate spread versus entry cap rate calculated for a quick sanity check
13. Sensitivities
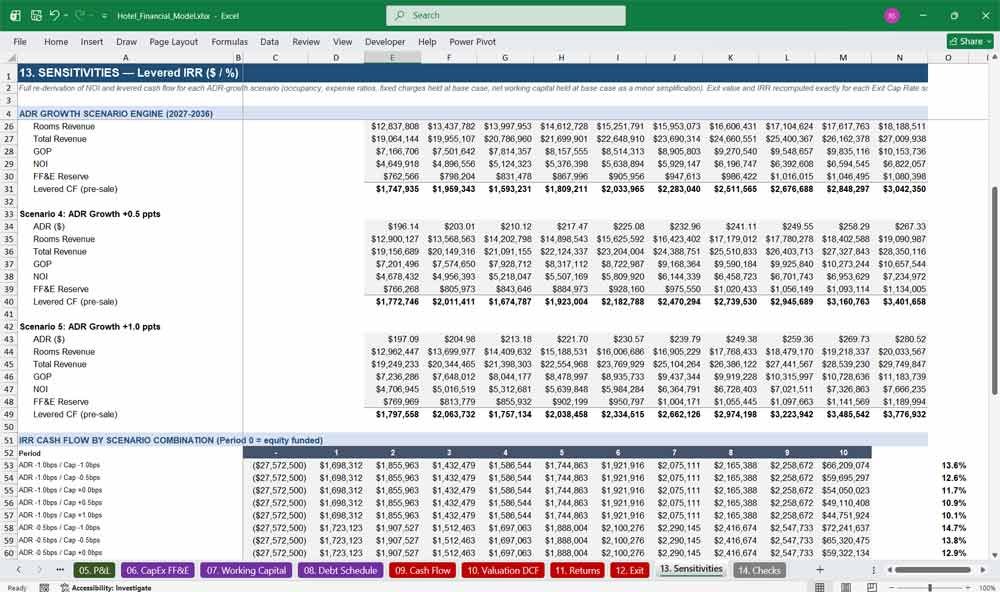
The Sensitivities tab stress-tests levered IRR against ADR growth and exit cap rate assumptions using a genuine 25-scenario recalculation engine — not a rough approximation — so buyers can see exactly how returns move under more conservative or more aggressive market conditions.
Highlights:
- 5×5 IRR sensitivity grid across ADR growth and exit cap rate scenarios
- Full recalculation of NOI and cash flow for every scenario, not an estimate
- Base-case scenario reconciles exactly back to the Returns tab
- Clear, color-coded grid for instant “what-if” investment committee discussions
14. Checks
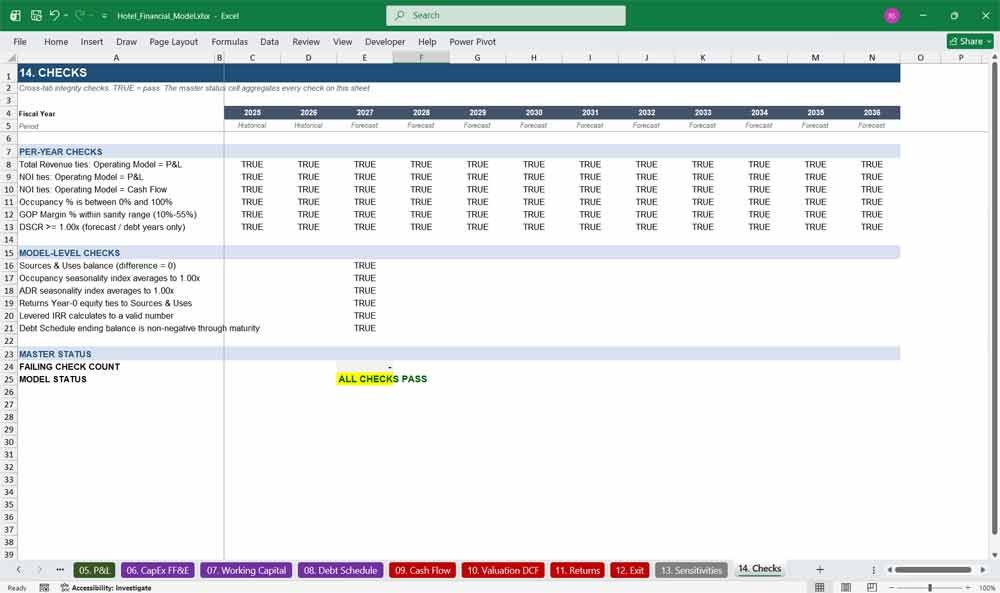
The Checks tab automatically audits the entire hotel financial model — confirming revenue and NOI tie across every tab, occupancy and margins fall within realistic ranges, Sources equal Uses, and IRR calculates cleanly — giving buyers a one-click integrity check before sharing the file.
Highlights:
- Automated cross-tab ties for revenue, NOI, and capital structure
- Sanity checks on occupancy, GOP margin, and debt service coverage
- Single master “All Checks Pass” status cell for instant confidence
- Catches broken links or formula errors before the model reaches a lender
Hotel Financial Model Faq
Q: What exactly is included in this hotel financial model?
A: You get a single Excel workbook with 14 fully-linked tabs covering everything from property assumptions and the operating model through debt, cash flow, DCF valuation, sponsor returns, exit analysis, sensitivities, and a built-in error-checking tab — a complete hotel acquisition underwriting package in one file.
Q: Can I use my own numbers, or is it locked to the sample deal?
A: All inputs are open and clearly marked in blue on the Assumptions tab. Enter your own room count, ADR, occupancy, financing terms, and exit assumptions, and every other tab — operating model, debt schedule, cash flow, valuation, and returns — recalculates automatically.
Q: Does the model include monthly projections, or just annual?
A: Both. The Operating Model, P&L, and Cash Flow tabs include full monthly detail across the two-year historical period and ten-year forecast, plus a clean annual summary. All other tabs run on the annual summary for readability.
Q: What software do I need to open and use this file?
A: Just Microsoft Excel (2013 or later) or a compatible spreadsheet program. There are no macros, add-ins, or external plugins required — every calculation is a native Excel formula.
Q: Is this model suitable for lender or investment committee presentations?
A: Yes. The Cover Summary, Sources & Uses, and Returns tabs are formatted for direct use in lender packages and investment committee decks, and the Checks tab confirms the model is internally consistent before you share it.
Q: Does it calculate IRR, equity multiple, and cash-on-cash return?
A: Yes. The Returns tab automatically calculates levered IRR, equity multiple (MOIC), and both annual and average cash-on-cash returns from the model’s own linked cash flow projections.
Q: How is debt modeled — is it interest-only, amortizing, or both?
A: The Debt Schedule models a fixed-rate senior mortgage with an interest-only period followed by standard level amortization, plus DSCR calculations and an automatic balloon payment at loan maturity.
Q: Is there a sensitivity or scenario analysis included?
A: Yes. The Sensitivities tab includes a 25-scenario grid testing levered IRR against different ADR growth and exit cap rate assumptions, fully recalculated rather than approximated, so you can defend your underwriting under multiple market conditions.
Q: Do I need advanced Excel skills to use this model?
A: No. Every input is clearly color-coded, every tab is labeled and organized in a logical sequence, and the Checks tab tells you immediately if anything is inconsistent. Basic Excel familiarity is enough to fully operate the model.
Q: Can this model be adapted for a hotel refinancing or asset management analysis, not just an acquisition?
A: Yes. Because every assumption is editable and every tab is formula-driven, the model works equally well for refinancing analysis, hold/sell decisions, budgeting, and ongoing asset management, not only new acquisitions.
Q: How many years does the model project?
A: Two years of historical context (2025–2026) and a ten-year forecast (2027–2036), giving a full twelve-year view of performance and returns.
Q: How do I know the formulas are accurate and error-free?
A: The dedicated Checks tab automatically audits the entire workbook — cross-tab ties, balance checks, ratio sanity checks, and formula validity — and displays a single “All Checks Pass” status so you can verify integrity before relying on the numbers.
Overall view Of Financial Model
This 10 Year Hotel financial model provides a robust framework for understanding and forecasting the hotel’s financial performance. It integrates operational data from the reservation tracker and check-in template, offering valuable insights into how these activities drive revenue and affect costs, ultimately supporting better strategic decisions and financial planning.
Download Link On Next Page