
Greenfields Feedlot DCF Model Template
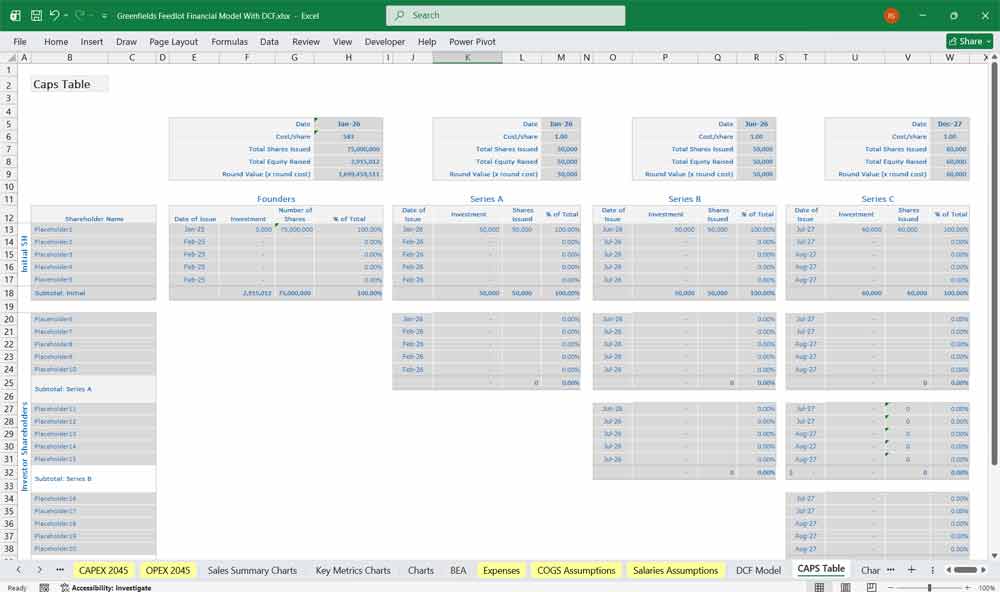
This 20–Year, 3-Statement Greenfields Feedlot DCF Model Template in Excel is an excellent resource if you’re either monitoring operations of your feedlot or building a cattle feedlot from scratch on undeveloped land, including purchasing feeder cattle, building pens, feed storage, water systems, handling facilities, roads, drainage, manure management, and grain-processing infrastructure. Cost structures, Discounted Cash Flow (DCF) with Terminal Value, Sensitivity Analysis, WACC, NPV and IRR and financial statements to forecast the financial health of your Feedlot.
20-Year Financial Model for a Greenfields Feedlot
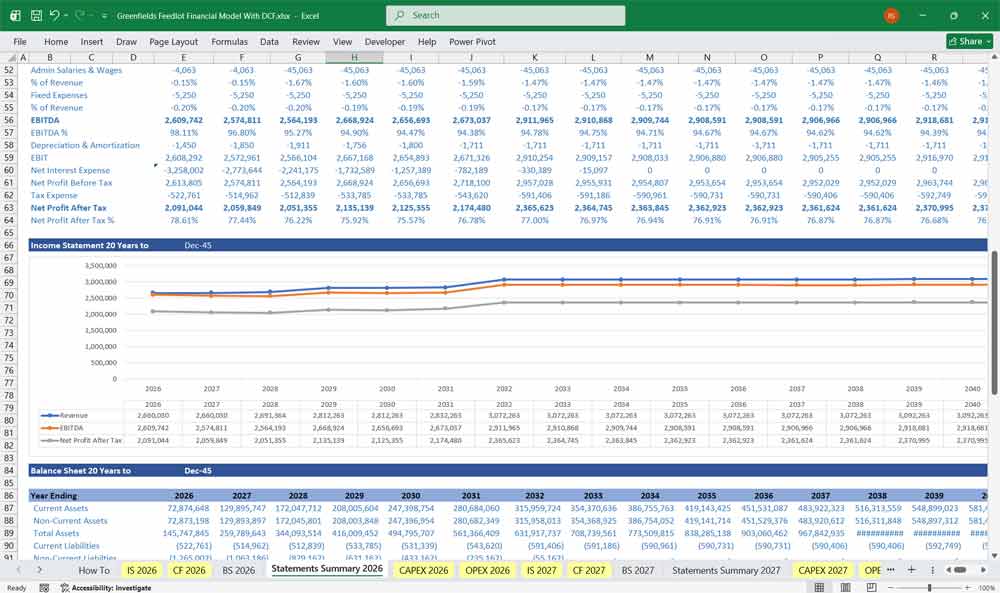
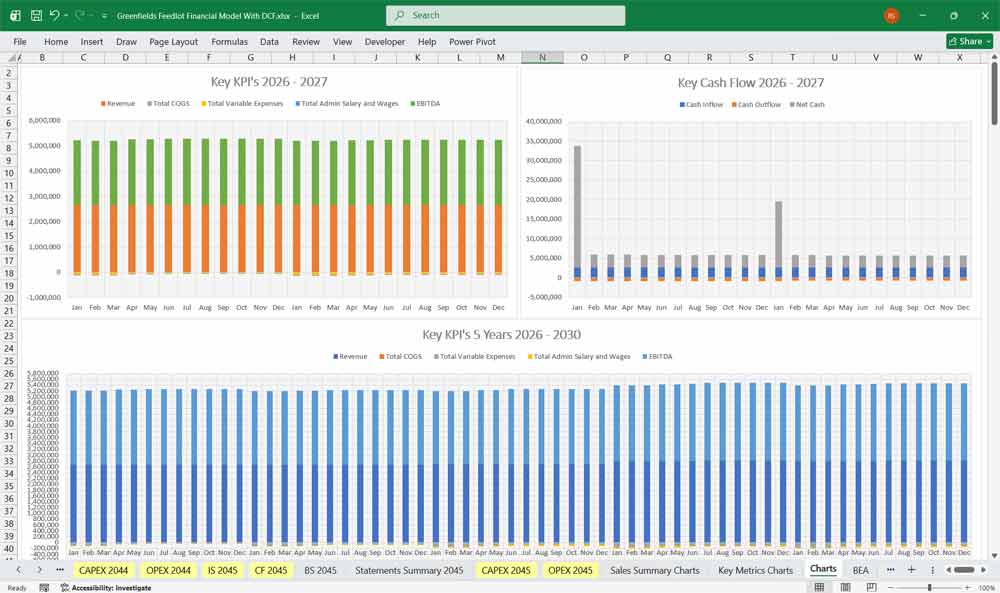
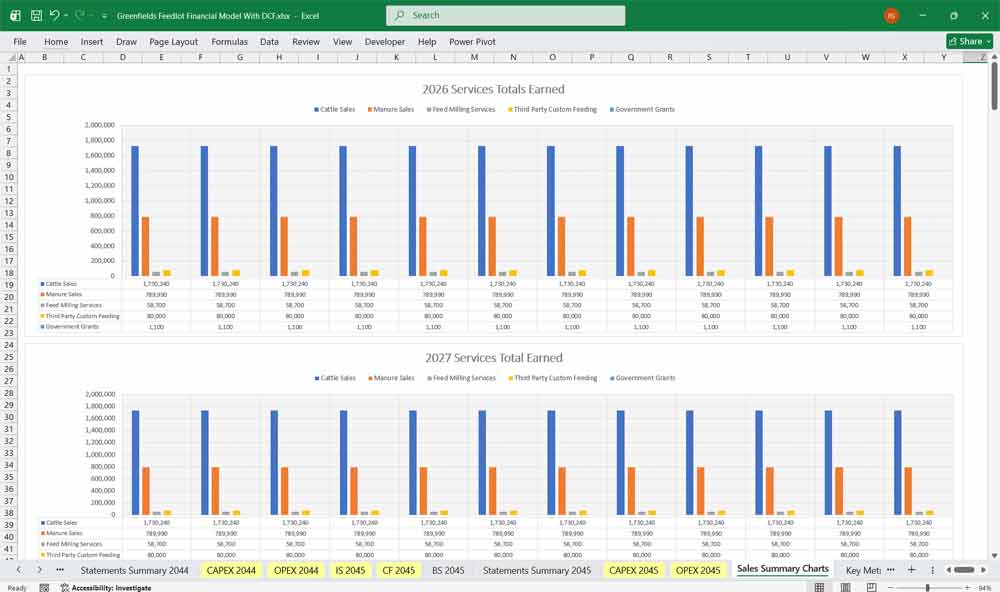
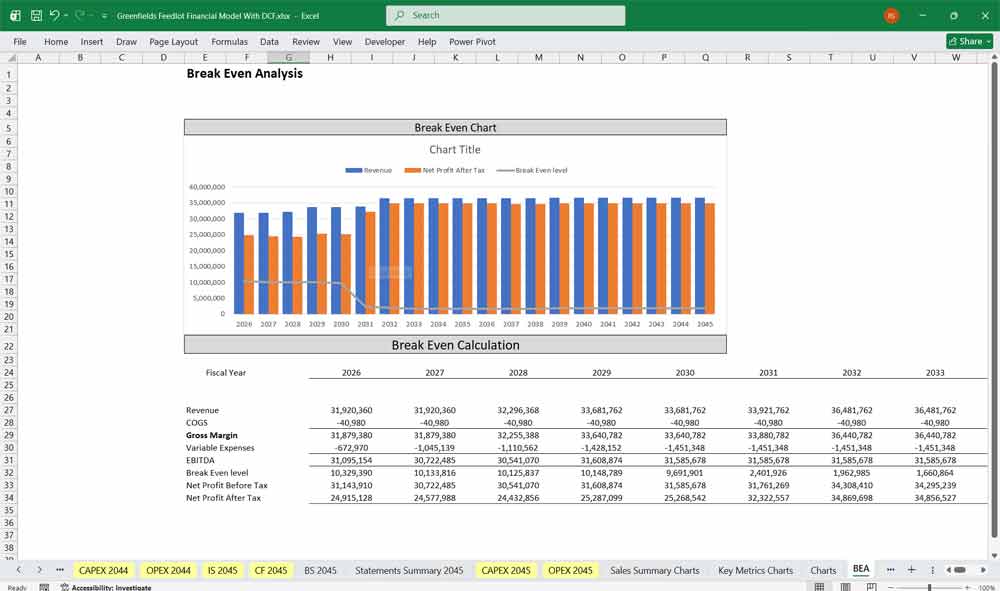
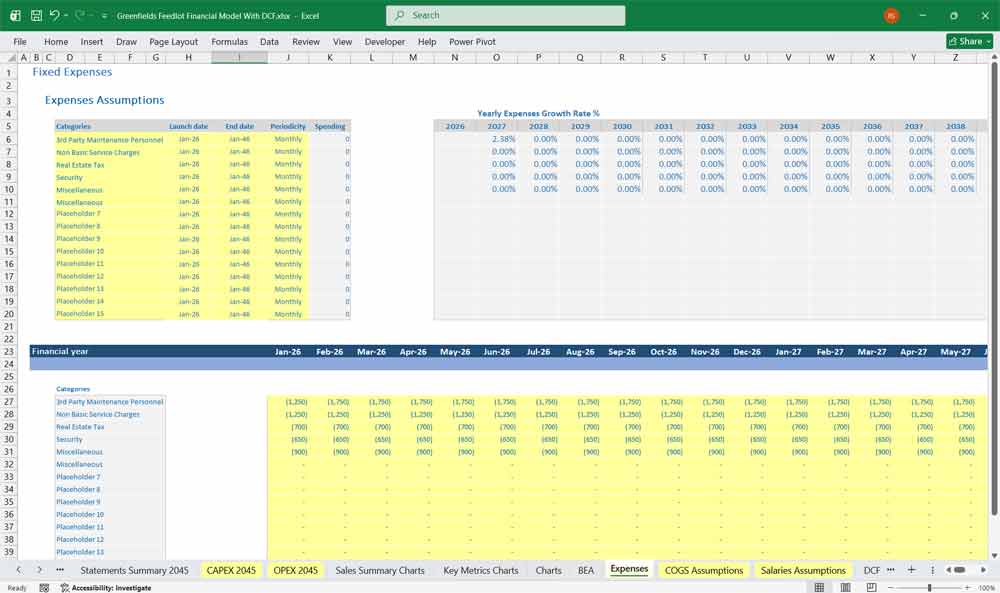
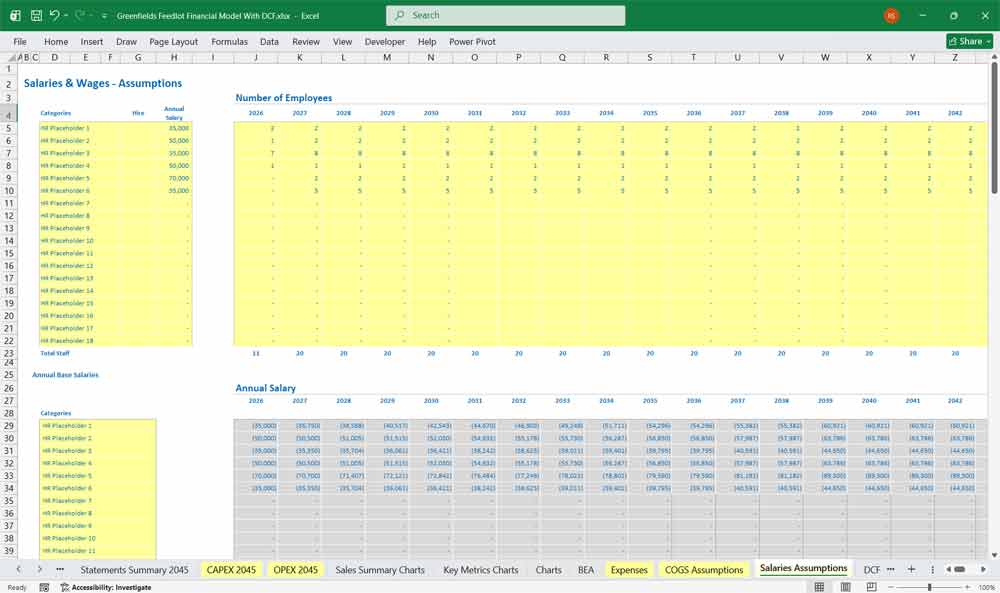
This very extensive 20 Year Feedlot Model involves detailed revenue projections, cost structures, capital expenditures, and financing requirements. This Excel model provides a thorough understanding of the financial viability, profitability, and cash flow position of your Feedlot’s financials. Includes: 20x Income Statements, Cash Flow Statements, Balance Sheets, CAPEX sheets, OPEX Sheets, Statement Summary Sheets, and Revenue Forecasting Charts, with the revenue streams, BEA charts, sales summary charts, employee salary tabs and expenses sheets.
Revenue Model
Revenue is generated primarily through the sale of finished cattle.
The revenue calculation should be driven by:
Number of cattle marketed × Average sale price per head
The model should separately calculate:
- Beginning livestock inventory
- New cattle purchases
- Mortality losses
- Finished cattle sales
- Ending livestock inventory
Additional revenue streams may include:
- Manure sales
- Feed milling services
- Custom feeding contracts
- Carbon credit revenues where applicable
Income Statement
The income statement should reflect the profitability of feedlot operations.
Revenue consists primarily of cattle sales.
Cost of goods sold includes:
- Feeder cattle costs
- Feed costs
- Veterinary costs
- Animal health expenses
- Freight costs associated with cattle purchases and sales
Gross profit represents the margin generated from converting feeder cattle into finished cattle.
Operating expenses should include:
- Labor
- Management salaries
- Utilities
- Fuel
- Repairs and maintenance
- Insurance
- Administrative expenses
- Regulatory compliance costs
Subtracting operating expenses from gross profit produces EBITDA.
Depreciation is then deducted to calculate EBIT.
Interest expense is deducted to calculate profit before tax.
Income taxes are applied to determine net income.
The income statement ultimately measures the profitability of the operation during each reporting period.
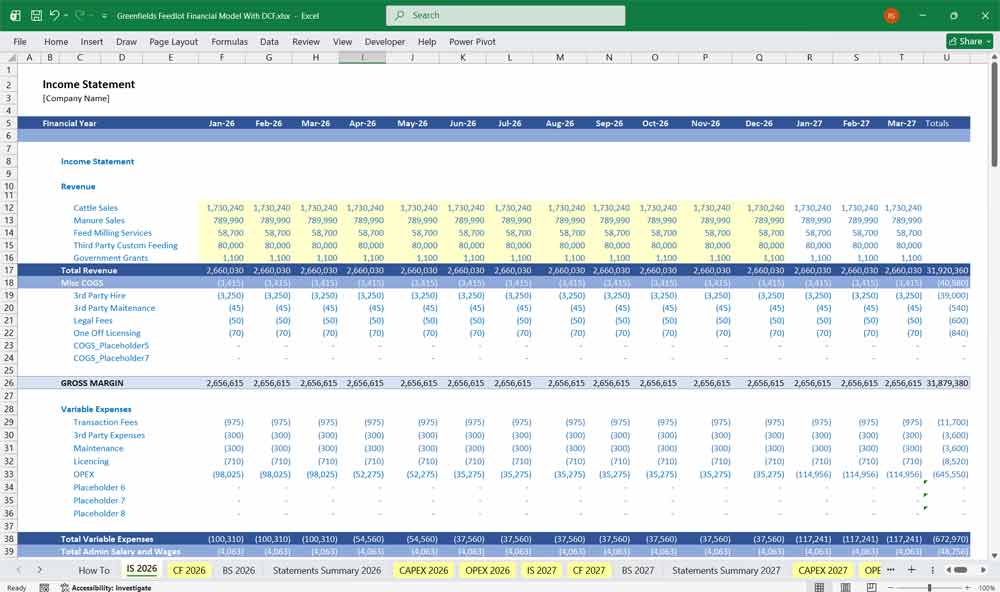
Greenfields Feedlot Cash Flow Statement
The cash flow statement measures actual cash movement.
Many feedlots can report accounting profits while experiencing cash flow stress because of livestock and feed inventory requirements.
The cash flow statement should be divided into three sections.
Operating Activities
Operating cash flow begins with net income.
Non-cash items are added back, including:
- Depreciation
- Amortization
Working-capital changes are then incorporated.
Key working-capital items include:
- Livestock inventory
- Feed inventory
- Accounts receivable
- Accounts payable
An increase in livestock inventory consumes cash.
An increase in feed inventory consumes cash.
An increase in payables generates cash.
The result is net cash provided by operating activities.
Investing Activities
Investing activities include all capital expenditures.
Typical items include:
- Land acquisition
- Livestock area construction
- Feed infrastructure construction
- Water system construction
- Feed mill construction
- Handling facilities construction
- Environmental infrastructure construction
- Equipment purchases
This section is usually heavily negative during construction.
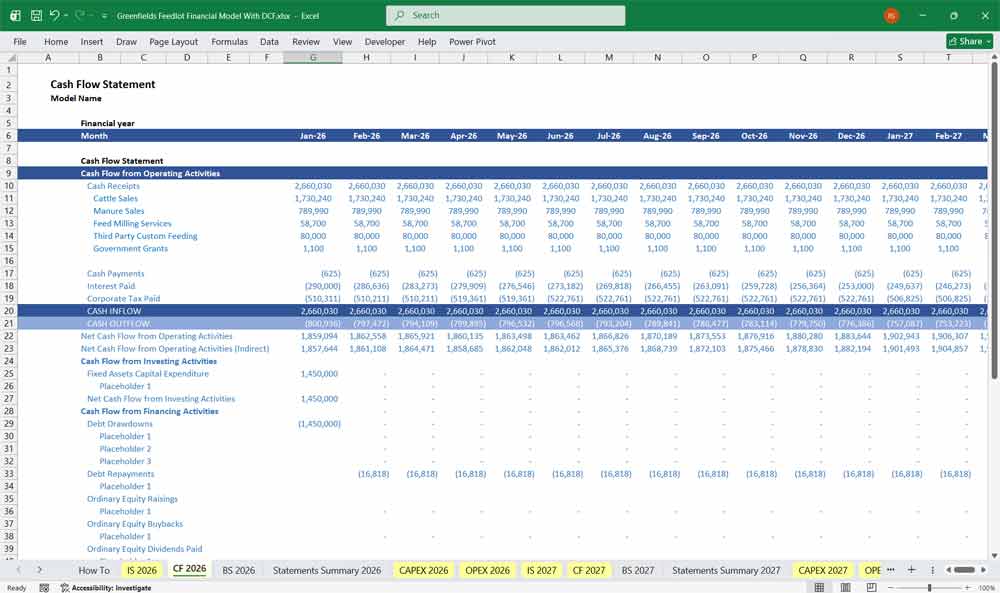
Greenfields Feedlot Balance Sheet
The balance sheet reflects the financial position of the feedlot at any point in time.
Current Assets
Current assets should include:
- Cash
- Accounts receivable
- Feed inventory
- Livestock inventory
- Other operating inventories
Livestock inventory is usually the largest current asset.
Non-Current Assets
Non-current assets should include:
- Land
- Livestock infrastructure
- Feed infrastructure
- Water systems
- Handling facilities
- Feed mill
- Environmental infrastructure
- Vehicles and equipment
Accumulated depreciation is deducted to arrive at net property, plant, and equipment.
Current Liabilities
Current liabilities generally include:
- Accounts payable
- Accrued expenses
- Current debt maturities
These obligations are expected to be settled within twelve months.
Long-Term Liabilities
Long-term liabilities generally include:
- Construction loans
- Term debt
- Equipment financing
Long-term debt is often a major funding source for feedlot projects.
Equity
Equity consists of:
- Paid-in capital
- Retained earnings
Retained earnings accumulate profits generated by operations over time.
Debt Schedule
A dedicated debt schedule should calculate:
- Opening debt balance
- New borrowings
- Principal repayments
- Closing debt balance
- Interest expense
Interest expense links directly into the income statement.
Debt balances link directly into the balance sheet.
Debt service affects the cash flow statement.
Depreciation Schedule
The depreciation schedule should calculate annual depreciation by asset category.
Separate depreciation pools should be maintained for:
- Livestock infrastructure
- Feed infrastructure
- Water systems
- Handling facilities
- Feed mill
- Environmental infrastructure
- Vehicles and equipment
Annual depreciation flows into the income statement while accumulated depreciation flows into the balance sheet.
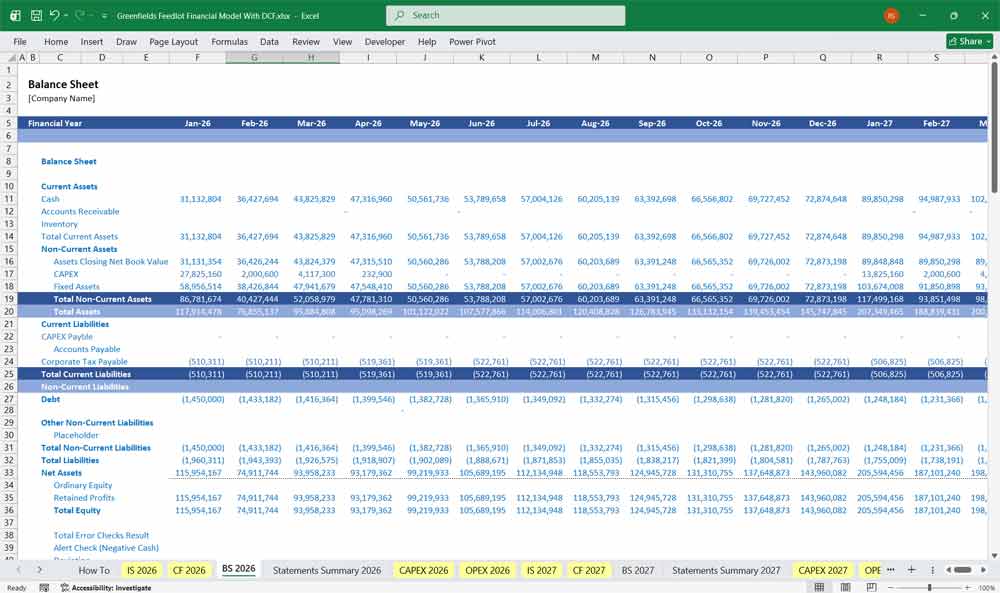
Key Greenfields Feedstock Industry-Specific Considerations
Capital Expenditure (CAPEX) & Asset Construction Schedule
Before operations begin, the model itemizes all construction and procurement costs, phased over a 12–24 month pre-operational period.
Purchase of Feeder Cattle (Initial Herd): This is often classified as a biological asset and a major upfront cash outflow. The model models a “staggered fill” – purchasing 25% of pens in Month 1, 50% in Month 3, and 100% by Month 6. Assumptions include weight at entry (e.g., 350 kg), purchase cost per kg, and death loss (e.g., 1.5%).
Building of Livestock Areas: Costs for earthworks, pen construction (earthen or concrete), fencing, shade structures, and loading ramps. Modeled with a depreciation life of 15–20 years (straight-line).
Feed Infrastructure: Includes commodity storage bins (grain, protein meal), auger systems, mixer wagons, and automated feeding wagons. Depreciated over 10–12 years.
Water Systems: Bores, wells, pumps, storage tanks, troughs, and reticulation piping. Critical in drought-prone regions. Depreciated over 15–20 years.
Handling Facilities: Cattle crush (squeeze chute), scales, vet crush, drafting gates, raceways, and curved forcing pens. Depreciated over 10–15 years.
Feed Mill (on-site): Batch mixer, hammer mill, pellet mill (optional), conveyors, dust control, and control systems. This is the largest mechanical CAPEX, often depreciated over 10–12 years with maintenance CAPEX equal to 5% of original cost annually after Year 5.
Environmental Infrastructure: Runoff ponds (sediment basins), effluent management systems, composting pads, and biosecurity fencing. Often required for regulatory permits. Depreciated over 20 years or treated as a “zero residual” environmental asset.
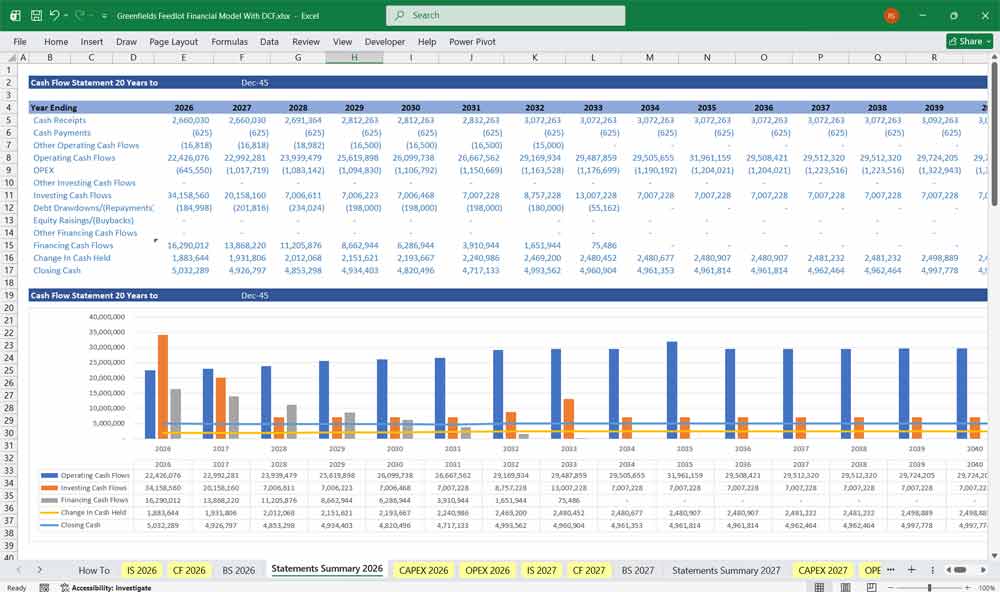
Value Your Greenfields Feedlot With A DCF
Discounted Cash Flow (DCF): Valuing the “Stock” of Infrastructure
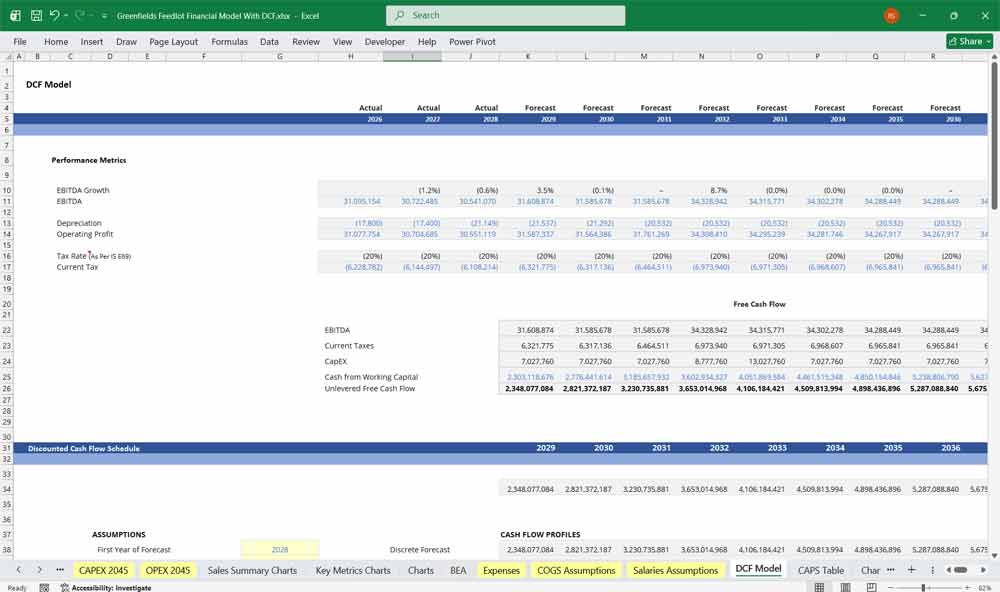
This Discounted Cash Flow analysis for a greenfield feedlot estimates the value of the investment by projecting future free cash flows—derived from feedlot capacity, cattle turnover rates, and prevailing market spreads—and discounting them back to their present value. Because greenfield projects carry significant initial capital expenditure (CAPEX) for land, pen infrastructure, and waste management systems, the DCF model is essential for determining if the long-term operational profitability justifies the substantial upfront investment.
Weighted Average Cost of Capital (WACC): satisfy both creditors and equity investors
WACC represents the minimum return the feedlot must earn on its existing asset base to satisfy both its creditors and equity investors. For a greenfield development, the WACC is often higher than that of an established facility due to the “start-up risk” and the difficulty in securing debt financing for a project with no operational track record. A precise WACC calculation is critical, as it serves as the hurdle rate (discount rate) in the DCF model; if the projected return on the feedlot does not exceed this rate, the project is considered value-destructive.
Sensitivity Analysis: Stress-Testing the feedlot’s financial viability
Sensitivity analysis is used to test how the feedlot’s financial viability responds to fluctuations in key variables, such as feed grain prices, cattle procurement costs, and final sale prices. Given the inherent volatility in agricultural markets, a greenfield operator must model “best-case” and “worst-case” scenarios to understand the break-even points. This analysis helps identify which risks—such as a sudden increase in energy costs or a drop in global beef demand—pose the greatest threat to the project’s net present value, allowing for better-informed strategic planning and risk mitigation.
Final Notes on the Financial Model
This 20 Year Greenfields Feedlot Financial Model Excel Template focuses on balancing capital expenditures with steady revenue growth from your stock sales By optimizing operational costs, and feedlot efficiency, and maximizing high-margin livestock sales, the models ensure sustainable profitability and cash flow stability.
Download Link On Next Page