
Genetics Company Financial Model Excel Template
This 20-Year, 3-Statement Genetics Company Financial Model Excel Template includes revenue streams from Research & Development through to Precision Medicine, cost structures, and financial statements, Discounted Cash Flow (DCF) with Terminal Value, Sensitivity Analysis, and WACC to forecast the financial health of your Genetic (Genomics) Company.
20-Year Financial Model for a Genetics Company
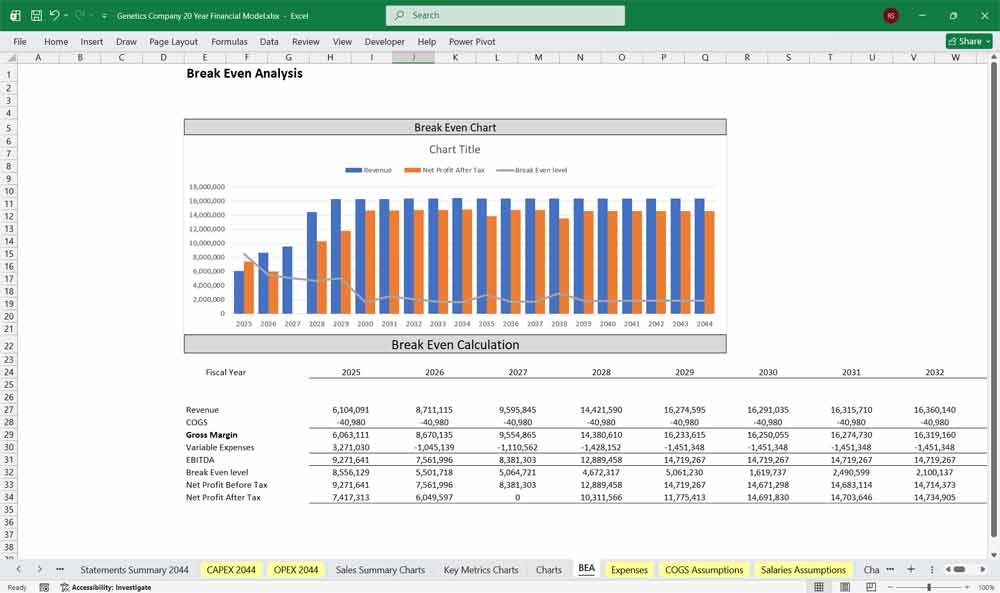
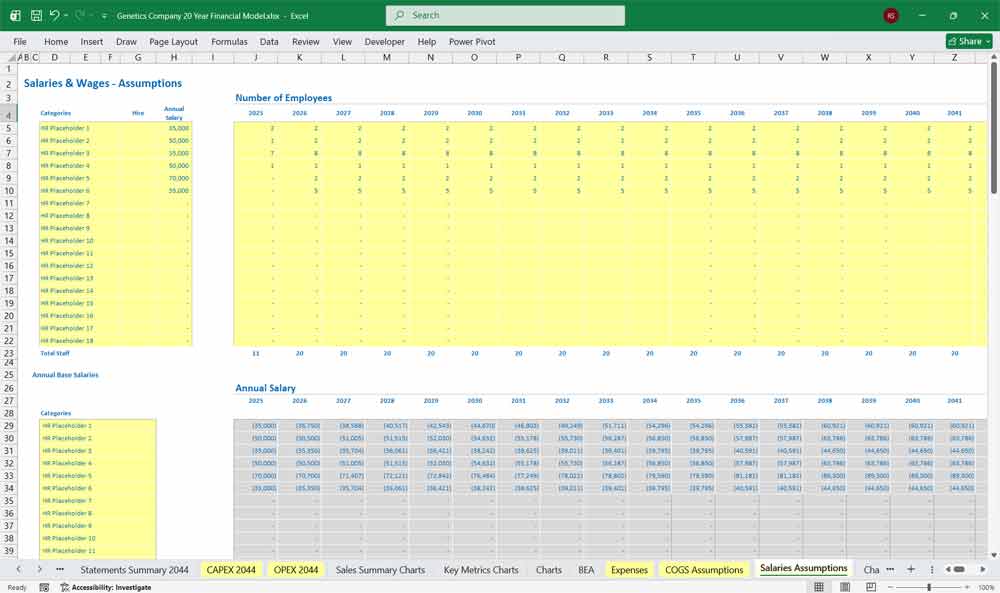
This very extensive 20 Year Genetics (Genomics) Model involves detailed revenue projections, cost structures, capital expenditures, and financing needs. This model provides a thorough understanding of the financial viability, profitability, and cash flow position of your manufacturing company. Includes: 20x Income Statements, Cash Flow Statements, Balance Sheets, CAPEX sheets, OPEX Sheets, Statement Summary Sheets, and Revenue Forecasting Charts with the revenue streams, BEA charts, sales summary charts, employee salary tabs and expenses sheets.
Genetics Company Business Context
The company operates as an integrated genetics and genomics platform, combining biological research, data generation, advanced analytics, and commercial deployment across healthcare, agriculture, and environmental sectors. Its core asset is a growing proprietary genetic database supported by computational infrastructure and scientific expertise.
The financial model reflects:
Multiple revenue streams at different stages of maturity
High upfront R&D and infrastructure costs
Strong operating leverage as data assets scale
A transition from research-driven losses to data-driven profitability
Editable Revenue Model Inputs
Revenues are broken down by application area rather than customer type, enabling clearer unit economics and strategic forecasting.
A. Research & Development Revenue
Nature: Contract-based and grant-supported
Customers: Universities, biotech companies, governments, NGOs
Revenue Sources
Sponsored research agreements
Grant funding (governmental & philanthropic)
Joint development programs with pharma or agribusiness
Milestone-based research payments
Financial Characteristics
Moderate margins (30–50%)
Predictable but project-based
Often cost-reimbursable (reduces downside risk)
Supports core scientific capabilities
Forecast Drivers
Number of active research contracts
Average contract value
Grant success rate
Research staff utilization rate
Data Analysis Revenue
Nature: Fee-for-service and platform-based analytics
Customers: Pharma, biotech, agribusiness, insurers, research institutions
Revenue Sources
Genomic sequencing analysis
Bioinformatics services
AI-driven genetic insights
Subscription access to analytics platforms
Financial Characteristics
Higher margins (60–75%)
Semi-recurring revenue
Scalable with compute optimization
Strong cross-sell potential
Forecast Drivers
Number of clients
Price per analysis
Subscription retention rate
Average data volume per customer
Data Monetization Revenue
Nature: Licensing and royalties
Customers: Pharmaceutical, biotech, AI/ML companies
Revenue Sources
Licensing anonymized genomic datasets
Licensing trained genetic AI models
Royalty streams from drug discovery outcomes
API access to proprietary genetic databases
Financial Characteristics
Very high margins (80–95%)
Low marginal cost
Long-tailed royalty income
Highly sensitive to regulatory constraints
Forecast Drivers
Size and quality of proprietary dataset
Number of licensing partners
Upfront license fees
Royalty rates and downstream drug success
Agriculture Revenue
Nature: Commercial product & licensing
Customers: Seed companies, farmers, agri-biotech firms
Revenue Sources
Genetically optimized crop traits
Livestock genetic testing
Yield optimization services
Licensing of plant and animal IP
Financial Characteristics
Medium-to-high margins (50–70%)
Seasonality driven
Long development cycles
Strong IP protection benefits
Forecast Drivers
Adoption rate of genetic solutions
Acreage or livestock volume covered
Pricing per genetic trait
Regulatory approval timelines
Environmental & Conservation Revenue
Nature: Government and impact-driven contracts
Customers: Governments, NGOs, conservation groups
Revenue Sources
Biodiversity monitoring services
Environmental DNA (eDNA) testing
Climate resilience genetics services
Conservation genetics projects
Financial Characteristics
Lower margins (25–45%)
Grant-heavy and mission-aligned
Enhances brand and data endpoints
Often subsidized
Forecast Drivers
Contract wins
Public funding availability
Number of monitored ecosystems
Testing frequency
Precision Medicine Revenue
Nature: Clinical and diagnostic revenue
Customers: Hospitals, insurers, patients, pharma
Revenue Sources
Genetic diagnostics
Personalized treatment recommendations
Companion diagnostics for pharma
Population genomics programs
Financial Characteristics
High margins (65–85%)
Regulated and compliance-heavy
Recurring testing revenue
Strong long-term growth potential
Forecast Drivers
Number of tests performed
Reimbursement rates
Clinical adoption rate
Regulatory approvals
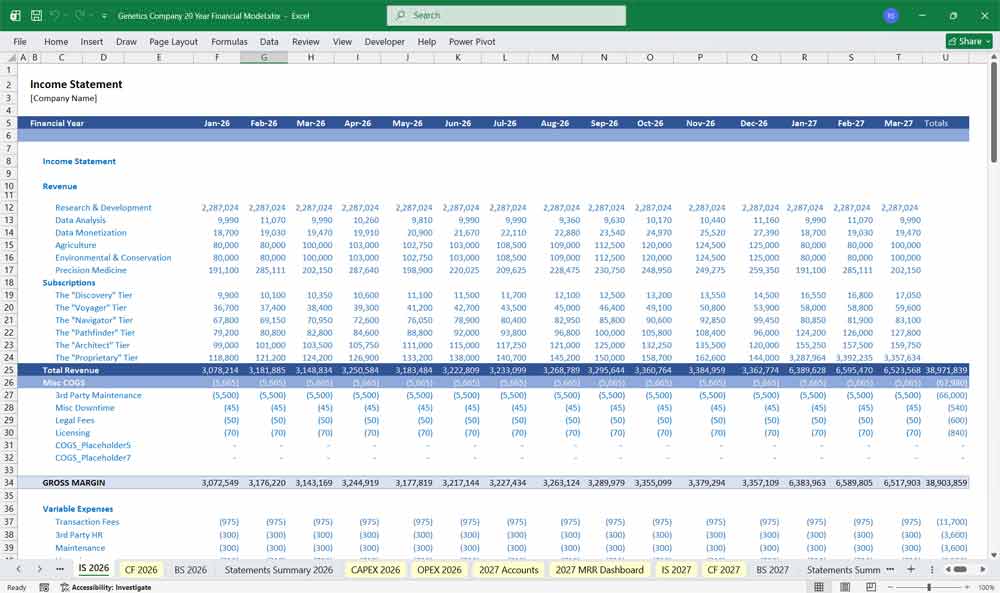
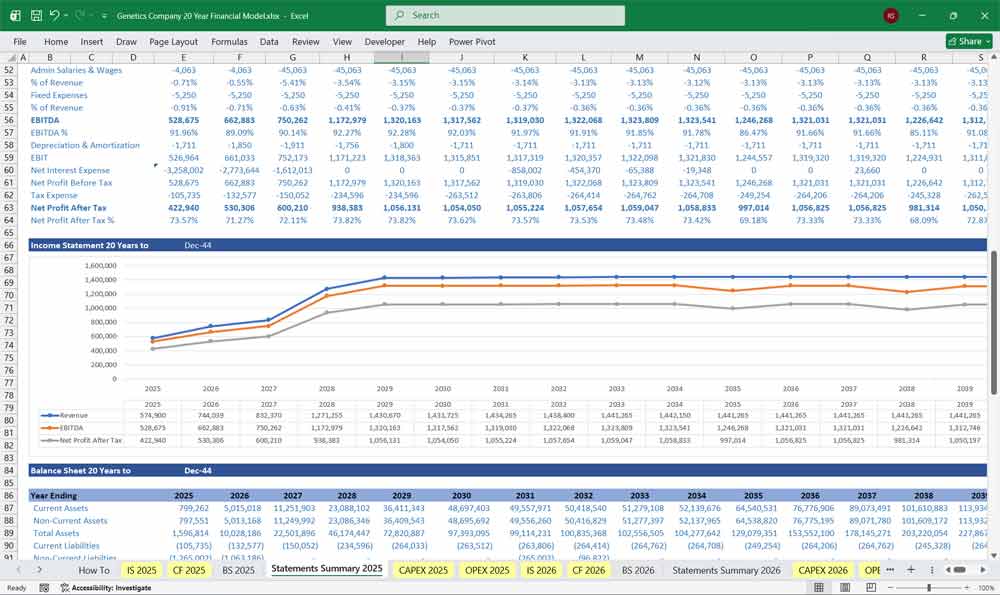
Income Statement Structure
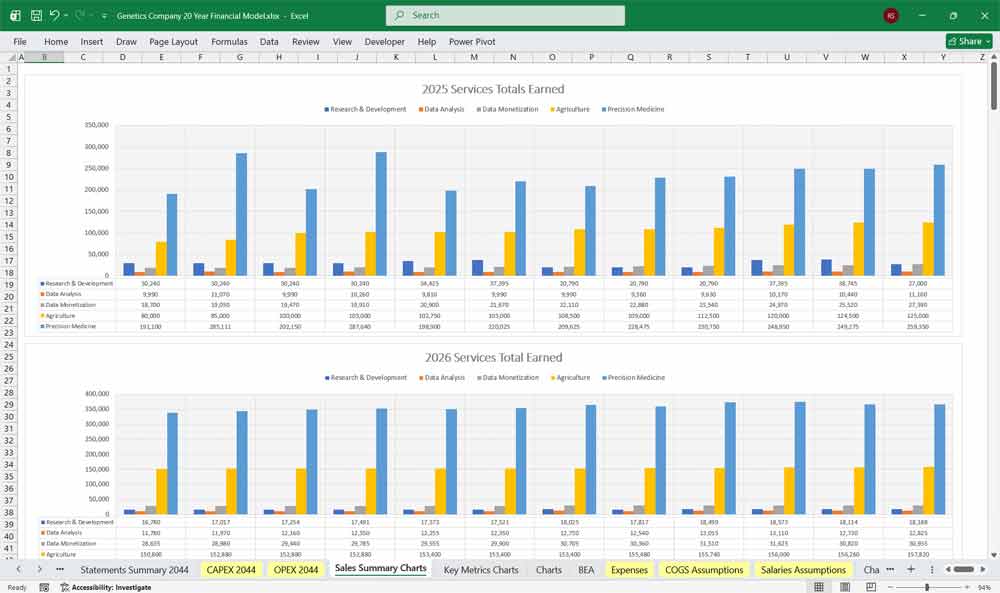
Revenue
Research & Development
Data Analysis
Data Monetization
Agriculture
Environmental & Conservation
Precision Medicine
Total Revenue
Cost of Goods Sold (COGS)
Lab consumables
Sequencing costs
Cloud compute (variable portion)
Data storage tied to customer usage
Clinical testing materials
Gross Margin: Improves over time as data reuse increases.
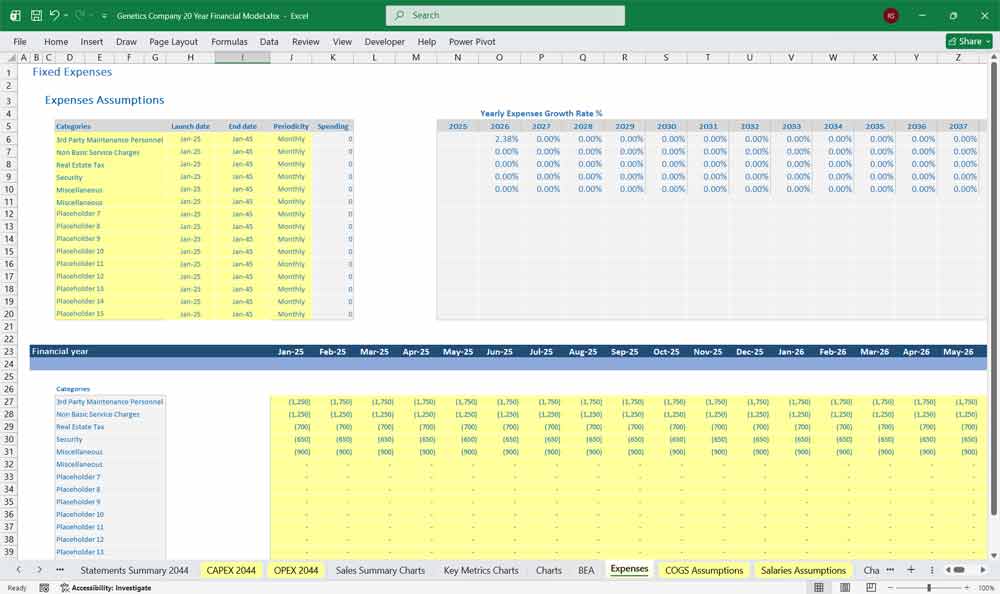
Operating Expenses
Research & Development
Scientists and researchers
Lab operations
Clinical trials
Algorithm development
IP generation
Sales & Marketing
Enterprise sales teams
Partner development
Conferences and industry outreach
Customer success
General & Administrative
Executive leadership
Legal & regulatory compliance
Finance and HR
IT overhead
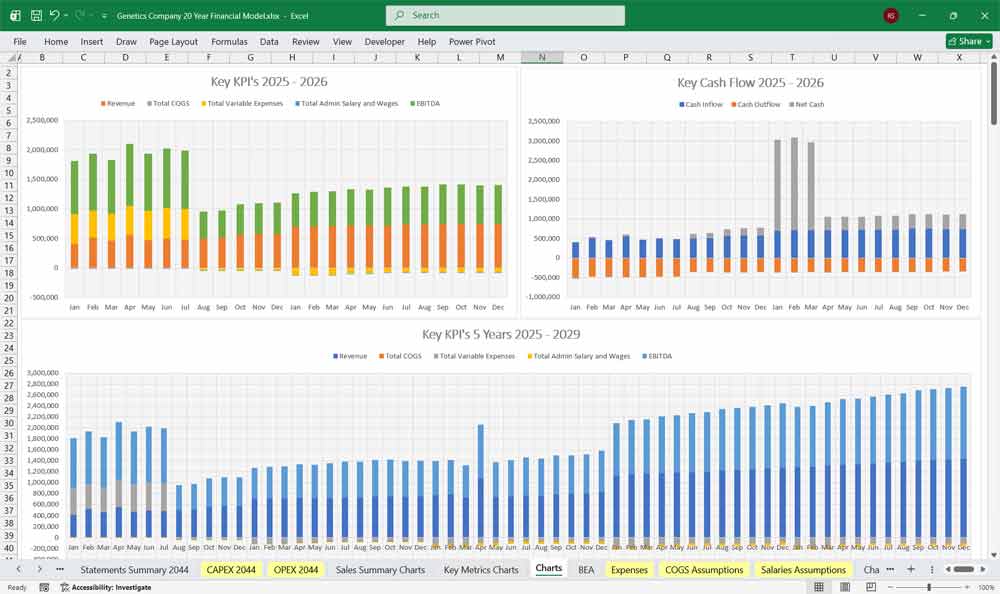
EBITDA
Initially negative due to R&D intensity
Turns positive as data monetization scales
Depreciation & Amortization
Sequencing equipment
Lab infrastructure
Capitalized software
Acquired IP
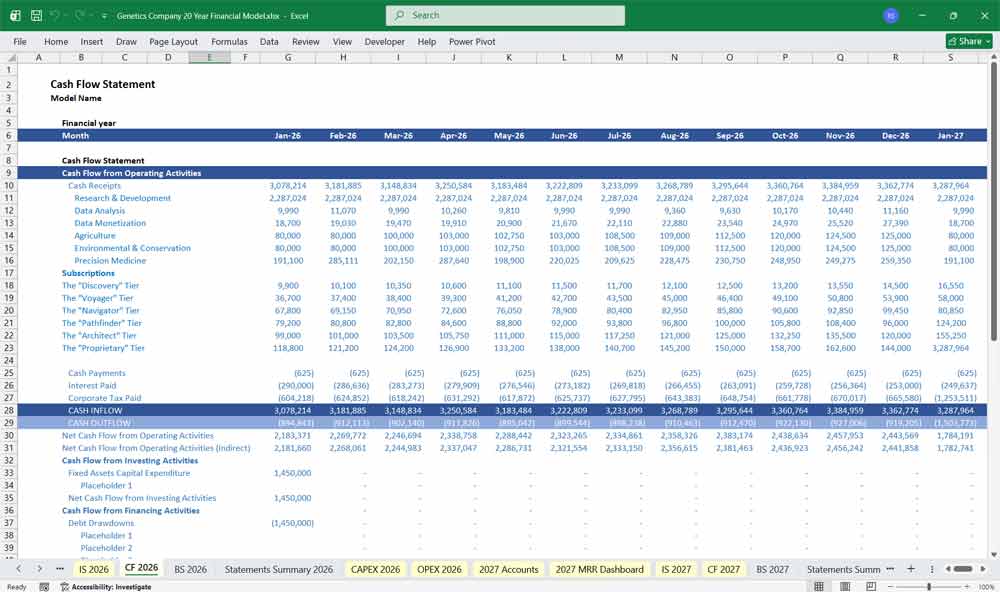
Genetics Company Cash Flow Statement
Operating Cash Flow
Net income
Add back non-cash expenses:
Depreciation & amortization
Stock-based compensation
Changes in working capital:
Accounts receivable
Deferred revenue (subscriptions & licenses)
Accrued research liabilities
Investing Cash Flow
Capital expenditures:
Sequencing machines
Laboratory build-outs
Data center investments
IP acquisitions
Strategic equity investments
Financing Cash Flow
Equity raises
Debt issuance or repayment
Government grants
Licensing advance payments
Share-based compensation tax effects
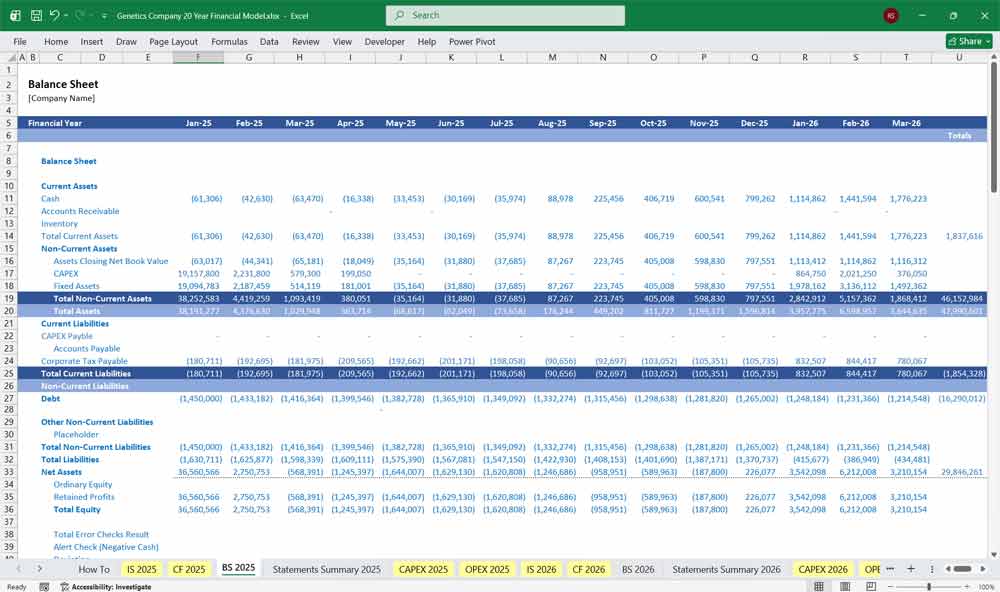
Genetics Company Balance Sheet Structure
Assets
Current Assets
Cash & equivalents
Accounts receivable
Grant receivables
Prepaid lab supplies
Non-Current Assets
Property, plant & equipment
Capitalized software & algorithms
Proprietary datasets (intangible)
Patents and licenses
Long-term investments
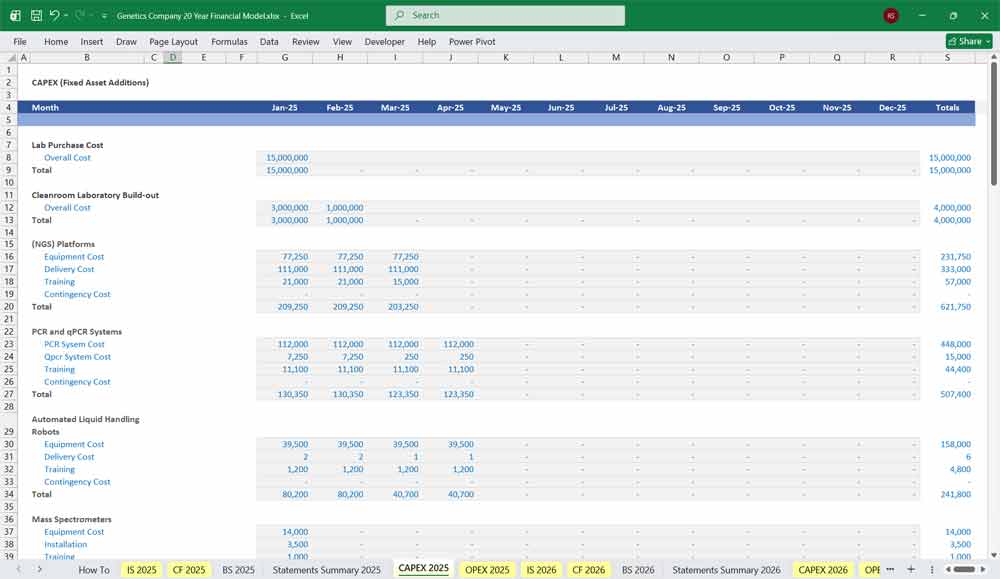
CAPEX (Fixed Asset Additions)
Cleanroom Laboratory Build-out
(NGS) Platforms
PCR and qPCR Systems
Patents and licenses
Biorepository Sample Storage Systems
- (HPC) Clusters
- Laboratory Information Management System (LIMS) Software
Liabilities
Current Liabilities
Accounts payable
Accrued lab and research expenses
Deferred revenue (subscriptions, licenses)
Short-term debt
Long-Term Liabilities
Long-term debt
Lease obligations
Deferred tax liabilities
Equity
Common stock
Additional paid-in capital
Retained earnings (or accumulated deficit)
Stock-based compensation reserves
Key Modeling Assumptions & Metrics For A Genetics (Genomics) Company
Core KPIs
Revenue per genome
Dataset growth rate
Gross margin by segment
R&D efficiency ratio
Cash burn multiple
Licensing revenue as % of total revenue
Strategic Inflection Points
Dataset critical mass
Regulatory approvals
Transition from services → platform
Shift from grant-funded → commercial revenue
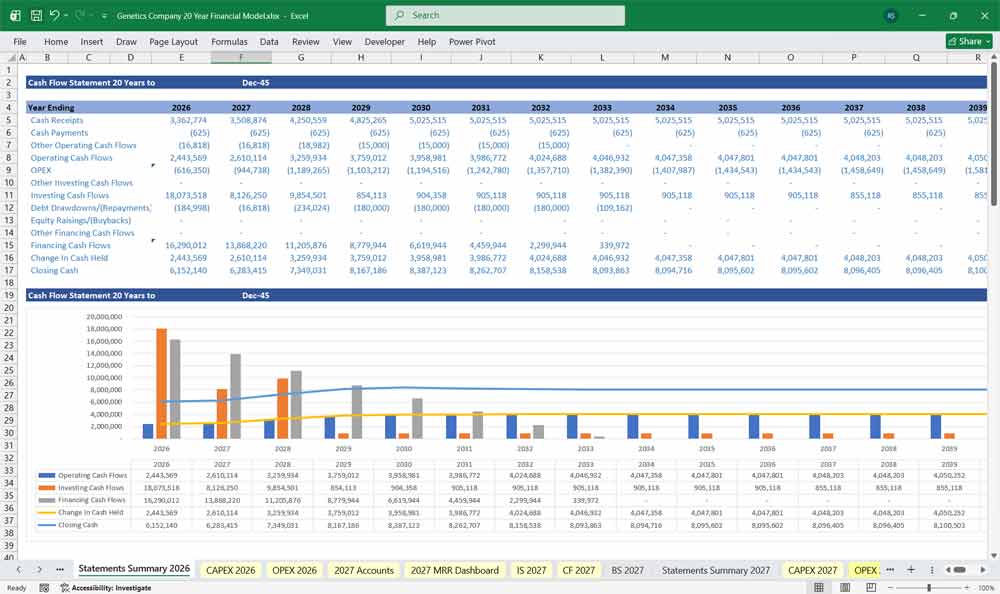
Benefits Of A 20 Year Model For A Genetics (Genomics) Company
A 20-year financial model is especially valuable for a genetics company because the industry’s core value drivers—biological discovery, dataset accumulation, and intellectual property development—unfold over long time horizons. Major investments in research infrastructure, large-scale data generation, and regulatory approvals often take a decade or more to fully mature. A long-term model allows stakeholders to realistically capture the delayed inflection points where early-stage research and analytics investments translate into high-margin licensing, precision medicine applications, and scalable commercial deployment. This perspective prevents underestimating future value that is not visible in short 3–5 year forecasts.
Long Term Strategic Planning For Your Genetics (Genomics) Company
Additionally, a 20-year model enables strategic planning across multiple sectors with different adoption and revenue cycles, such as healthcare, agriculture, and environmental applications. It helps leadership stress-test regulatory changes, technological breakthroughs, and data monetization scenarios while aligning capital allocation with long-term platform growth rather than short-term earnings volatility. By mapping how biological assets and data compound over time, the model supports more informed decisions on partnerships, IP strategy, and sustainable funding—critical for a multidisciplinary genetics company building enduring scientific and commercial impact.
6-tier subscription model for a genomics company
Tier 1: The “Discovery” Tier (Freemium / Entry-Level)
Target Audience: Curious individuals, students, and budget-conscious consumers.
Core Value Proposition: A taste of your genetic story at no cost (or very low cost) to drive mass adoption and data acquisition.
Ancestry & Trait Basics:
Ancestry: Global biogeographical breakdown (e.g., “17% Iberian, 5% Scandinavian”).
Traits: A limited set of fun, non-medical traits (e.g., bitter taste perception, earwax type, caffeine metabolism).
Raw Data Access: Limited or no access to raw data.
Reports: 5-10 static, pre-vetted reports updated annually.
Data Contribution: User agrees to have their de-identified data used for company research and aggregated studies.
Community Features: Read-only access to public forums.
Psychological Hook: This tier is designed to be a low-friction entry point. It leverages the user’s curiosity about themselves (“Where am I really from?”) to get them in the door. By providing immediate, easy-to-understand value, it builds trust and primes them for an upgrade.
Tier 2: The “Voyager” Tier (Essential Health & Wellness)
Target Audience: Health-conscious individuals, biohackers, and fitness enthusiasts.
Core Value Proposition: Actionable insights for optimizing daily life, diet, and fitness based on your DNA.
Everything in Tier 1, plus:
Enhanced Wellness Reports:
Diet & Nutrition: Response to macronutrients (e.g., predisposition to higher carb sensitivity), lactose intolerance, gluten sensitivity (non-celiac).
Fitness: Muscle composition (power vs. endurance), recovery rate, injury risk (e.g., Achilles tendinopathy), optimal exercise response.
Sleep & Stress: Chronotype (morning lark vs. night owl), stress resilience, and sleep quality indicators.
Seasonal Updates: 4-5 new wellness reports added per year.
Raw Data Access: Full access to download your uninterpreted genetic raw data.
Partner Discounts: Exclusive offers from third-party wellness brands (e.g., personalized vitamins, fitness apparel).
Community Engagement: Ability to comment and participate in topic-specific forums.
Psychological Hook: This tier moves from “who am I?” to “how do I work best?” It appeals to the growing market of people seeking personalization in health and fitness. The promise is efficiency: “Stop guessing what diet works; your DNA knows.”
Tier 3: The “Navigator” Tier (Comprehensive Health & Longevity)
Target Audience: Individuals with a proactive approach to long-term health, those with a family history of specific conditions, and planning for family.
Core Value Proposition: A deeper dive into your genetic health risks and carrier status to empower proactive healthcare decisions and family planning.
Everything in Tier 2, plus:
Carrier Status Reports: Screening for recessive genetic conditions (e.g., Cystic Fibrosis, Sickle Cell Anemia, Tay-Sachs) to inform family planning decisions.
Genetic Health Risks: Reports on predispositions for complex conditions (e.g., Celiac disease, Late-onset Alzheimer’s, Parkinson’s, certain hereditary cancers like BRCA-related, though with strong disclaimers).
Note: Requires clear communication that these are risk factors, not diagnoses.
Pharmacogenomics (PGx): Basic reports on how you might metabolize common medications (e.g., certain SSRIs, blood thinners like Warfarin, statins). Empowers more informed conversations with doctors.
Longevity Insights: Polygenic risk scores for healthy aging, focusing on areas like cognitive decline and cardiovascular health.
Quarterly Deep-Dive Webinars: Access to live and recorded webinars with the company’s genetic counselors or scientific advisors on featured topics.
Psychological Hook: This tier is driven by fear and responsibility—the desire to control what you can and prepare for what you can’t. It appeals to the “worried well” and those with a genuine family history of disease, offering them a roadmap for navigating their future health.
Tier 4: The “Pathfinder” Tier (Clinical & Integrative Health)
Target Audience: Individuals working with healthcare practitioners (functional medicine doctors, nutritionists) and serious about clinical-grade insights.
Core Value Proposition: High-resolution, clinically-focused data and tools designed for integration with professional healthcare guidance.
Everything in Tier 3, plus:
High-Resolution Genotyping: Access to data from a more advanced genotyping chip (or an option to upgrade their sample) covering millions more markers, including rare variants.
Advanced Pharmacogenomics: Comprehensive PGx panel covering hundreds of medications across all major categories (psychiatry, cardiology, pain management, etc.).
Methylation & Detox Pathways: Deep-dive analysis into genes like MTHFR, COMT, and GST, crucial for understanding detoxification, methylation, and neurotransmitter function.
Integration Tools: Direct integration capabilities with major electronic health records (EHRs) and clinical health apps (e.g., Apple Health, Fitbit) for a unified health view.
Direct-to-Consultant Portal: A feature allowing users to securely share their full genomic report with any licensed practitioner they choose.
Priority Support: Access to a dedicated customer support team for technical or data questions.
Psychological Hook: This tier appeals to the user who is no longer satisfied with just information; they want it to be actionable within the healthcare system. The promise is integration and depth, turning a direct-to-consumer product into a clinical tool under their control.
Tier 5: The “Architect” Tier (Research-Grade & Family Plan)
Target Audience: Research institutions, biotech startups, citizen scientists, and multi-generational families.
Core Value Proposition: Unparalleled data depth and tools for discovery, designed for collaborative research and family-wide genetic exploration.
Everything in Tier 4, for up to 4 family members (e.g., a couple and their two children).
Whole Exome Sequencing (WES) Data: Instead of genotyping, this tier provides actual Whole Exome Sequencing data (the protein-coding parts of your genes), offering a far more detailed view for research and rare variant discovery.
Family Inheritance Viewing: A proprietary tool that visually maps how genetic variants are passed down through family members (e.g., “You inherited this variant from your mother, and passed it to your son”).
Research Collaboration Tools: Access to a portal for contributing to and viewing preliminary findings from the company’s ongoing research studies.
API Access: For citizen scientists and researchers, an API key to run their own custom algorithms and queries against their own data.
Annual Research Review: A comprehensive PDF report summarizing the latest scientific discoveries relevant to their genome, compiled by the company’s science team.
Psychological Hook: This tier moves the user from passive consumer to active participant. For families, it’s about creating a shared health legacy. For researchers/citizen scientists, it’s about the raw power of discovery and the tools to explore the genome without limits.
Tier 6: The “Proprietary” Tier (Enterprise & Pharma)
Target Audience: Large pharmaceutical companies, AI-driven biotech firms, and major research hospitals.
Core Value Proposition: A secure, high-quality data licensing and research partnership model.
Everything in Tier 5, but this tier is not a user-facing subscription.
Bulk Data Licensing: Secure, anonymized access to the company’s vast and growing genomic database (with explicit user consent) for drug discovery, target identification, and AI model training.
Custom Cohort Identification: The company’s bioinformatics team works with the enterprise partner to identify and recruit specific genetic cohorts for clinical trials (e.g., “Find 500 users in our database with this specific BRCA mutation who are willing to be contacted about a new preventative therapy”).
White-Glove Research Services: Dedicated project managers and bioinformaticians to design and execute custom research studies using the database.
Corporate Wellness Integration: For large corporations, offering the lower tiers as a premium benefit to their employees, with aggregated, anonymized health insights reported back to the employer (e.g., “Our workforce has a high prevalence of Vitamin D deficiency SNPs, suggesting we should offer supplements”).
Priority IRB Review & Compliance: Full support for Institutional Review Board (IRB) processes to ensure all research is ethical and compliant.
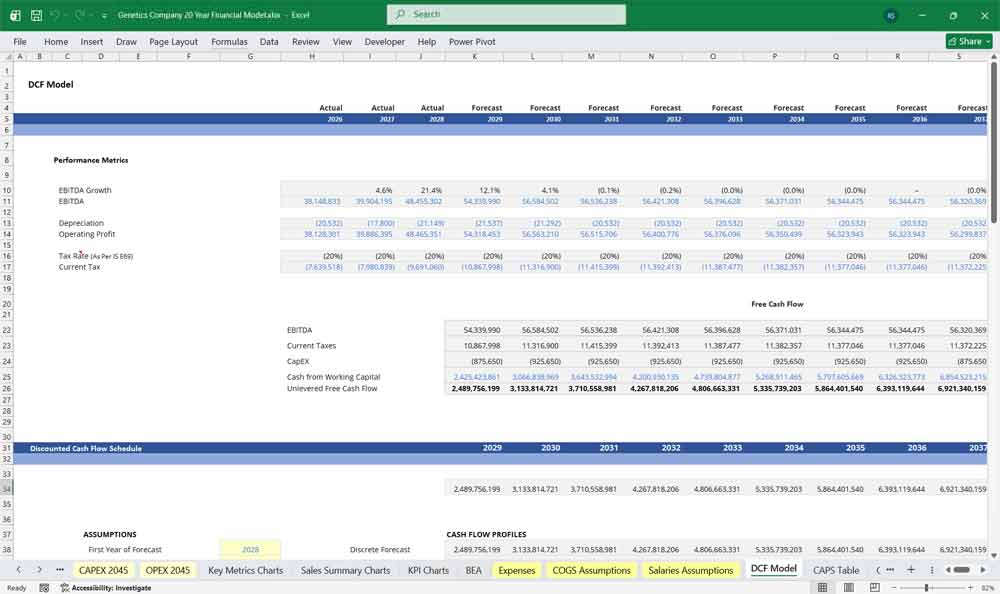
Valuing Your Genetics Company With A DCF
Discounted Cash Flow: Valuing the “Library of Life”
A Discounted Cash Flow (DCF) analysis for a genetics company estimates the firm’s value based on projected future cash flows generated from genetic testing services, diagnostics, research partnerships, and potential therapeutics or licensing revenues. Revenue forecasts depend on product development timelines, regulatory approvals, reimbursement coverage, market adoption, and intellectual property strength, while costs include research and development, laboratory operations, clinical trials, regulatory compliance, and commercialization efforts. The projected free cash flows over an extended forecast period—often reflecting long development cycles—along with a terminal value, are discounted to present value to determine the company’s intrinsic value.
WACC: Pricing Ethical Risk and Data Moats
Weighted Average Cost of Capital (WACC) is used as the discount rate in valuing a genetics company and reflects the blended cost of equity and debt financing. Given scientific uncertainty, regulatory risk, long commercialization timelines, and reliance on intellectual property, investors typically demand higher returns, which can increase the cost of equity. The WACC incorporates these risk considerations, the company’s capital structure, and any tax benefits of debt, representing the minimum return required to justify investment in the business.
Sensitivity Analysis: Stress-Testing the “Hit Rate” and Sequencing Costs
Sensitivity analysis is particularly critical in valuing a genetics company due to uncertainties in clinical success rates, regulatory outcomes, pricing, reimbursement levels, and market penetration. Analysts commonly test variations in key assumptions such as probability of technical success, revenue ramp-up timing, gross margins, R&D intensity, funding requirements, and WACC. By examining how changes in these inputs affect the DCF valuation, sensitivity analysis identifies the most influential value drivers and provides a range of potential outcomes to support strategic planning and investment decisions.
Final Notes on the Financial Model
This 20 Year Genetics Company Financial Model captures the hybrid nature of a genetics company—part research institution, part data company, and part IP-driven commercial enterprise. Early-stage losses are driven by intentional investment in data and science, while long-term value emerges through scalable data monetization, precision medicine, and licensed genetic intellectual property.
Download Link On Next Page
Download Link On Next Page