
Genetics Company Financial Model
20-Year Financial Model for a Genetics Company
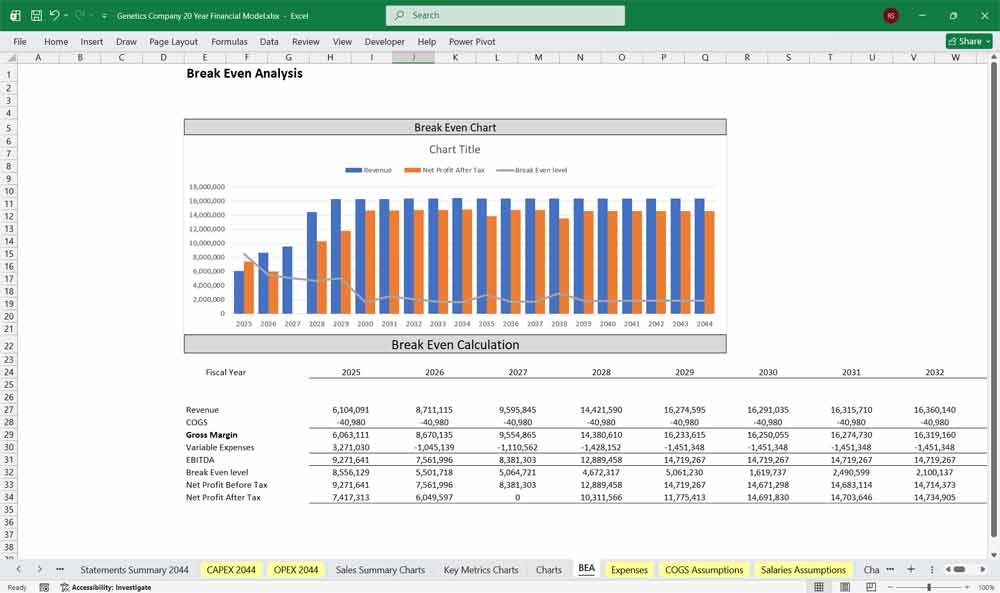
This very extensive 20 Year Genetics (Genomics) Model involves detailed revenue projections, cost structures, capital expenditures, and financing needs. This model provides a thorough understanding of the financial viability, profitability, and cash flow position of your manufacturing company. Includes: 20x Income Statements, Cash Flow Statements, Balance Sheets, CAPEX sheets, OPEX Sheets, Statement Summary Sheets, and Revenue Forecasting Charts with the revenue streams, BEA charts, sales summary charts, employee salary tabs and expenses sheets.
Genetics Company Business Context
The company operates as an integrated genetics and genomics platform, combining biological research, data generation, advanced analytics, and commercial deployment across healthcare, agriculture, and environmental sectors. Its core asset is a growing proprietary genetic database supported by computational infrastructure and scientific expertise.
The financial model reflects:
Multiple revenue streams at different stages of maturity
High upfront R&D and infrastructure costs
Strong operating leverage as data assets scale
A transition from research-driven losses to data-driven profitability
Editable Revenue Model Inputs
Revenues are broken down by application area rather than customer type, enabling clearer unit economics and strategic forecasting.
A. Research & Development Revenue
Nature: Contract-based and grant-supported
Customers: Universities, biotech companies, governments, NGOs
Revenue Sources
Sponsored research agreements
Grant funding (governmental & philanthropic)
Joint development programs with pharma or agribusiness
Milestone-based research payments
Financial Characteristics
Moderate margins (30–50%)
Predictable but project-based
Often cost-reimbursable (reduces downside risk)
Supports core scientific capabilities
Forecast Drivers
Number of active research contracts
Average contract value
Grant success rate
Research staff utilization rate
Data Analysis Revenue
Nature: Fee-for-service and platform-based analytics
Customers: Pharma, biotech, agribusiness, insurers, research institutions
Revenue Sources
Genomic sequencing analysis
Bioinformatics services
AI-driven genetic insights
Subscription access to analytics platforms
Financial Characteristics
Higher margins (60–75%)
Semi-recurring revenue
Scalable with compute optimization
Strong cross-sell potential
Forecast Drivers
Number of clients
Price per analysis
Subscription retention rate
Average data volume per customer
Data Monetization Revenue
Nature: Licensing and royalties
Customers: Pharmaceutical, biotech, AI/ML companies
Revenue Sources
Licensing anonymized genomic datasets
Licensing trained genetic AI models
Royalty streams from drug discovery outcomes
API access to proprietary genetic databases
Financial Characteristics
Very high margins (80–95%)
Low marginal cost
Long-tailed royalty income
Highly sensitive to regulatory constraints
Forecast Drivers
Size and quality of proprietary dataset
Number of licensing partners
Upfront license fees
Royalty rates and downstream drug success
Agriculture Revenue
Nature: Commercial product & licensing
Customers: Seed companies, farmers, agri-biotech firms
Revenue Sources
Genetically optimized crop traits
Livestock genetic testing
Yield optimization services
Licensing of plant and animal IP
Financial Characteristics
Medium-to-high margins (50–70%)
Seasonality driven
Long development cycles
Strong IP protection benefits
Forecast Drivers
Adoption rate of genetic solutions
Acreage or livestock volume covered
Pricing per genetic trait
Regulatory approval timelines
Environmental & Conservation Revenue
Nature: Government and impact-driven contracts
Customers: Governments, NGOs, conservation groups
Revenue Sources
Biodiversity monitoring services
Environmental DNA (eDNA) testing
Climate resilience genetics services
Conservation genetics projects
Financial Characteristics
Lower margins (25–45%)
Grant-heavy and mission-aligned
Enhances brand and data endpoints
Often subsidized
Forecast Drivers
Contract wins
Public funding availability
Number of monitored ecosystems
Testing frequency
Precision Medicine Revenue
Nature: Clinical and diagnostic revenue
Customers: Hospitals, insurers, patients, pharma
Revenue Sources
Genetic diagnostics
Personalized treatment recommendations
Companion diagnostics for pharma
Population genomics programs
Financial Characteristics
High margins (65–85%)
Regulated and compliance-heavy
Recurring testing revenue
Strong long-term growth potential
Forecast Drivers
Number of tests performed
Reimbursement rates
Clinical adoption rate
Regulatory approvals
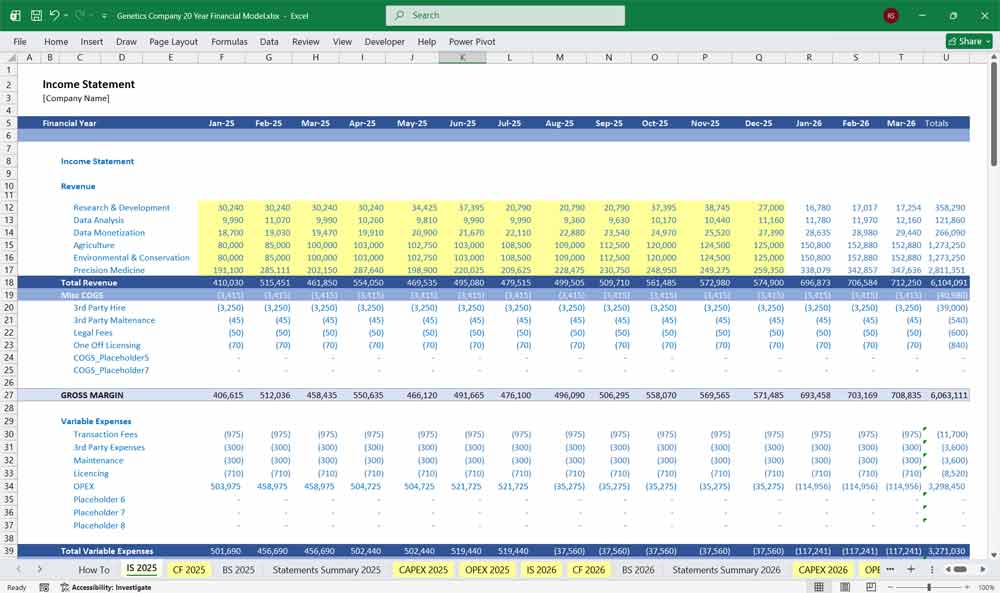
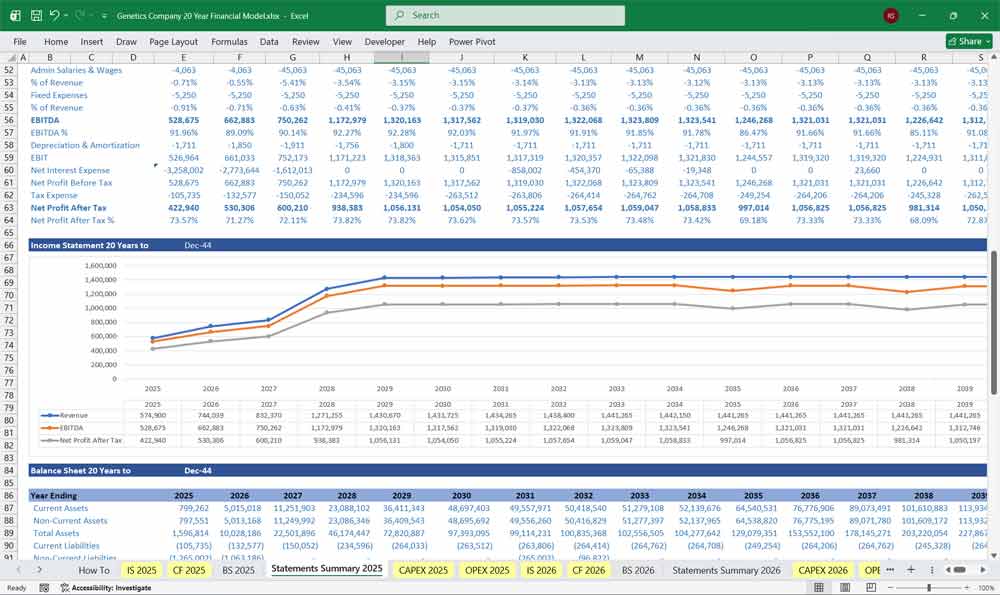
Income Statement Structure
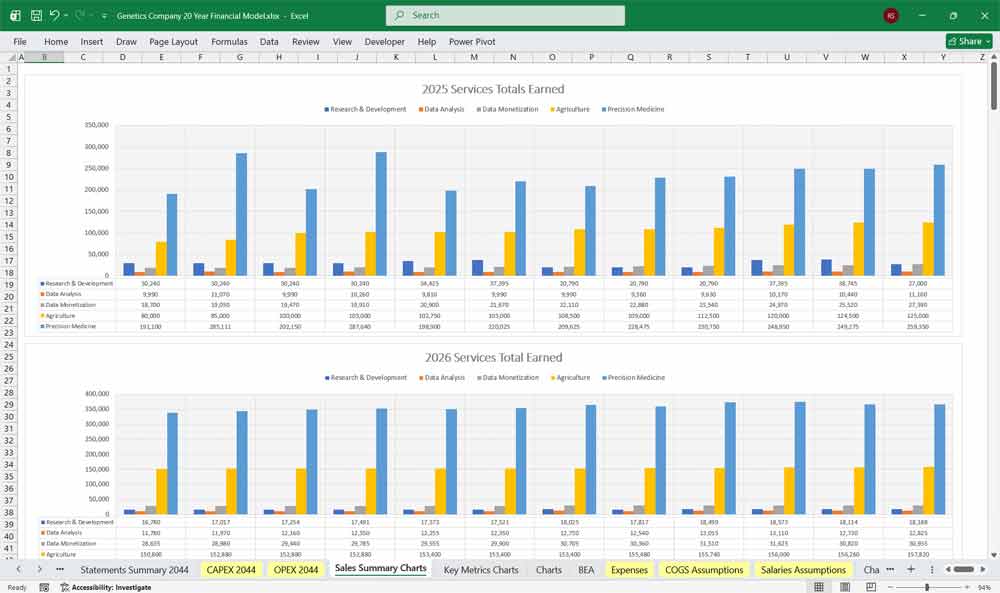
Revenue
Research & Development
Data Analysis
Data Monetization
Agriculture
Environmental & Conservation
Precision Medicine
Total Revenue
Cost of Goods Sold (COGS)
Lab consumables
Sequencing costs
Cloud compute (variable portion)
Data storage tied to customer usage
Clinical testing materials
Gross Margin: Improves over time as data reuse increases.
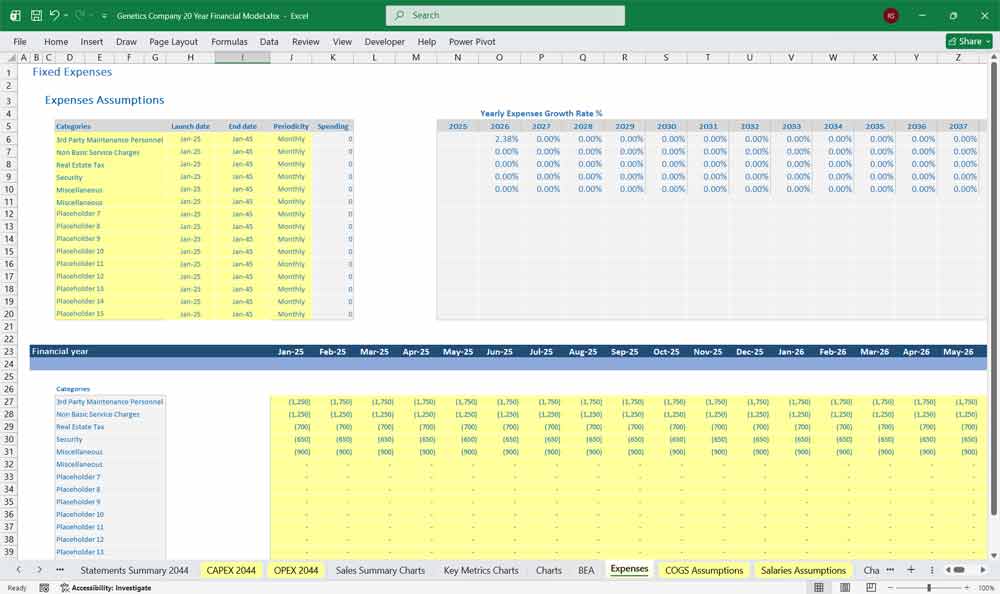
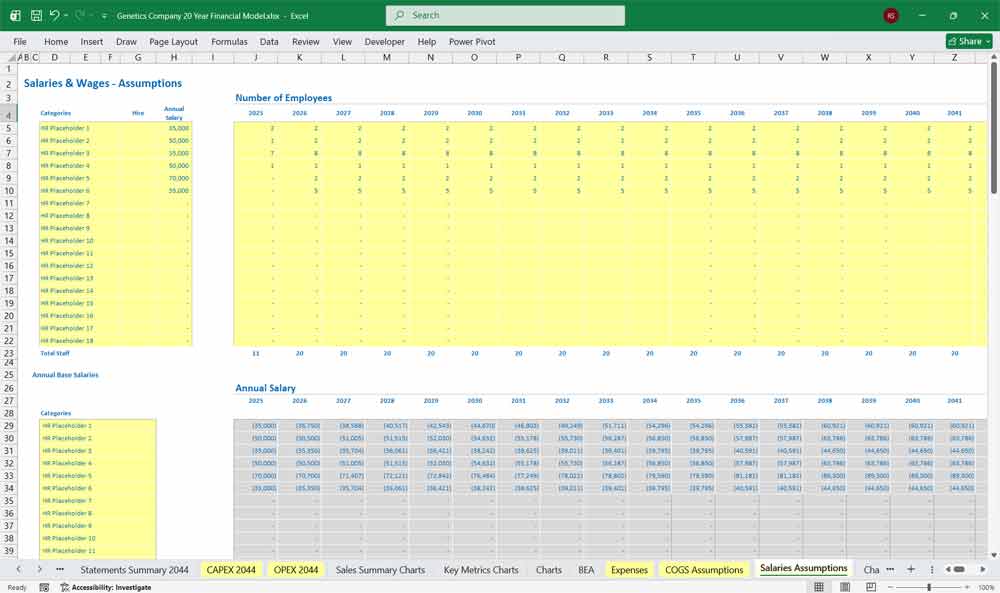
Operating Expenses
Research & Development
Scientists and researchers
Lab operations
Clinical trials
Algorithm development
IP generation
Sales & Marketing
Enterprise sales teams
Partner development
Conferences and industry outreach
Customer success
General & Administrative
Executive leadership
Legal & regulatory compliance
Finance and HR
IT overhead
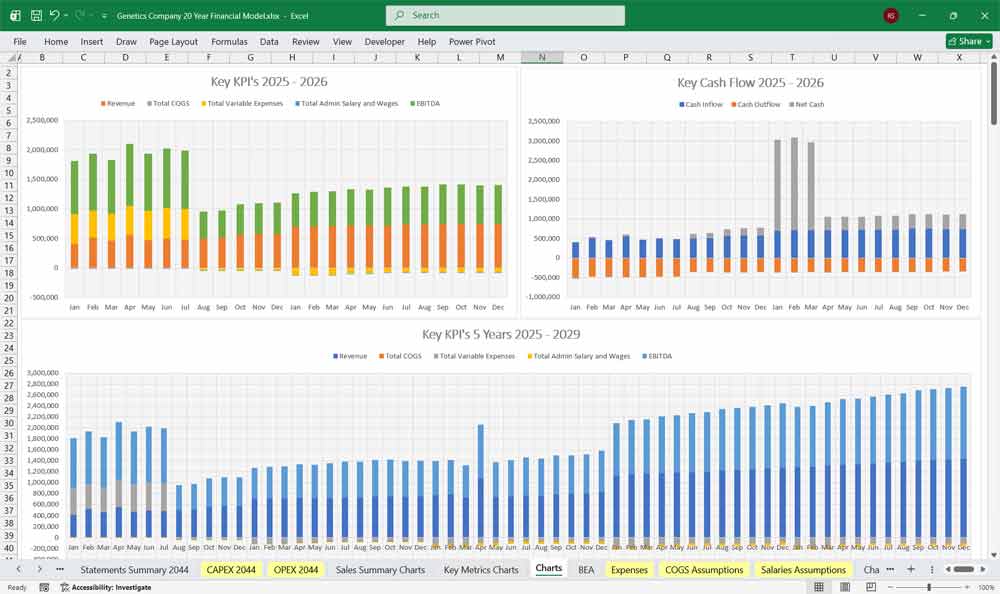
EBITDA
Initially negative due to R&D intensity
Turns positive as data monetization scales
Depreciation & Amortization
Sequencing equipment
Lab infrastructure
Capitalized software
Acquired IP
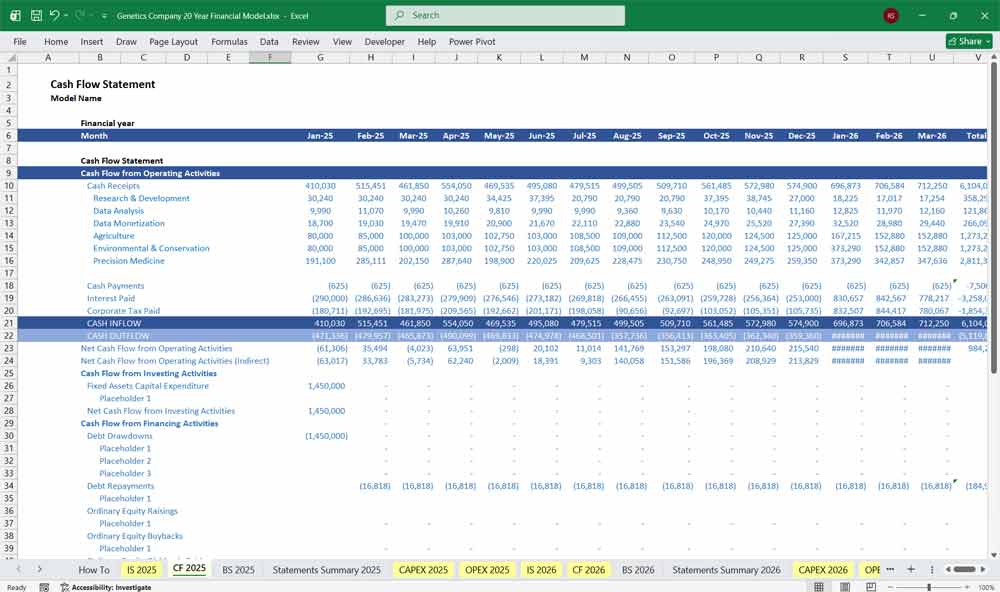
Genetics Company Cash Flow Statement
Operating Cash Flow
Net income
Add back non-cash expenses:
Depreciation & amortization
Stock-based compensation
Changes in working capital:
Accounts receivable
Deferred revenue (subscriptions & licenses)
Accrued research liabilities
Investing Cash Flow
Capital expenditures:
Sequencing machines
Laboratory build-outs
Data center investments
IP acquisitions
Strategic equity investments
Financing Cash Flow
Equity raises
Debt issuance or repayment
Government grants
Licensing advance payments
Share-based compensation tax effects
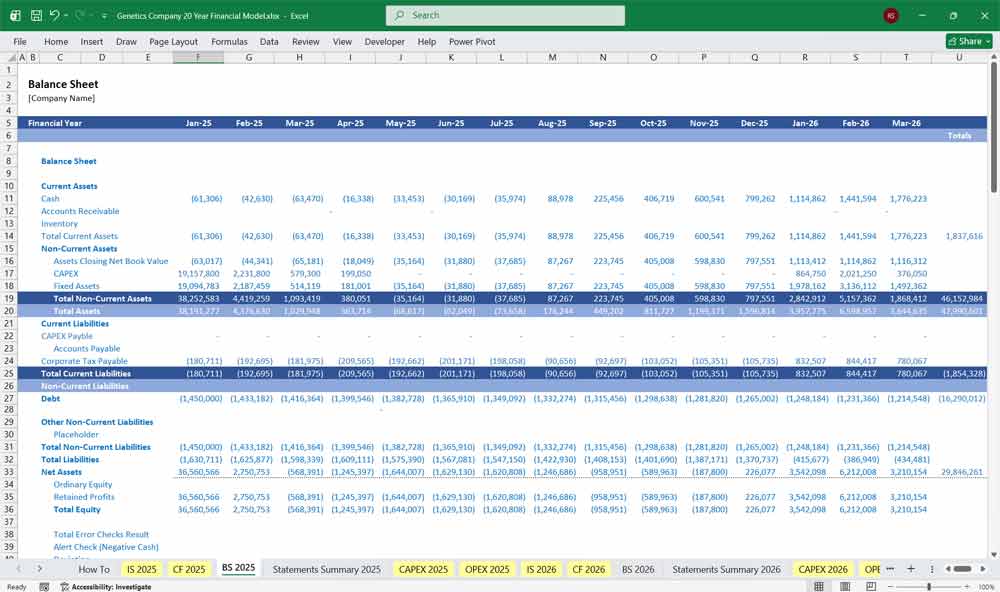
Genetics Company Balance Sheet Structure
Assets
Current Assets
Cash & equivalents
Accounts receivable
Grant receivables
Prepaid lab supplies
Non-Current Assets
Property, plant & equipment
Capitalized software & algorithms
Proprietary datasets (intangible)
Patents and licenses
Long-term investments
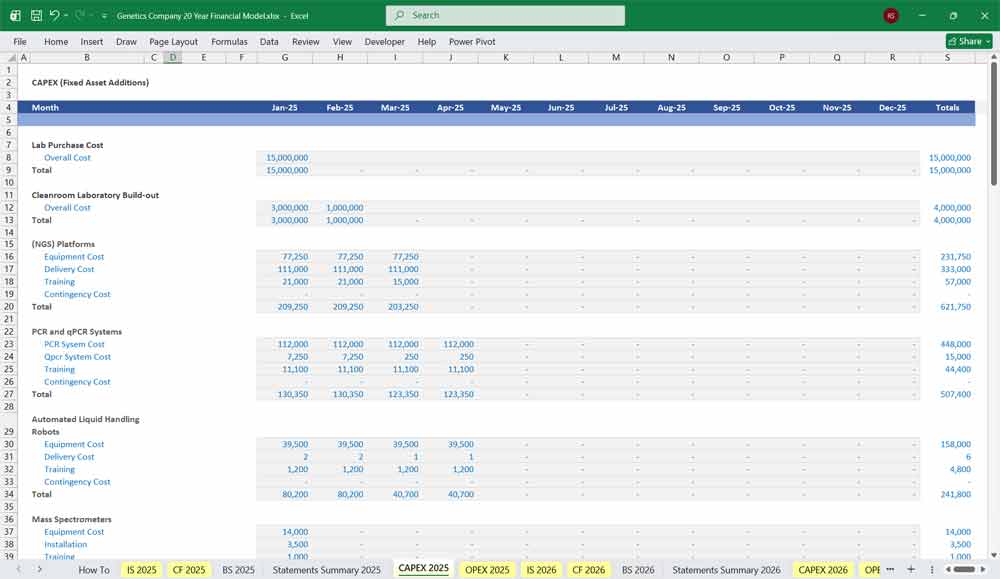
CAPEX (Fixed Asset Additions)
Cleanroom Laboratory Build-out
(NGS) Platforms
PCR and qPCR Systems
Patents and licenses
Biorepository Sample Storage Systems
- (HPC) Clusters
- Laboratory Information Management System (LIMS) Software
Liabilities
Current Liabilities
Accounts payable
Accrued lab and research expenses
Deferred revenue (subscriptions, licenses)
Short-term debt
Long-Term Liabilities
Long-term debt
Lease obligations
Deferred tax liabilities
Equity
Common stock
Additional paid-in capital
Retained earnings (or accumulated deficit)
Stock-based compensation reserves
Key Modeling Assumptions & Metrics For A Genetics (Genomics) Company
Core KPIs
Revenue per genome
Dataset growth rate
Gross margin by segment
R&D efficiency ratio
Cash burn multiple
Licensing revenue as % of total revenue
Strategic Inflection Points
Dataset critical mass
Regulatory approvals
Transition from services → platform
Shift from grant-funded → commercial revenue
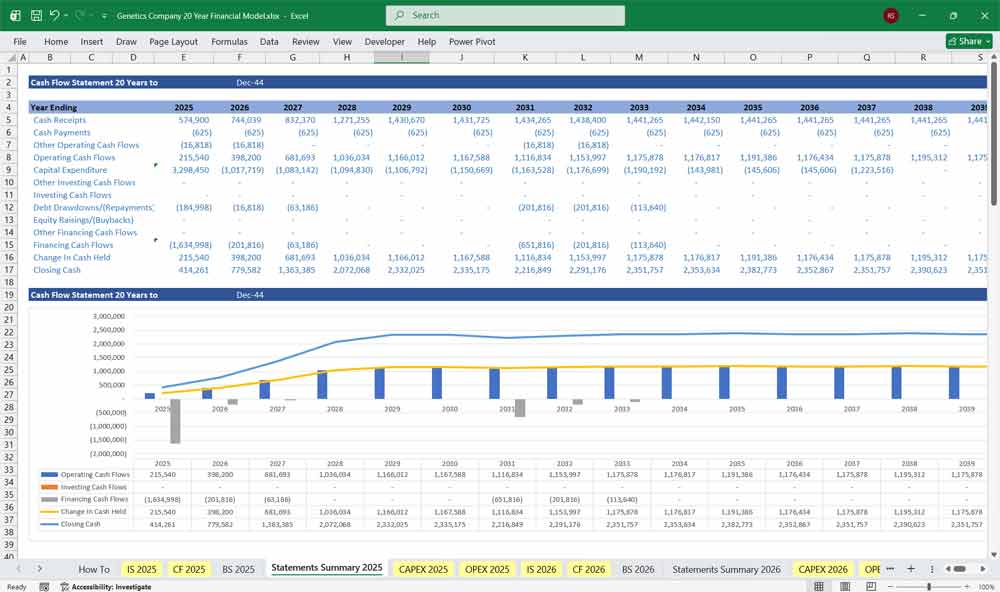
Benefits Of A 20 Year Model For A Genetics (Genomics) Company
A 20-year financial model is especially valuable for a genetics company because the industry’s core value drivers—biological discovery, dataset accumulation, and intellectual property development—unfold over long time horizons. Major investments in research infrastructure, large-scale data generation, and regulatory approvals often take a decade or more to fully mature. A long-term model allows stakeholders to realistically capture the delayed inflection points where early-stage research and analytics investments translate into high-margin licensing, precision medicine applications, and scalable commercial deployment. This perspective prevents underestimating future value that is not visible in short 3–5 year forecasts.
Long Term Strategic Planning For Your Genetics (Genomics) Company
Additionally, a 20-year model enables strategic planning across multiple sectors with different adoption and revenue cycles, such as healthcare, agriculture, and environmental applications. It helps leadership stress-test regulatory changes, technological breakthroughs, and data monetization scenarios while aligning capital allocation with long-term platform growth rather than short-term earnings volatility. By mapping how biological assets and data compound over time, the model supports more informed decisions on partnerships, IP strategy, and sustainable funding—critical for a multidisciplinary genetics company building enduring scientific and commercial impact.
Final Notes on the Financial Model
This 20 Year Genetics Company Financial Model captures the hybrid nature of a genetics company—part research institution, part data company, and part IP-driven commercial enterprise. Early-stage losses are driven by intentional investment in data and science, while long-term value emerges through scalable data monetization, precision medicine, and licensed genetic intellectual property.
Download Link On Next Page