
Fulfilment Centre DCF Financial Model (2026 Excel)
20-Year Financial Model for a Fulfilment Centre
This extensive 20 Year e-fulfilment model includes detailed revenue projections, cost structures, capital expenditures, and financing needs. This model provides a thorough understanding of the financial viability, profitability, and cash flow position of your 3PL business.
Includes: 20x Income Statements, Cash Flow Statements, Balance Sheets, CAPEX sheets, OPEX Sheets, Statement Summary Sheets, and Revenue Forecasting Charts with the revenue streams, BEA charts, sales summary charts, employee salary tabs and expenses sheets.
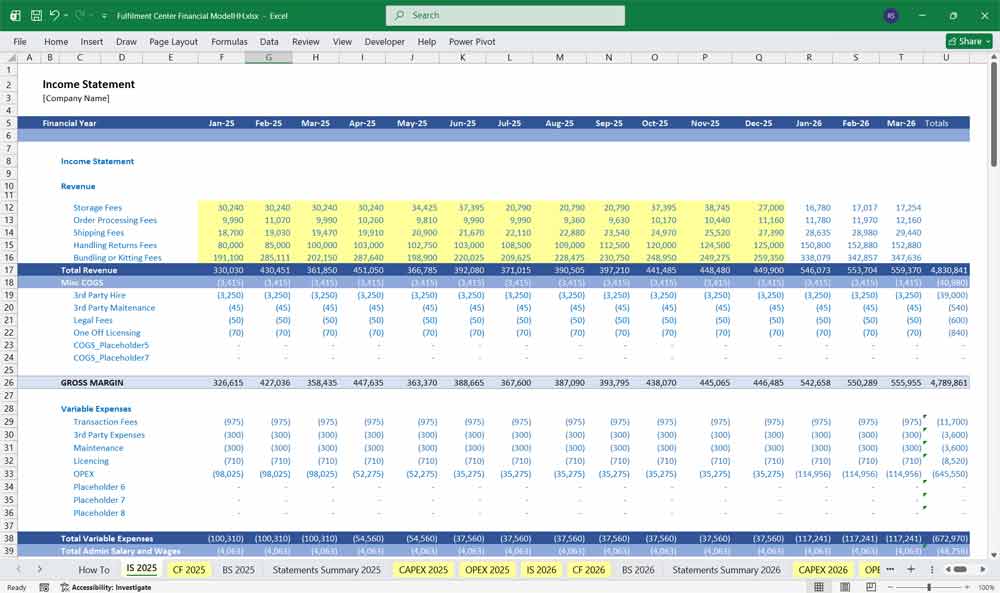
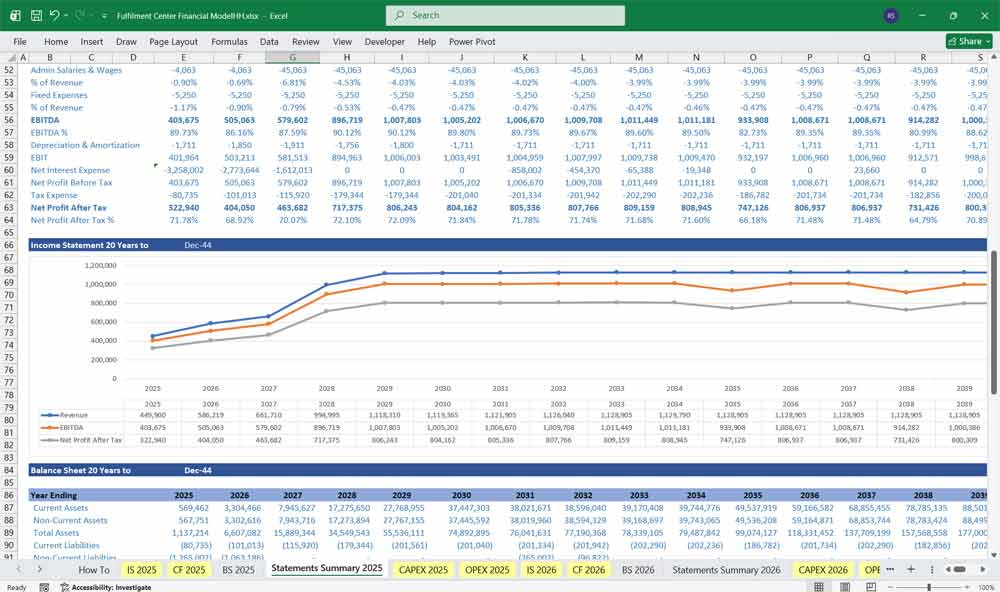
Income Statement (Profit & Loss)
The Income Statement shows the centre’s profitability over a specific period.
Revenue
Revenue streams are often driven by key performance indicators (KPIs) like order volume and inventory stored.
Storage Fees: Revenue based on the space (e.g., cubic feet or pallets) and duration inventory is held. Calculated based on Storage Utilization and the rate per unit/volume.
Handling Fees: Revenue for receiving and processing goods upon arrival. Driven by inbound unit volume.
Pick and Pack Fees: Charges for retrieving items from inventory and preparing them for shipment. Driven by the number of orders and items per order.
Shipping/Freight Management Fees: Charges for arranging and sometimes managing the cost of outbound shipping for clients.
Value-Added Service (VAS) Fees: Revenue from extra services like kitting, returns processing, or quality control.
Cost of Goods Sold (COGS)
For a service-based fulfilment centre, COGS relates directly to the cost of providing the core service.
Direct Labor: Wages for employees directly involved in picking, packing, and shipping. This is a variable cost based on order volume and items per order.
Packaging and Materials: Costs for boxes, tape, labels, dunnage, etc. This is a variable cost based on order volume and size/type of items.
Shipping Costs: The direct cost of shipping borne by the centre (if not directly passed through to the client).
Inventory Storage Costs (Direct): Any direct, variable costs associated with storing client inventory.
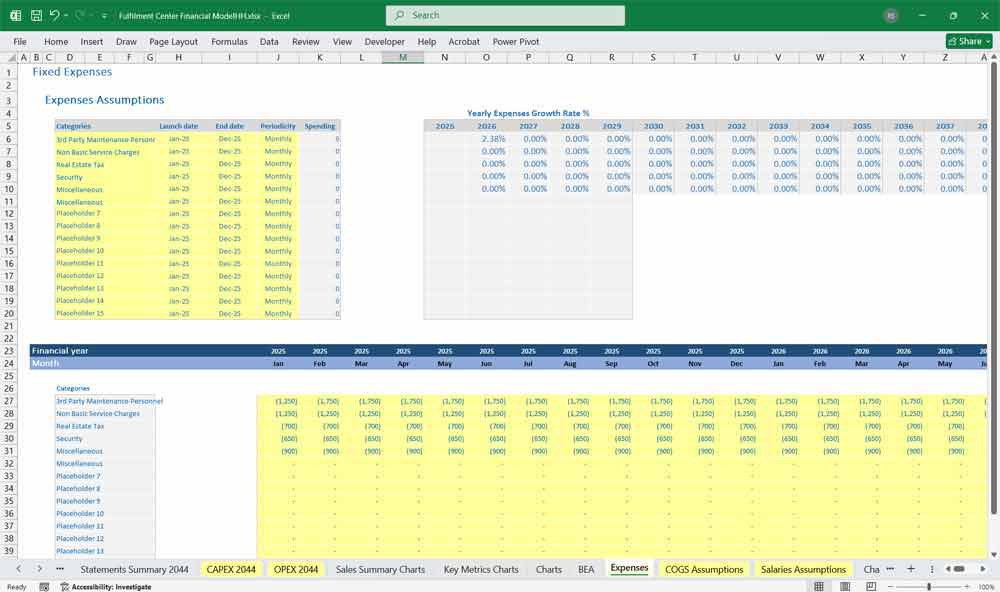
Operating Expenses (OpEx)
OpEx includes costs not directly tied to the fulfilment of a specific order.
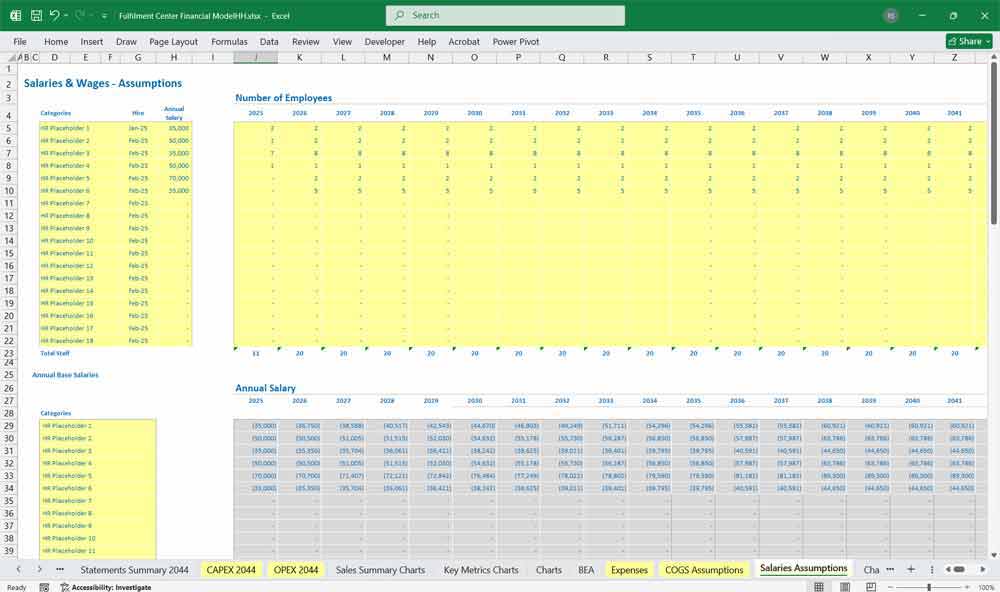
Salaries and Wages (Indirect): Pay for administrative staff, managers, sales, and IT. Primarily a fixed cost.
Rent/Lease: Cost for the warehouse space. Primarily a fixed cost.
Utilities: Electricity, water, and gas for the facility. Partially variable based on operational hours.
Maintenance and Repairs: Upkeep for equipment and the facility.
Technology/Software: Fees for Warehouse Management Systems (WMS), Enterprise Resource Planning (ERP), and other essential software.
Marketing and Sales: Costs to acquire new clients.
Depreciation and Amortization (D&A): Non-cash expense for the wear and tear of assets like material handling equipment and leasehold improvements.
The Income Statement culminates in Net Income after subtracting OpEx and interest/taxes from the Gross Profit (Revenue – COGS).
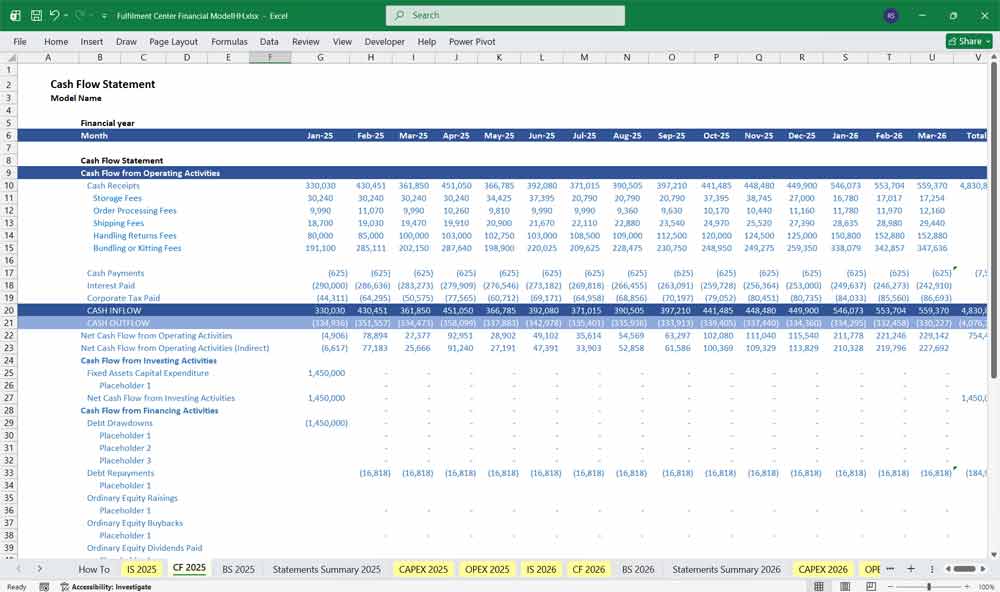
Fulfilment Centre Cash Flow Statement
The cash flow statement divides cash activity into operating, investing, and financing cash flows.
1. Cash Flow from Operating Activities (CFO)
Starts with Net Income, adjusted for non-cash charges and working capital movements.
Key items:
Add back depreciation and amortization
Add back non-cash expenses (provisions, write-offs)
Adjust for changes in:
Accounts receivable
Accounts payable
Inventory (packaging supplies only)
Accrued liabilities
This section shows whether operations generate enough cash to sustain the business.
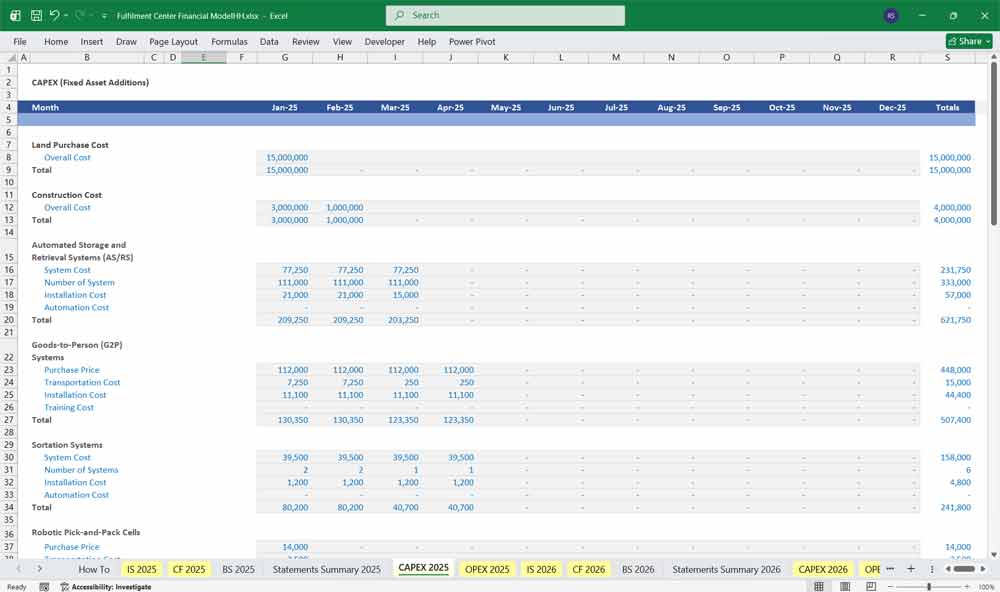
2. Cash Flow from Investing Activities (CFI)
Includes capital expenditures and divestitures:
CapEx for warehouse fit-out
Machinery & equipment purchases
WMS implementation costs
Proceeds from asset sales
Cash flows here are usually negative in growth years.
3. Cash Flow from Financing Activities (CFF)
Reflects financing inflows/outflows:
Proceeds from loans
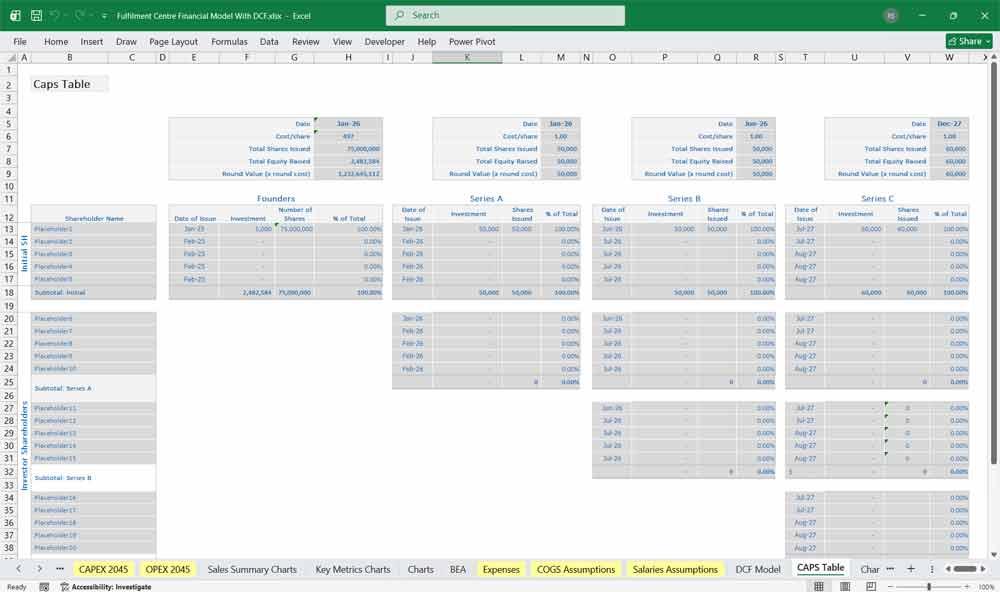
Equity injections
Principal repayments
Interest payments (if classified here)
Dividends (if any)
4. Net Change in Cash
CFO + CFI + CFF
5. Ending Cash Balance
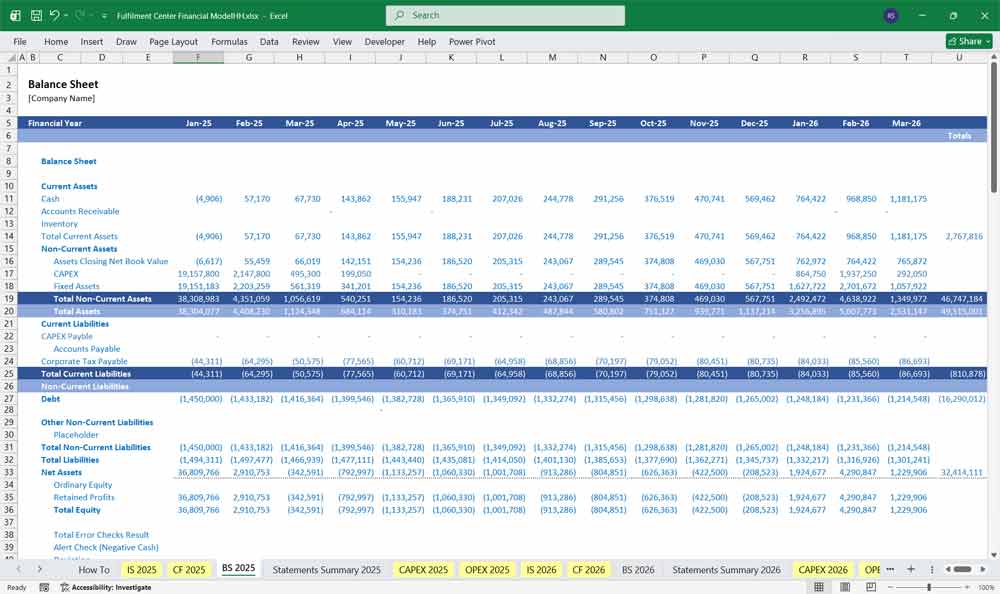
Fulfilment Centre Balance Sheet
The Balance Sheet provides a snapshot of the centre’s assets, liabilities, and equity at a specific point in time.
Assets
Assets are resources owned by the business that are expected to provide future economic benefit.
Current Assets (Less than one year):
Cash and Cash Equivalents: The ending cash balance from the Cash Flow Statement.
Accounts Receivable (A/R): Money owed to the centre by its clients.
Prepaid Expenses: Payments made for services or goods not yet consumed (e.g., prepaid insurance or rent).
Non-Current Assets (More than one year):
Property, Plant, and Equipment (PP&E): Original cost of long-term assets (warehouse space, equipment, technology).
Accumulated Depreciation: The total amount of depreciation expensed over the assets’ useful lives. Net PP&E is the book value (Cost – Accumulated Depreciation).
Liabilities
Liabilities are obligations owed to external parties.
Current Liabilities (Less than one year):
Accounts Payable (A/P): Money owed to suppliers (e.g., packaging vendors, utility providers).
Accrued Expenses: Expenses incurred but not yet paid or invoiced (e.g., accrued wages).
Deferred Revenue: Cash received from clients for services not yet rendered.
Current Portion of Long-Term Debt: Principal payments on debt due within the next year.
Non-Current Liabilities (More than one year):
Long-Term Debt: Total outstanding principal balance of loans, excluding the current portion.
Key E-Fulfilment Centre Industry-Specific Considerations
High Fixed Cost Base: Equipment-heavy industry with high depreciation.
R&D Intensity: Critical for staying competitive.
Quality & Certification: Failure costs can be catastrophic (scrap, rework).
Cyclicality & Diversification: Aerospace/automotive cycles affect volumes.
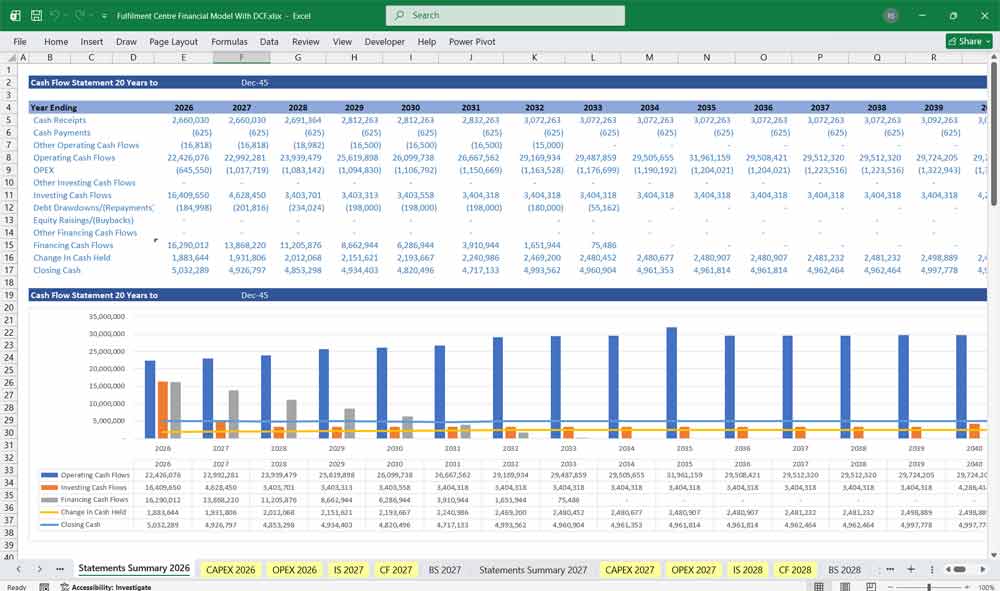
20-Year Fulfilment Centre Financial Model Advantages
A 20-year financial model gives a fulfilment centre manufacturer the ability to plan around long product lifecycles and extended contract horizons. In industries like 3pl logostics, contracts can span 10–15 years, and equipment lifespans often exceed two decades. A long-term model ensures that capital investment decisions—like building and storage facilities or expanding production capacity—are aligned with the revenue and cash flow timelines they are meant to serve.
Looks Closer Into Fulfilment (3PL Logistics) Investments
Long-range modeling allows management to capture the full return on R&D and innovation investments. In the 3PL logistics sector sector, new material systems or delivery processes can take years to develop, certify, and commercialize. A 20-year horizon shows not only the upfront planning costs but also the long-term payoff in reduced delivery costs, expanded service lines, and higher market share over time.
(3PL) E-Fulfilment Dept Financing
A 20-year outlook is essential for real estate and operational scaling, especially considering the volatile nature of the e-commerce market and consumer demands. This extended time horizon enables management to strategically evaluate land acquisition or long-term leasing for future expansion sites, ensuring proximity to key transportation hubs or large labor pools. It provides a structured path for operational growth, allowing the centre to model long-term efficiency gains from higher-density storage solutions and process flow optimization, ultimately protecting and expanding its competitive advantage by minimizing per-unit fulfilment costs as volume increases.
E-Fulfilment (3PL Logistics) Debt Structuring
A comprehensive 20-year plan serves as a vital tool for managing risk and enhancing stakeholder confidence. By projecting financial performance, operational capacity, and resource needs over two decades, the e-fulfilment centre demonstrates a deep understanding of market trends, potential regulatory changes, and competitive threats. This foresight is highly appealing to investors, lenders, and key clients, as it establishes the business as a stable, reliable partner capable of navigating economic cycles and maintaining service levels, thereby securing necessary long-term financing and strengthening enduring business relationships.
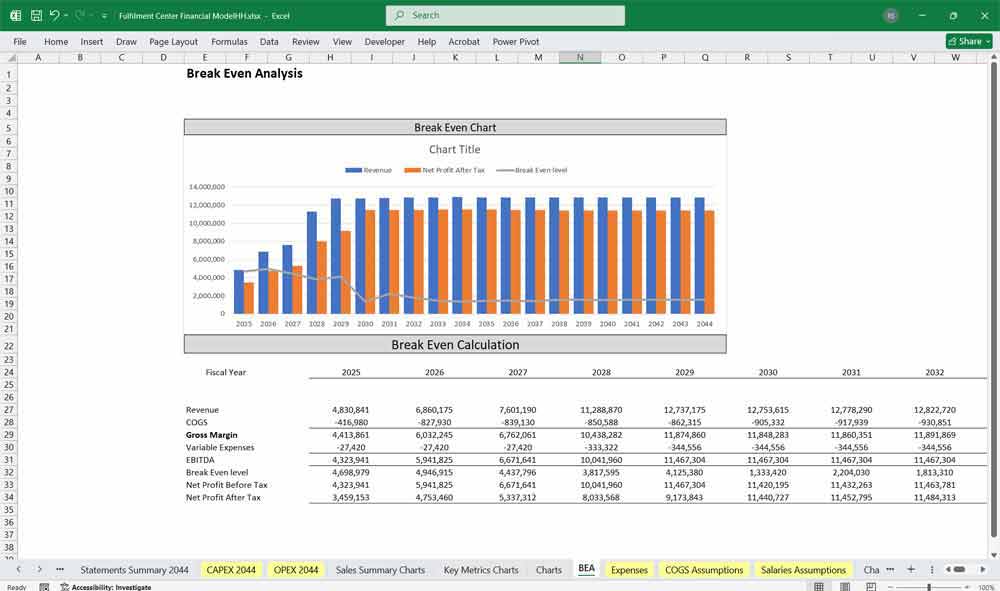
Value Your Fulfilment Centre With A DCF
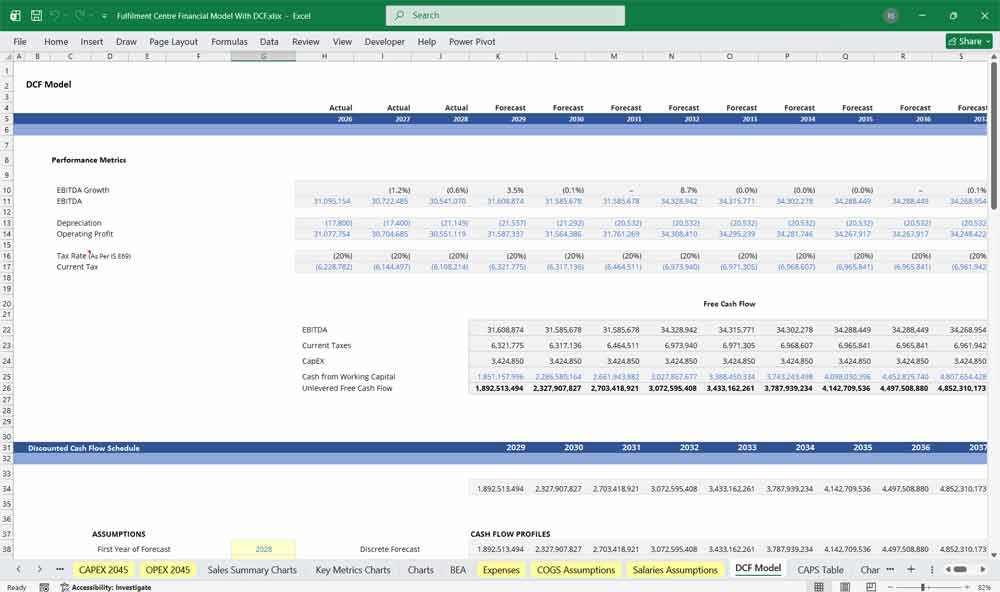
Discounted Cash Flow (DCF): Valuing the “Package-per-Second” Pulse
This Discounted Cash Flow (DCF) analysis for a fulfilment centre estimates the facility’s value based on projected future cash flows generated from warehousing, order processing, storage fees, and logistics services for e-commerce or retail clients. Revenue forecasts are driven by order volumes, warehouse capacity utilization, service pricing, and long-term client contracts, while costs include labor, automation systems, utilities, maintenance, and capital expenditures for technology and infrastructure upgrades. The projected free cash flows over a defined forecast period, along with a terminal value reflecting the centre’s long-term operational role in supply chains, are discounted to present value to determine its intrinsic value.
WACC: Pricing Infrastructure Stability vs. Tech Obsolescence
Weighted Average Cost of Capital (WACC) is used as the discount rate in valuing a fulfilment centre and reflects the blended cost of equity and debt financing. The risk profile of such facilities is influenced by e-commerce growth trends, client concentration, operational efficiency, lease structures, and technological investment in automation and robotics. The WACC incorporates investors’ required returns, the capital structure mix, and the tax advantages of debt, representing the minimum return necessary to justify investment in the logistics infrastructure.
Sensitivity Analysis: Stress-Testing Labor and “Picks-per-Hour”
Sensitivity analysis is important in valuing a fulfilment centre due to uncertainties in order volumes, service pricing, labor costs, and capital investment requirements. Analysts typically test changes in key assumptions such as throughput growth, capacity utilization, operating margins, automation costs, and WACC. By evaluating how variations in these inputs affect the DCF valuation, sensitivity analysis highlights the most critical value drivers and provides a range of potential outcomes to support strategic planning and investment decisions.
Final Notes on the Financial Model
This 20-Year Fulfilment Centre Manufacturer Financial Model focuses on balancing capital expenditures with steady revenue growth from all your 3PL services. By optimizing operational costs, and power efficiency, and maximizing high-margin services, the models ensure sustainable profitability and cash flow stability.
Download Link On Next Page
Download Link On Next Page