
Food Manufacturer Financial Model Template
This food manufacturer financial model is a fully integrated Excel template for food and beverage producers, co-packers, bakeries, snack makers, sauce manufacturers and frozen food businesses. It links SKU-level sales, recipes, production capacity, raw material costs, packaging, labor, capex and financing into a live income statement, cash flow statement and balance sheet. You get three years of monthly historical actuals and a five-year monthly forecast, with an annual roll-up column after every year.
Financial Model for a Food Manufacturer
Every number in the forecast is driven by formulas. Change one input, like selling prices, volume growth, ingredient inflation, line speeds or payment terms, and the whole model updates, from the cost per unit to EBITDA, free cash flow, DSCR and valuation. Change the Model Start Date and every date, header, launch profile, capex schedule and depreciation calculation re-dates automatically.
Built to a bankable formatting standard, this food manufacturing financial projection template is suitable for budgeting, lender presentations, investor due diligence, plant expansion business cases and M&A valuation. It has a DCF valuation, equity IRR and MOIC, a Base / Upside / Downside scenario selector, first-order sensitivities, a KPI tab, a management dashboard with charts and an automated checks tab that confirms the balance sheet balances in every period. It suits CFOs, FP&A teams, founders, private equity analysts and consultants.
What’s Inside: Tab-by-Tab Overview
01. Cover Control
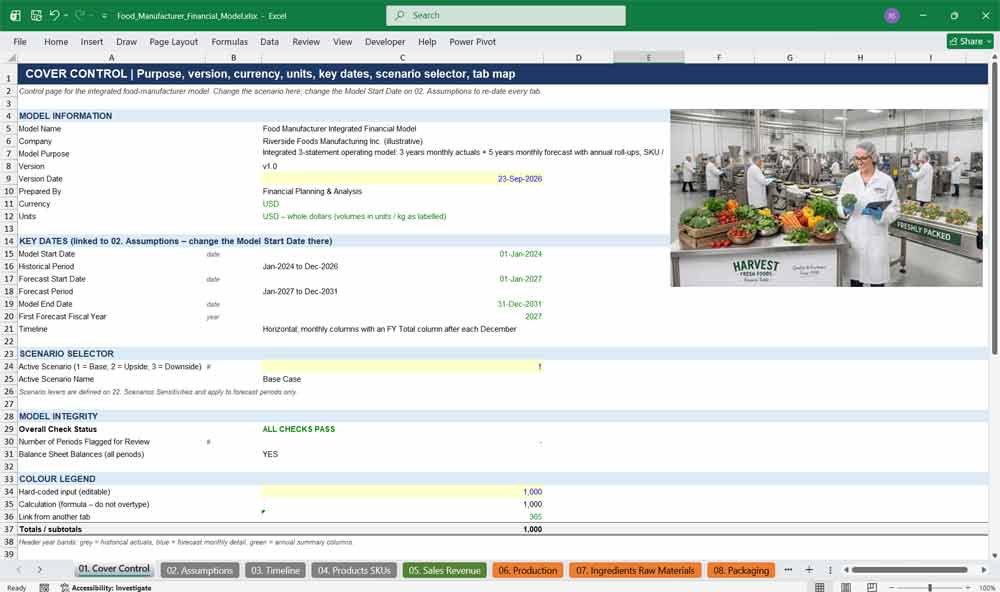
The Cover Control tab is the front page of the food manufacturing model. It shows the model’s purpose, version, currency, units and key dates, the scenario selector, the overall model check status, a colour legend and a hyperlinked map of all 25 tabs.
- Base / Upside / Downside scenario selector with a drop-down list
- Live key dates: historical period, forecast period and model end date
- Model integrity status linked to the Checks tab
- Input / formula / link colour legend
- Clickable tab map for fast navigation
02. Assumptions
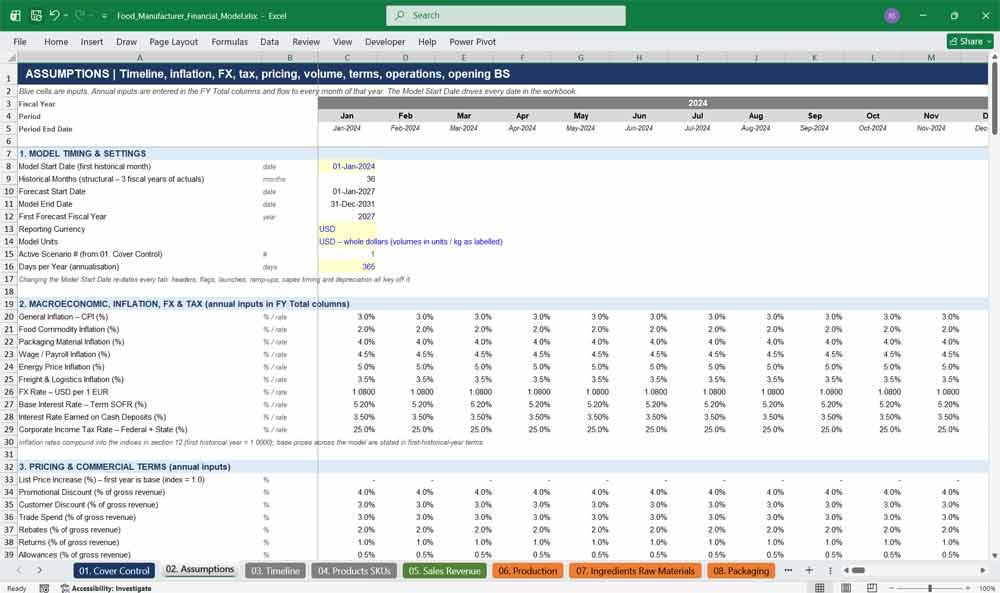
The Assumptions tab holds every global driver: inflation, FX, tax, pricing, volume growth, channel mix, payment terms, operating assumptions and the opening balance sheet. A single Model Start Date drives every date in the model, which makes re-forecasting quick.
- One Model Start Date re-dates the whole workbook
- Annual inputs for CPI, food, packaging, wage, energy and freight inflation
- EUR/USD FX, SOFR interest rates and corporate tax rate
- Discounts, rebates, returns, channel mix and customer payment terms (DSO)
- Opening balance sheet with retained earnings calculated so it always balances
Food Manufacturer Operating Costs
03. Timeline
The Timeline tab generates the calendar logic behind the model: historical and forecast flags, period numbers, days per month, seasonality, production line ramp-up curves and new product launch profiles. Everything is formula-driven and keyed to the start date.
- Actual vs forecast flags and forecast year numbering
- Monthly seasonality index applied to demand
- New production line ramp-up efficiency curves
- SKU launch, ramp-up and discontinuation flags
- Active SKU count over time
04. Products SKUs
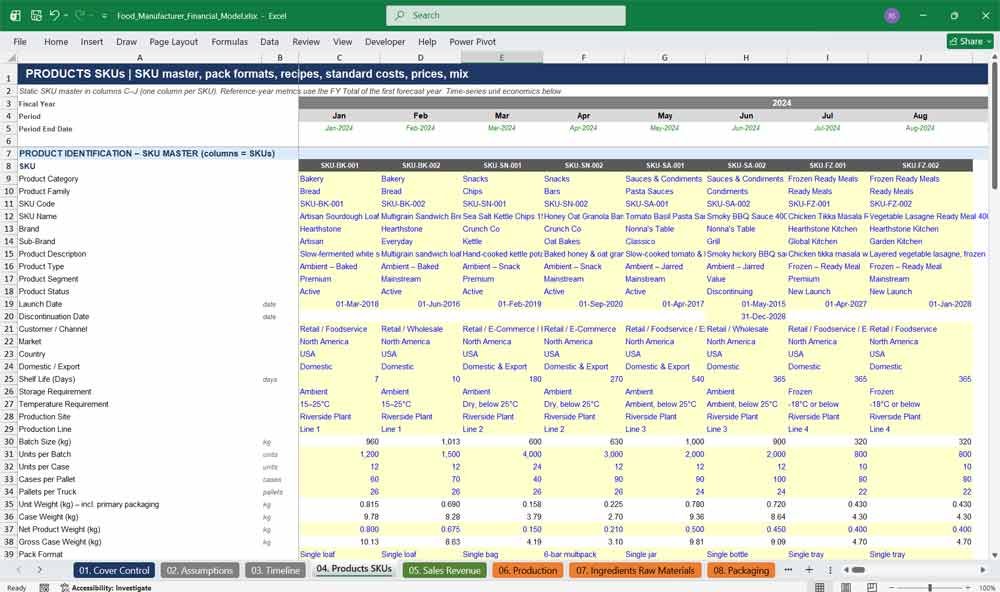
The Products SKUs tab is a full SKU master for food manufacturing: categories, brands, pack formats, units per case, pallet configuration, recipes, shelf life, yields, standard costs, list prices, target margins, product mix and unit economics for every product.
- Over 60 SKU attributes, from product category to production hours per unit
- Units per case, cases per pallet, pallets per truck and weights
- Standard cost, COGS per unit, gross margin and contribution margin by SKU
- Product mix and reference-year volume, revenue and tonnes
- Monthly unit economics by SKU
05. Sales Revenue
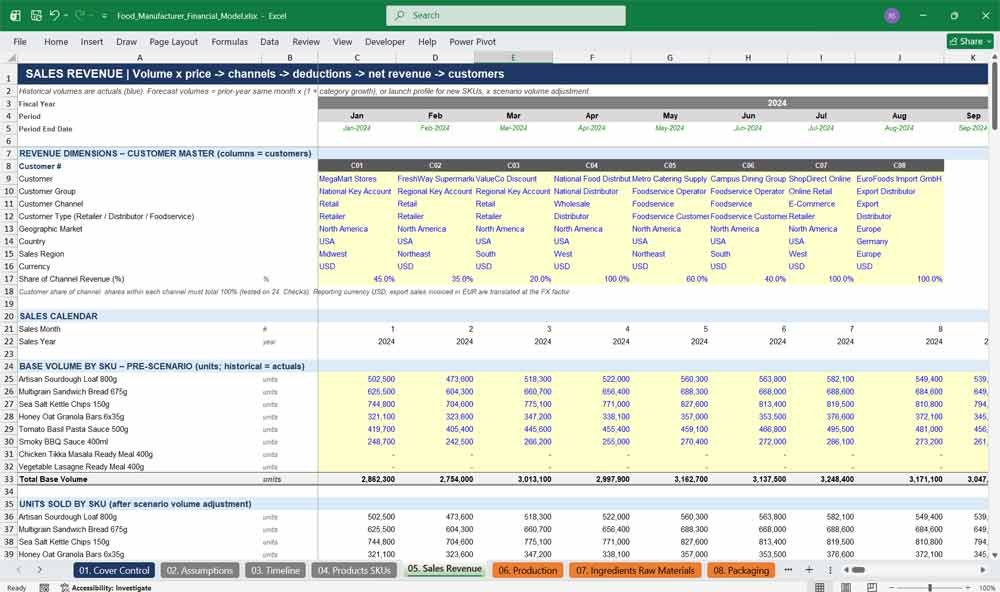
The Sales Revenue tab builds revenue from volume × price by SKU. It then flows through channels, discounts, trade spend, rebates, returns and allowances to net revenue, with analysis by category, brand, customer, channel, geography, budget variance and growth.
- Historical volume actuals and a forecast built from growth rates and seasonality
- Retail, wholesale, foodservice, e-commerce and export channels
- Full revenue waterfall from gross revenue to net revenue
- Revenue by SKU, category, family, brand, customer, region and country
- Revenue growth, price/volume/mix and actual vs budget variance
06. Production
The Production tab converts sales demand into a production plan. It covers finished goods stock build, good and gross production, yields, rejects, batches, production runs, changeovers and line-by-line capacity utilization, so you can see capacity constraints and plant bottlenecks.
- Production = sales + target finished goods cover − opening stock
- Yield loss, rejects and wastage rate by SKU
- Batches, production runs, changeover, setup and cleaning hours
- Scheduled vs effective capacity hours with OEE and ramp-up
- Capacity utilization by line, including capacity added by capex
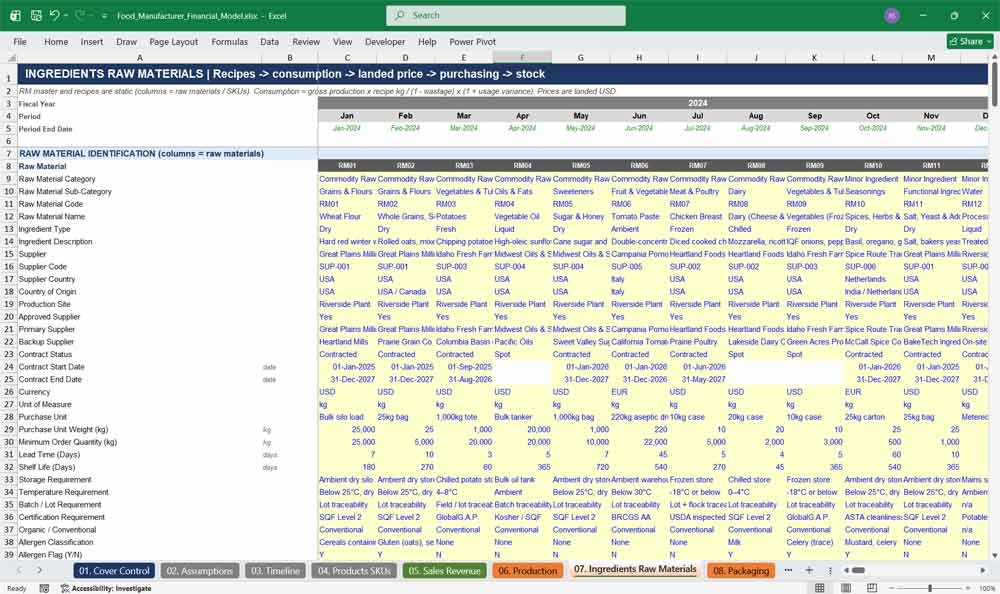
07. Ingredients Raw Materials
The Ingredients Raw Materials tab models food input costs end to end: raw material master data, recipes and formulations, gross ingredient consumption, landed cost per kg with FX and duty, purchasing, inventory, supplier analysis, variances and the raw material cost of goods.
- Raw material master covering suppliers, contracts, allergens, certifications and specs
- Recipe percentages and net and gross ingredient requirements per unit
- Landed cost build: price, freight, duty, insurance and handling
- Purchasing, receipts, rejections, safety stock and reorder point
- Price and usage variances, supplier mix and supplier concentration
08. Packaging
The Packaging tab models primary, secondary and tertiary packaging: bags, films, jars, lids, trays, labels, cartons, corrugated cases and pallet wrap. Usage per SKU drives consumption, costs, packaging inflation, wastage, inventory and price and usage variances.
- Packaging master with specifications, suppliers and recyclability
- Usage matrix per SKU unit, with cases and pallets derived automatically
- Packaging cost per unit, per case and as a percentage of revenue
- Packaging inventory, purchases and inventory days
- Budget vs actual price and usage variances
09. Manufacturing Costs
The Manufacturing Costs tab is the factory cost engine. It covers direct labor, fixed factory overhead, utilities, maintenance, quality and food safety, waste, warehousing, variable and fixed costs, a SKU cost build, production line economics, downtime and standard vs actual cost variances.
- Direct labor, overtime, shift premiums and agency labor
- Maintenance, quality control, recall provision and waste costs
- Overhead absorption and under-absorption
- SKU-level manufacturing cost per unit
- Line economics, downtime analysis and cost variance analysis
10. Energy Utilities
The Energy Utilities tab calculates electricity, natural gas, LPG, diesel, water, steam, refrigeration, compressed air and wastewater costs. Consumption is driven by line run-hours, tonnes produced and base loads, and priced at tariffs linked to energy inflation.
- Energy intensity per line and per production hour
- Refrigeration and cold store loads for frozen products
- Energy savings from capex projects, such as electric forklifts and wastewater treatment
- Fixed vs variable utilities split
- Price and usage variances and kWh per tonne
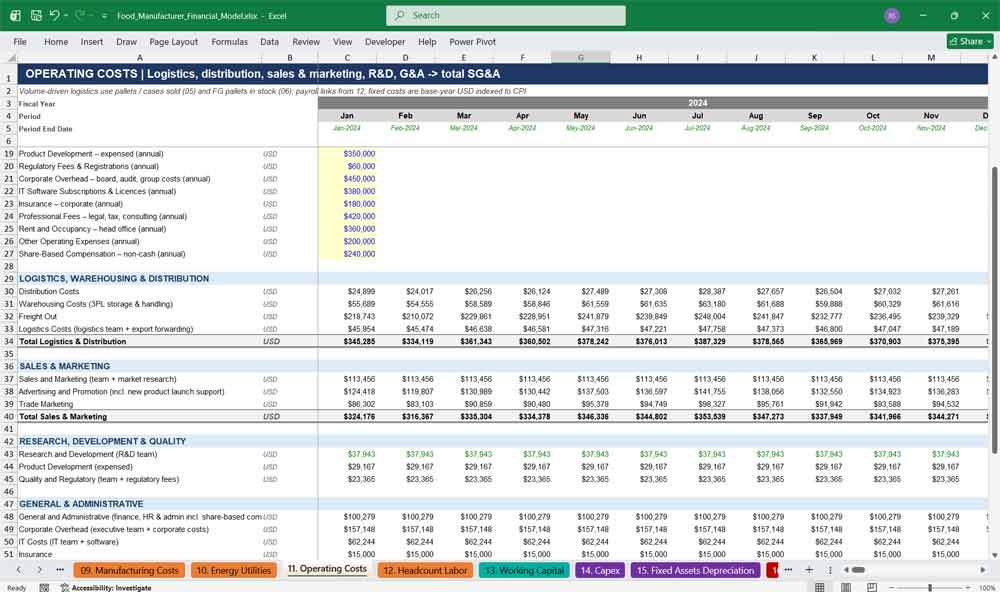
11. Operating Costs
The Operating Costs tab models SG&A for a food business: freight out, distribution, third-party warehousing, logistics, sales and marketing, advertising, trade marketing, new product launch support, R&D, quality and regulatory, general and administrative costs, IT, insurance and rent.
- Volume-driven freight, distribution and warehousing costs
- Advertising and trade marketing as a percentage of revenue, plus launch budgets
- Payroll linked automatically from the Headcount tab
- Share-based compensation and gain or loss on asset disposals
- Operating expenses as a percentage of revenue and per unit
12. Headcount Labor
The Headcount Labor tab builds payroll by role and cost category. Operator headcount is driven by line shifts and crew sizes, and the tab covers salaries, wage inflation, overtime, shift premiums, bonuses, employer taxes, pensions, benefits, recruitment, training and temporary agency labor.
- 16 roles mapped to 12 cost categories
- Production operators calculated from active lines, shifts and crews
- Seasonal temporary labor
- Full employment cost build and payroll inflation
- Direct labor hours and average cost per FTE
Food Manufacturer Financial Statements
13. Working Capital
The Working Capital tab calculates receivables by channel, raw material, packaging, work-in-progress and finished goods inventory, payables, accruals, customer deposits and provisions. It also produces net working capital, DSO, DIO, DPO and the cash conversion cycle.
- Receivables based on payment terms (DSO) for each channel
- Finished goods valued at SKU manufacturing cost
- Trade payables, accrued expenses, accrued payroll and sales tax
- Recall provision roll-forward
- Cash conversion cycle and working capital as a percentage of revenue
14. Capex
The Capex tab models capital projects and sustaining capex programmes. It covers project budgets, spend phasing, construction in progress, commissioning, capacity expansion, funding mix, capex cash flow, asset disposals, efficiency metrics and budget vs actual tracking.
- Project register with over 25 identification fields
- Spend profile, CIP and transfers on the in-service date
- 36 capex categories, with sustaining and expansion splits
- Funding from cash, debt, lease, equity, grants or supplier financing
- Capacity uplift, payback period, ROIC and capex budget variance
15. Fixed Assets Depreciation
The Fixed Assets Depreciation tab runs the fixed asset register by class. It covers opening assets, additions from capex, disposals, straight-line depreciation over each class’s useful life, amortization of intangibles and net book value, and maps depreciation to the income statement and balance sheet.
- 10 asset classes, from land and buildings to software
- Depreciation on opening assets and on new additions
- Asset disposals with gain or loss
- Factory depreciation split for unit costing
- Net book value roll-forward check
16. Debt Financing
The Debt Financing tab models Term Loan A, a capex facility, a revolving credit facility and equipment leases. It covers drawdowns, repayments, interest, arrangement and commitment fees, dividends, equity flows, DSCR, leverage covenants and interest cover, all without circular references.
- Automatic revolver draws and cash sweep to keep a minimum cash balance
- Capex facility drawn to fund debt-financed projects
- Interest based on SOFR plus a margin, with no circular references
- Dividend policy and equity raises
- LTM DSCR, net debt / EBITDA and covenant tests
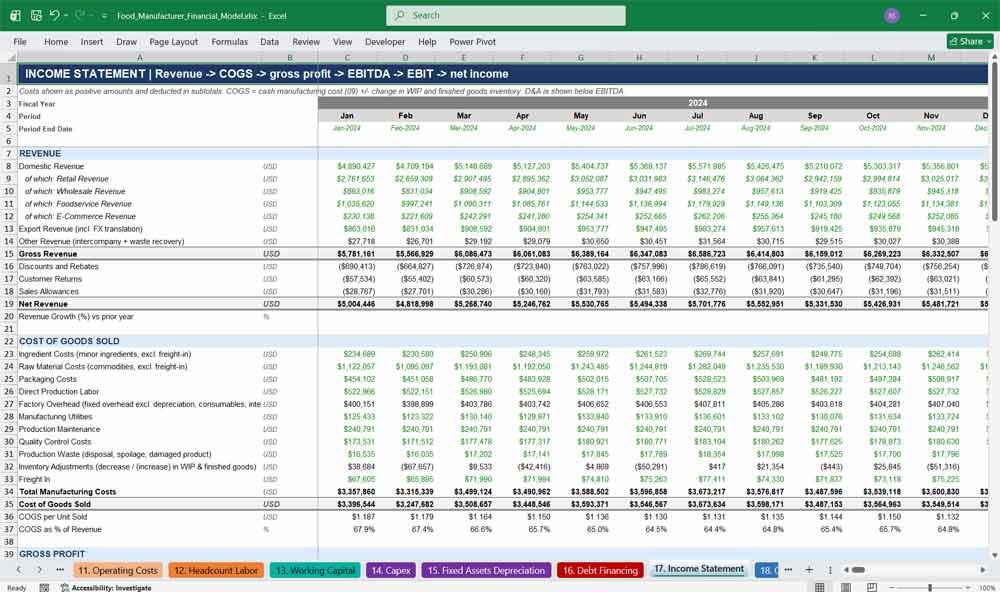
17. Income Statement
The Income Statement tab presents a full food manufacturer P&L: domestic and export revenue, discounts and rebates, net revenue, detailed COGS, gross profit, operating expenses, EBITDA, depreciation and amortization, EBIT, finance costs, tax, net income and EPS, monthly and annually.
- Revenue split by channel and geography
- COGS covering ingredients, packaging, labor, overhead, utilities and waste
- Gross, EBITDA, EBIT and net margins
- Per-unit profitability metrics
- Revenue and net income growth rates
18. Cash Flow
The Cash Flow tab is an indirect-method cash flow statement. It covers operating, investing and financing cash flows, detailed working capital movements, capex by type, debt drawdowns and repayments, dividends, free cash flow, FCF conversion, debt service and closing cash.
- Detailed working capital cash flow lines
- Maintenance vs expansion capex
- Free cash flow and cash conversion
- Cash available for debt service
- Net debt and leverage summary
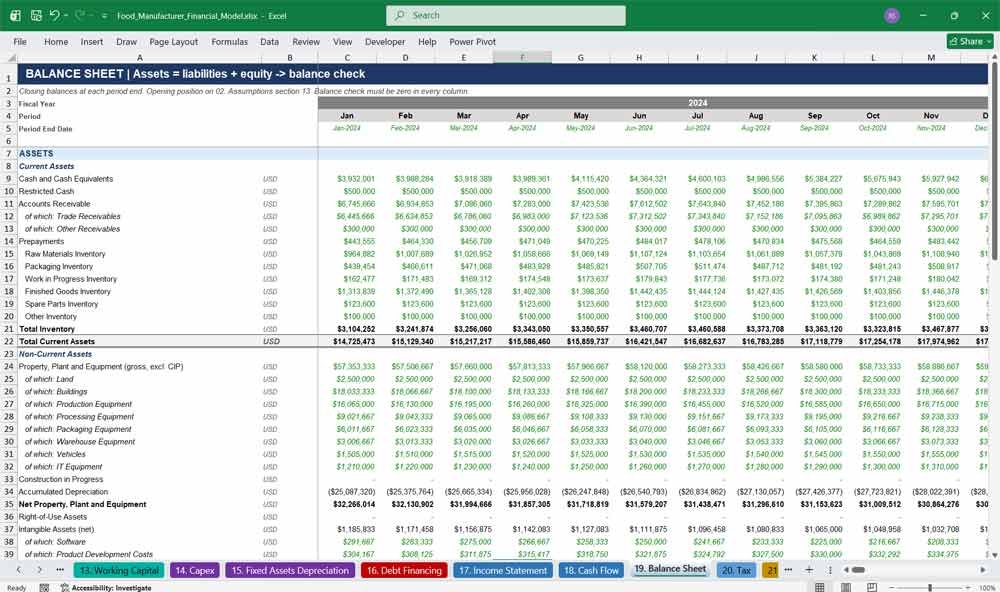
19. Balance Sheet
The Balance Sheet tab reports assets, liabilities and equity at every month-end: cash, receivables, four inventory types, PP&E by class, intangibles, payables, accruals, debt split between current and non-current, provisions, deferred tax and equity. It includes a balance check that is zero every month.
- Complete current and non-current asset detail
- Current portion of debt and leases calculated automatically
- Retained earnings, current-year profit and dividends shown separately
- Balance check and status flag
- Linked to the opening balance sheet
20. Tax
The Tax tab calculates taxable income, accelerated tax depreciation, use of tax losses with an 80% limit, current tax, deferred tax liabilities and assets, the effective tax rate and quarterly cash tax payments. This gives a realistic tax charge and tax cash flow.
- Tax depreciation using shorter tax lives by asset class
- Tax losses carried forward and used
- Deferred tax on timing differences and tax losses
- Current tax payable roll-forward
- Effective tax rate and cash tax rate
Key Financial Metrics for a Food Manufacturer
21. Returns Valuation
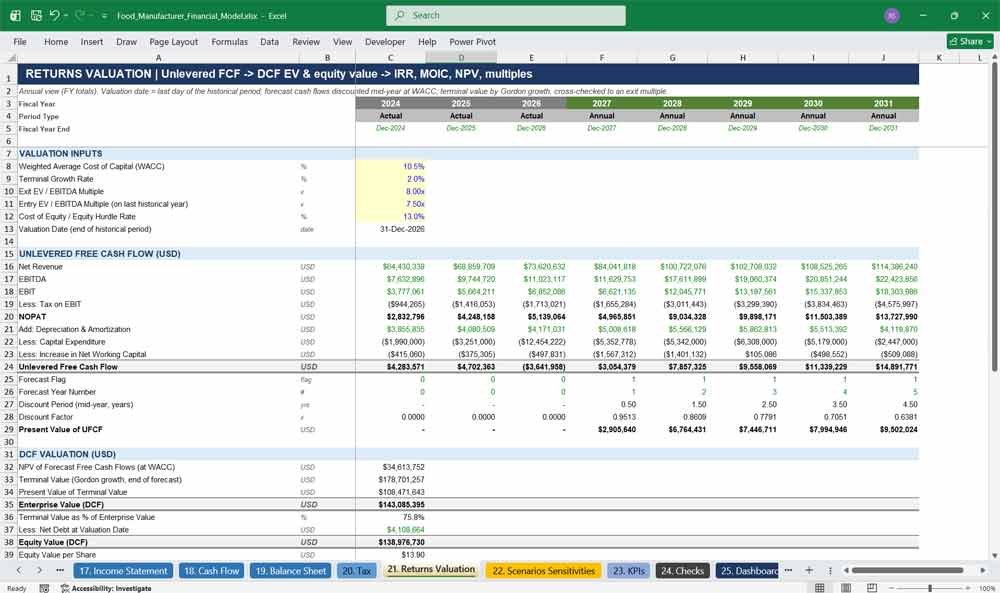
The Returns Valuation tab values the food manufacturing business with a DCF. It calculates unlevered free cash flow, NPV and a terminal value, then enterprise value and equity value, cross-checked by the exit multiple method. Investor returns include equity IRR, MOIC and NPV.
- DCF with mid-year discounting and a Gordon growth terminal value
- Exit-multiple enterprise value cross-check
- Equity IRR, MOIC and NPV at a hurdle rate
- EV/Revenue, EV/EBITDA, EV/EBIT and P/E multiples
- Equity value per share
22. Scenarios Sensitivities
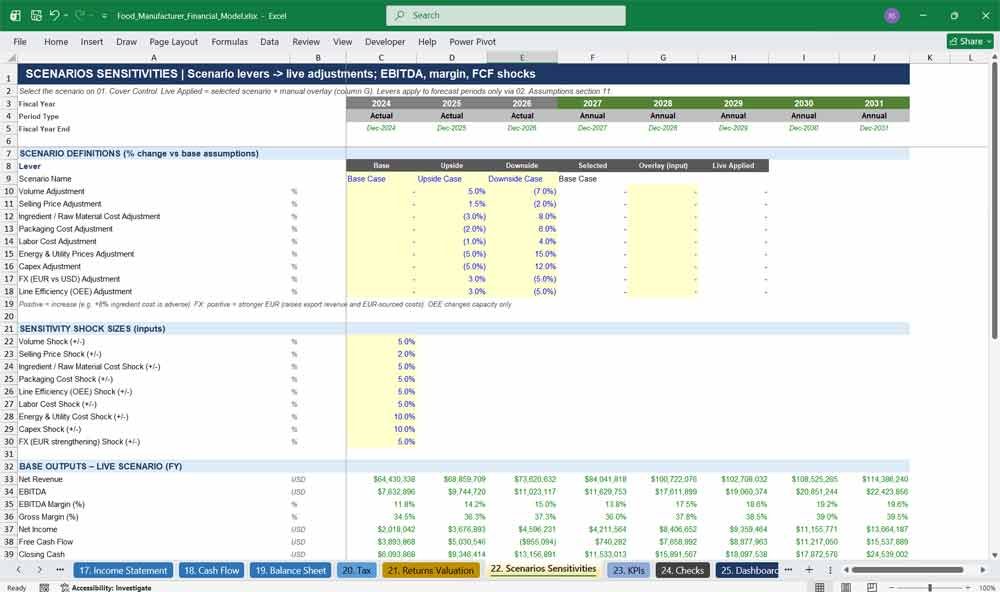
The Scenarios Sensitivities tab defines Base, Upside and Downside cases across nine levers: volume, price, ingredients, packaging, labor, energy, capex, FX and OEE. It adds a manual overlay and quick estimates of how each shock affects EBITDA, margin, FCF and utilization.
- One-click scenario switching from the Cover tab
- Manual overlay column for custom stress tests
- Estimated EBITDA impact of each shock
- EBITDA margin sensitivities
- Capex and OEE sensitivities
23. KPIs
The KPIs tab brings together the key performance indicators for food manufacturing: volume, revenue per unit, per case and per tonne, margins, yield, wastage, capacity utilization, downtime, unit costs, inventory days, cash conversion cycle, ROIC, leverage, DSCR and productivity.
- Over 40 KPIs, monthly and annually
- Operational KPIs: yield, wastage, utilization and energy intensity
- Unit cost KPIs from ingredients to utilities
- Working capital days and cash conversion cycle
- Revenue per FTE and units per labor hour
24. Checks
The Checks tab validates the whole model automatically. It runs 28 integrity checks in every period, covering the balance sheet, cash, debt, inventory, fixed assets, equity, revenue and costs, plus static input checks and commercial warnings, and gives a PASS or REVIEW status.
- Balance sheet and cash tie-out checks in every month
- Debt, inventory, CIP and fixed asset roll-forward checks
- Revenue and EBITDA reconciliations across tabs
- Checks on recipe, funding-mix and customer-share inputs
- Warnings for minimum cash, capacity and covenant issues
25. Dashboard
The Dashboard tab gives management a one-page summary of the model: headline valuation and returns, annual revenue, EBITDA, margins, cash flow, net debt, production, utilization, working capital and headcount, plus charts that update with the scenario and start date.
- Headline revenue and EBITDA growth rates (CAGR), enterprise value, IRR and MOIC
- Annual financial and operating summary tables
- Six charts: revenue, margins, cash, net debt, production and utilization
- Scenario name and model check status
- Ready for board and investor presentations
Why Buy This Model
Building an integrated food manufacturing model from scratch takes weeks of specialist work, and mistakes are easy to make. This template gives you a tested, fully linked model that follows a product from recipe to production line to P&L, cash flow and balance sheet in one workbook. It goes much deeper than generic templates: SKU recipes, yields, packaging usage, line capacity, energy intensity, capex commissioning and debt covenants are all modelled explicitly. The formatting follows the conventions lenders and investors expect: colour-coded inputs, one master start date, numbered and colour-coded tabs, and 28 automated integrity checks. You can replace the illustrative data with your own products, suppliers and plant, re-date it in seconds, and use it for budgeting, bank financing, fundraising or acquisition analysis with confidence.
Food Manufacturing Frequently Asked Questions (Faq)
Q: What type of food business is this financial model designed for?
A: It is designed for food and beverage manufacturers that make their own products, such as bakeries, snack producers, sauce and condiment makers, ready-meal and frozen food plants, and co-manufacturers. The sample data covers ambient, jarred and frozen products, so it adapts to most food manufacturing businesses.
Q: Can I change the start date and forecast years?
A: Yes. Change the Model Start Date on the 02. Assumptions tab and every date, year header, month label, flag, launch profile, capex timeline and depreciation schedule updates automatically. Years show as real years (for example 2027, 2028), not Year 1 or Year 2.
Q: How long is the forecast period?
A: The model has three years of monthly historical actuals and a five-year monthly forecast. Each year has an FY Total column next to its months, so you get monthly detail and an annual summary side by side.
Q: Does it include a full three-statement model?
A: Yes. The income statement, cash flow statement and balance sheet are fully linked. The balance sheet balances in every month, and the Checks tab confirms it automatically along with 27 other integrity checks.
Q: Can I add my own products, recipes and ingredients?
A: Yes. SKUs, recipes, raw materials, packaging and production lines are set up as clear input tables with blue input cells. Enter your own product names, recipe percentages, supplier prices, pack formats and line speeds, and the costs, capacity and financials recalculate.
Q: Is the sample data real?
A: No. The model uses an illustrative company, Riverside Foods Manufacturing Inc., with realistic but made-up assumptions. It is there to show how the model works and to show the expected input format, and you should replace it with your own data.
Q: What currency does the model use?
A: The model reports in USD. It also includes a EUR/USD FX rate for imported ingredients and export sales, so you can model currency exposure. The currency label is an input you can change.
Q: Does the model handle new product launches and discontinued products?
A: Yes. Each SKU has a launch date and an optional discontinuation date. New products ramp up to a steady-state volume over a set period, and leftover stock of discontinued products is written off automatically.
Q: Can I model a new production line or factory expansion?
A: Yes. The Capex tab lets you add projects with budgets, construction dates, commissioning and in-service dates, asset classes, capacity uplift and funding mix. New lines add capacity, labor, energy use and depreciation automatically when they come into service.
Q: How does the model calculate cost of goods sold?
A: COGS is built from the bottom up: ingredients (from recipes and landed prices), packaging, direct labor, factory overhead, utilities, maintenance, quality, waste and freight-in, adjusted for changes in work-in-progress and finished goods inventory. You can see the cost per unit by SKU.
Q: Does it include scenario and sensitivity analysis?
A: Yes. You can switch between Base, Upside and Downside cases from the Cover tab, across nine levers including volume, price, ingredient cost, energy and FX. The Scenarios tab also shows the estimated EBITDA and margin impact of individual shocks.
Q: Is there a valuation and investor returns section?
A: Yes. The Returns Valuation tab includes a DCF valuation with a terminal value, an exit-multiple cross-check, equity value, equity IRR, MOIC, NPV and valuation multiples, which are useful for fundraising, M&A or lender discussions.
Q: Does the model use macros or VBA?
A: No. It uses standard Excel formulas only, with no macros and no circular references, so it is transparent, auditable and safe to share with banks and investors.
Q: Which software do I need to open it?
A: Microsoft Excel for Windows or Mac. It uses widely supported functions such as SUMIFS, INDEX/MATCH and IFERROR. It also recalculates in LibreOffice. We haven’t tested it in Google Sheets or Apple Numbers.
Q: Will it work for lenders and bank financing applications?
A: Yes. The model includes debt schedules, DSCR, net debt / EBITDA, interest cover, covenant tests and cash flow available for debt service, which are the metrics lenders typically ask for when assessing food manufacturing loans and capex facilities.
Q: How do I know the model is error-free?
A: The 24. Checks tab runs 28 integrity checks in every period. They cover the balance sheet, cash, debt and inventory roll-forwards, fixed asset reconciliation and revenue and cost tie-outs. The overall status shows on the Cover tab as “ALL CHECKS PASS” or “REVIEW CHECKS”.
Q: Is this model suitable for someone who is not a financial modelling expert?
A: Yes. Inputs are blue cells on a yellow background, formulas are black and links to other tabs are green. Every tab has a summary title band and a description line, and the Cover tab has a hyperlinked tab map, so users of any experience level can find their way around.
Final Notes on the 5-Year Financial Model
Financial model for a Food manufacturer
- Scenario Analysis: Create best-case, base-case, and worst-case projections.
- Break-even Analysis: Determine sales volume required to cover fixed & variable costs.
- Sensitivity Analysis: Assess how changes in raw material costs, pricing, or demand impact profitability.
This structured model helps a Food manufacturing company address a broad market spectrum, offering the right balance between cost, production capacity, and support.
Download Link On Next Page