
10 year Flour Mill Financial Model Template
Planning a flour mill business, wheat milling plant, or grain processing expansion? This Flour Mill Financial Model Template is a fully-built, formula-driven Excel template designed for entrepreneurs, CFOs, consultants, and investors who need bankable financial projections fast. Instead of building a wheat milling business plan from a blank spreadsheet, you get a complete 18-tab financial model covering production, revenue, costs, capex, financing, and valuation — built the way lenders and investors actually expect a flour mill feasibility study to look, with two years of historical detail and a full ten-year forecast.
10-Year Financial Model for a Flour Mill
Unlike generic financial model templates, this flour mill Excel model starts with the physical operations — wheat tonnes purchased, milling capacity, extraction rate, flour yield, and bran/by-product output — before a single revenue number is calculated. That means your P&L, cash flow, and balance sheet are all driven by real milling economics, not top-down guesses. The model includes monthly detail for the first five forecast years with automatic annual roll-ups, then annual detail for years six through ten, all on a single horizontal timeline denominated in USD.
Every date in the workbook — historical, forecast, monthly, and annual — is linked to a single Model Start Date input, so shifting your project timeline updates all 18 tabs automatically. Built-in sensitivity toggles let you stress-test wheat prices, flour prices, capacity utilisation, extraction yield, FX, energy costs, and capex in real time, while the integrated Checks tab confirms the balance sheet, cash flow, and debt schedule tie out in every single period. Whether you need a flour mill business plan for a bank loan, an investor pitch deck backup, or an internal feasibility study, this model is ready to customize and present.
Why Buy This Flour Mill Model
Building a flour milling financial model from scratch can take weeks of analyst time and still miss the operational detail that lenders and investors scrutinize most — extraction rates, capacity utilisation, wheat procurement cycles, and working capital days. This template compresses that work into a ready-made, fully-linked Excel file with zero formula errors, professional formatting, and a physical-operations-first structure that mirrors how real flour mills actually make money. Every assumption is clearly color-coded and editable, every statement is cross-checked automatically, and every output — from EBITDA and DSCR to Project IRR and Enterprise Value — updates instantly when you change a single input. If you need a credible, investor-ready flour mill financial model without reinventing the wheel, this is the fastest path there.
Tab By Tab Content Highlights
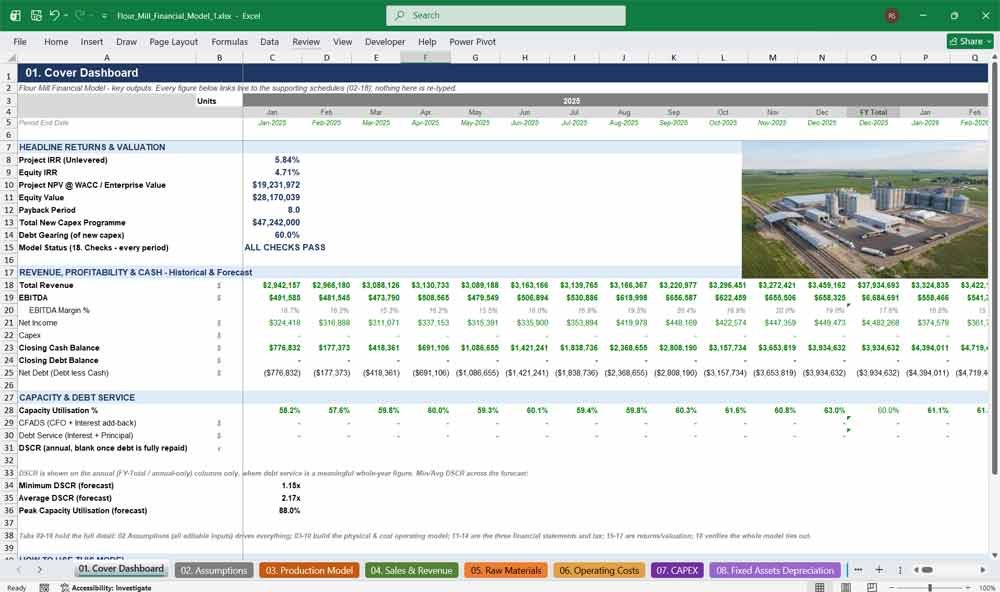
01. Cover Dashboard
Your flour mill financial model’s executive summary: a single-page dashboard of revenue, EBITDA, cash, debt, IRR, DSCR, and capacity utilisation, built for investor meetings and loan committees, pulling live results from every tab so decision-makers see the full picture instantly.
Highlights:
- One-page snapshot of Project IRR, Equity IRR, Enterprise Value, Equity Value, and Payback Period
- Live revenue, EBITDA, EBITDA margin, net income, cash, and debt across the full 2025–2036 timeline
- Automatic DSCR and capacity utilisation tracking, with minimum/average DSCR flagged for lenders
- Built-in “Model Status” check confirming every tab balances before you present it
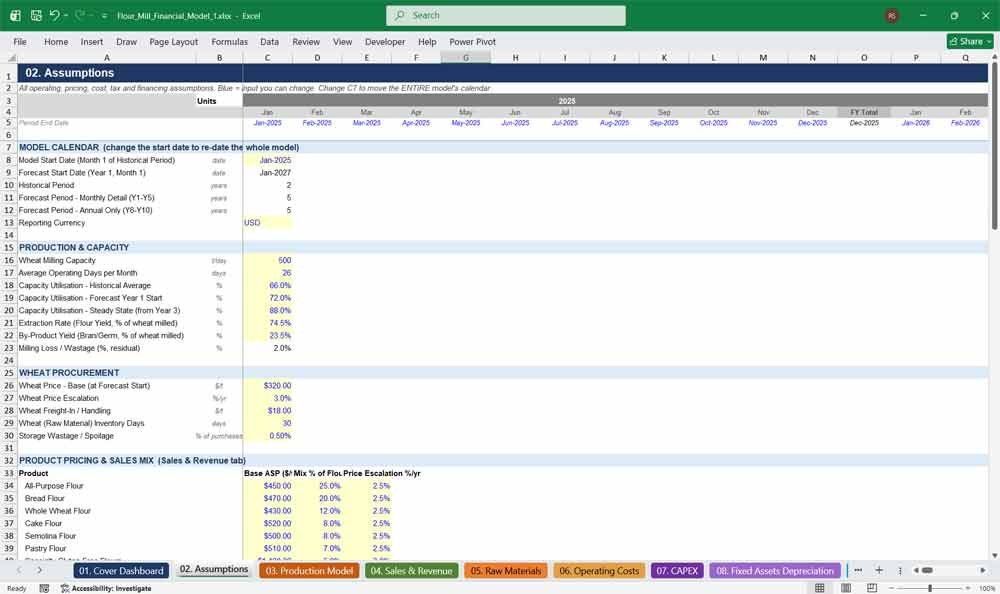
02. Assumptions
The control center of this wheat milling financial model: every pricing, cost, tax, and financing assumption lives here in one editable, color-coded tab. Change the Start Date, wheat price, or loan terms once and the entire template always recalculates instantly.
Highlights:
- Single Model Start Date input re-dates all 18 tabs and every formula instantly
- Editable wheat price, extraction %, capacity, labour, packaging, freight, and admin cost assumptions
- Built-in financing assumptions: debt gearing, interest rate, loan tenor, and grace period
- Live sensitivity toggles for wheat price, flour price, utilisation, yield, FX, energy, and capex
Flour Mill Production & Sales
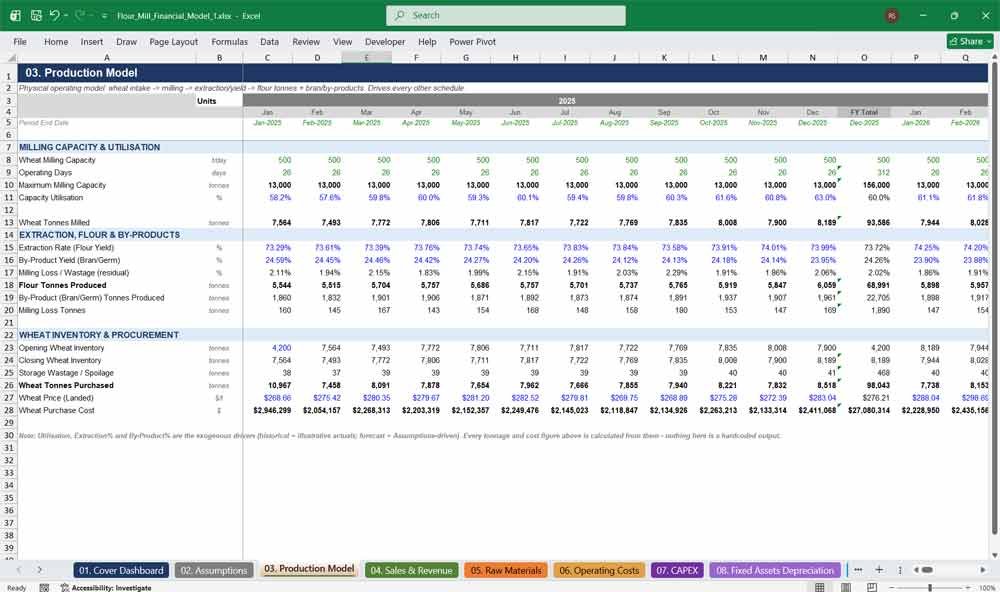
03. Production Model
The physical engine of the flour mill business model: wheat intake, milling capacity, extraction rate, flour output, and bran/by-product yield, calculated before any revenue figure. This operations-first approach gives your financial projections real milling-industry credibility that generic templates can’t match.
Highlights:
- Full wheat-to-flour conversion chain: purchased, milled, extraction %, flour tonnes, by-products, wastage
- Monthly capacity utilisation ramp from startup through steady-state operations
- Complete wheat inventory rollforward with opening/closing balances and storage wastage
- Historical and forecast milling KPIs on one continuous horizontal timeline
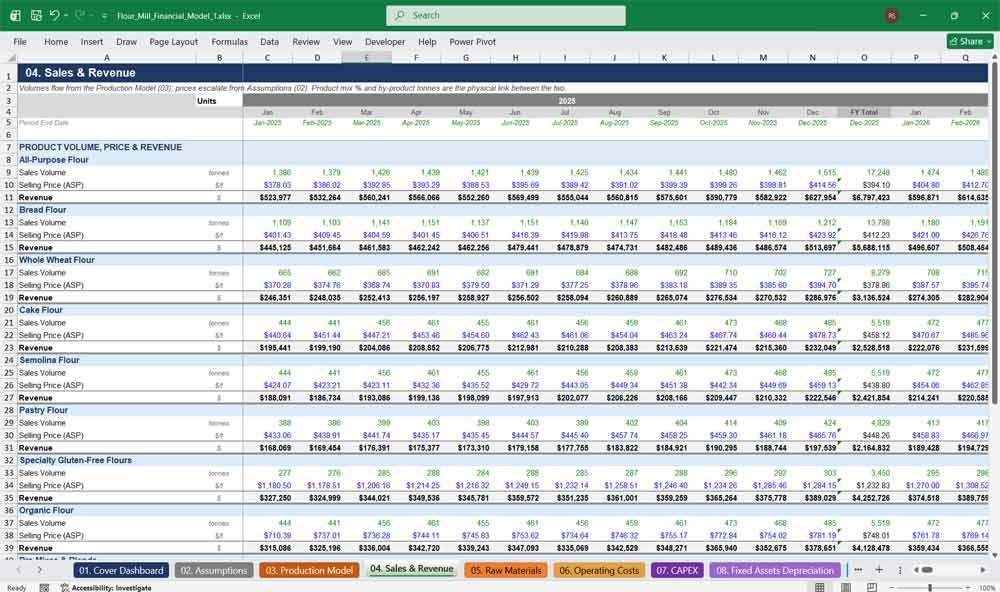
04. Sales & Revenue
A detailed flour mill revenue model covering ten product lines — all-purpose, bread, whole wheat, cake, semolina, pastry, gluten-free, organic, pre-mixes, and wheat bran — each with volume, selling price, and product mix assumptions feeding one consolidated revenue build.
Highlights:
- Ten flour and by-product revenue lines with independent pricing and escalation
- Sales volumes linked directly to the Production Model’s flour output, not guesswork
- Editable product mix percentages and annual price escalation per product
- Built-in reconciliation check between tonnes sold and tonnes produced
05. Raw Materials
A dedicated wheat procurement and inventory costing tab tracking landed wheat cost, freight-in, storage wastage, and raw material inventory valuation month by month — essential detail for any serious flour mill feasibility study or lender due diligence package.
Highlights:
- Full landed wheat cost build-up: ex-mill price plus freight-in and handling
- Monthly raw material inventory valuation at weighted-average cost
- Storage wastage and spoilage tracked separately from production losses
- Feeds directly into COGS, working capital, and accounts payable
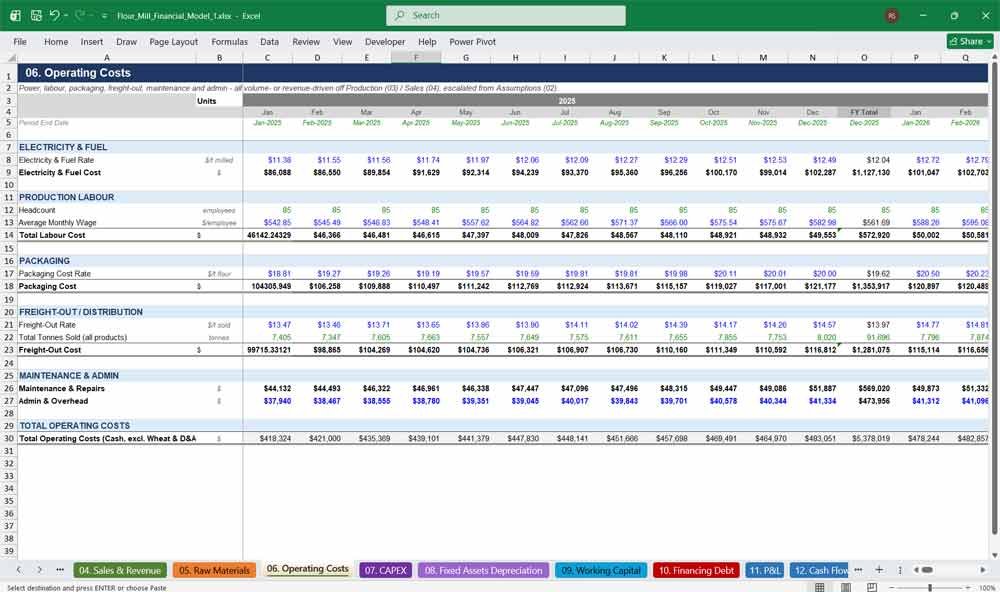
06. Operating Costs
Every major flour mill operating cost modeled with its own driver: electricity per tonne milled, labour headcount and wages, packaging per tonne of flour, freight-out per tonne sold, plus maintenance and admin overhead, all escalating realistically over the ten-year forecast.
Highlights:
- Volume-driven electricity, packaging, and freight-out costs — not flat guesses
- Headcount-based labour costing with independent wage escalation
- Maintenance modeled as a percentage of revenue, admin as an escalating fixed cost
- Consolidated Total Operating Cost line feeding directly into EBITDA
07. CAPEX
A complete flour mill capital expenditure schedule covering land and buildings, new milling units, automated packaging lines, dust control systems, grain handling equipment, HPC infrastructure, backup power, and vehicles, fully phased across the construction period plus ongoing sustaining capex thereafter.
Highlights:
- Eight capex categories matching real flour mill expansion and greenfield projects
- Editable budget inputs for Year 1 and Year 2 of construction
- Automatic installation and commissioning cost calculation on new equipment
- Revenue-linked sustaining capex from Year 3 onward
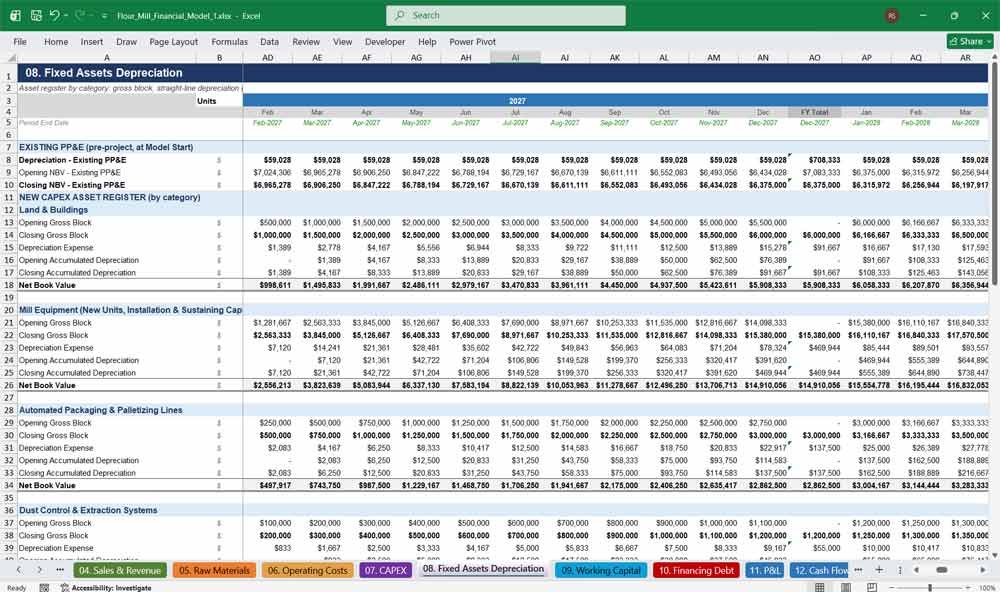
08. Fixed Assets Depreciation
A full fixed asset register and depreciation schedule by category — existing legacy assets plus every new capex line — with useful lives, straight-line depreciation, accumulated depreciation, and net book value all calculated automatically for every period through 2036.
Highlights:
- Separate depreciation tracking for legacy PP&E and each new capex category
- Editable useful lives per asset class, from vehicles to mill equipment
- Automatic gross block, accumulated depreciation, and net book value rollforwards
- Feeds directly into EBIT, tax, and the balance sheet
Flour Mill Financial Statements
09. Working Capital
Receivables, inventory, and payables modeled on realistic day-based policies, converting revenue and cost drivers into a full net working capital and cash conversion cycle analysis — critical detail lenders always look for in any flour mill or manufacturing financial model.
Highlights:
- Days-based accounts receivable, inventory, and accounts payable balances
- Separate raw material and finished goods inventory tracking
- Automatic net working capital and period-over-period change calculation
- Directly feeds the cash flow statement’s operating section
10. Financing Debt
A bankable debt schedule with construction-phase drawdowns, an interest-only grace period, straight-line amortisation, and automatic interest calculation, alongside sponsor equity contributions — exactly the detail a bank or investor expects to see in a flour mill financing package.
Highlights:
- Term loan sized automatically off the capex programme and debt gearing assumption
- Interest-only grace period followed by fully dynamic amortisation
- Editable interest rate, tenor, and grace period assumptions
- Sponsor equity rollforward tracking cumulative paid-in capital
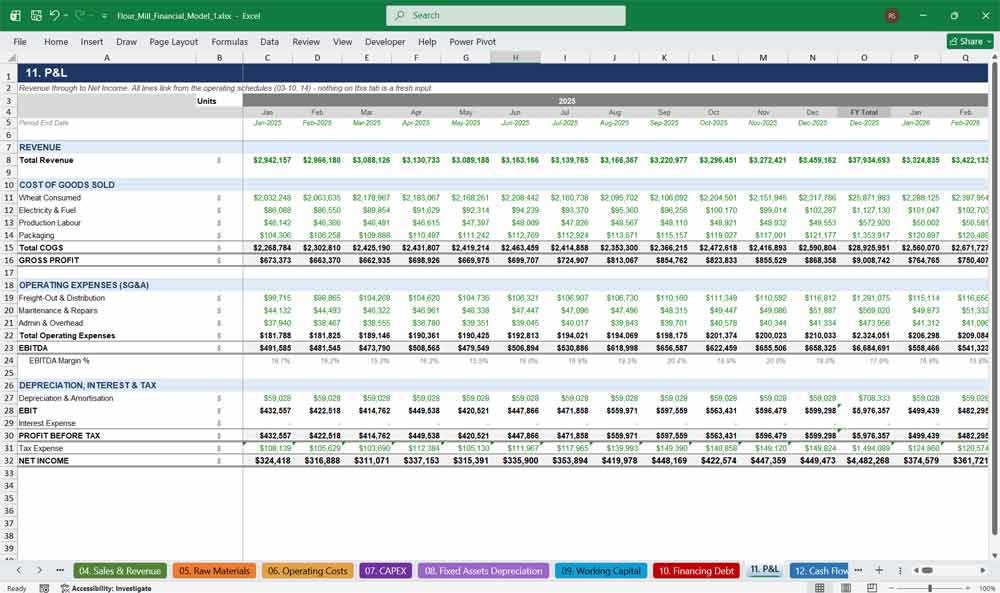
11. P&L
A complete flour mill profit and loss statement running from revenue through gross profit, EBITDA, EBIT, and net income, with every line linked to the underlying operating schedules — no hardcoded numbers, no shortcuts, fully auditable from top to bottom.
Highlights:
- Full revenue-to-net-income build with gross profit and EBITDA margin subtotals
- COGS broken out by wheat, electricity, labour, and packaging
- Operating expenses separated into freight-out, maintenance, and admin
- Every figure traceable back to its source schedule
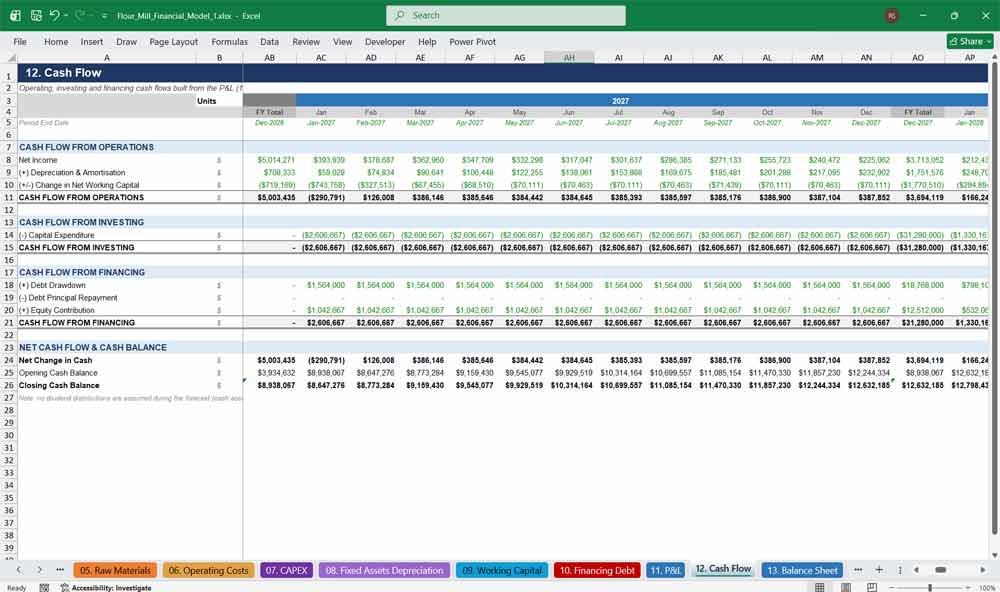
12. Cash Flow
A three-part cash flow statement — operating, investing, and financing — built entirely from the P&L, working capital, capex, and debt schedules, giving you a fully reconciled cash position for every month and year of the flour mill’s ten-year forecast.
Highlights:
- Operating cash flow linking net income, depreciation, and working capital changes
- Investing cash flow tied directly to the capex schedule
- Financing cash flow covering debt drawdowns, repayments, and equity contributions
- Automatic opening and closing cash balance rollforward
13. Balance Sheet
A fully projected flour mill balance sheet — cash, receivables, inventory, fixed assets, payables, debt, and equity — that balances to the cent in every single period from 2025 through 2036, verified automatically by the model’s built-in Checks tab.
Highlights:
- Complete assets, liabilities, and equity structure linked to every supporting schedule
- Retained earnings rollforward tied directly to net income
- Balances to the cent in every historical and forecast period
- Ready for lender or investor due diligence review
14. Tax
A dedicated corporate tax schedule that calculates EBITDA, EBIT, and profit before tax independently, then applies your chosen tax rate with full tax loss carryforward tracking, so early-year losses are properly utilised against future taxable income across the whole forecast.
Highlights:
- Independent EBITDA-to-PBT build used to cross-check the main P&L
- Automatic tax loss carryforward and utilisation tracking
- Editable corporate tax rate assumption
- Clean tax expense feed into net income and cash flow
Key Financial Metrics for a Flour Mill
15. Returns Valuation
The returns tab every investor asks for: Project IRR, Equity IRR, NPV, payback period, and ROIC, calculated from the model’s unlevered free cash flow and financing structure — the exact metrics used to evaluate any flour mill investment opportunity.
Highlights:
- Project IRR and Equity IRR calculated from real cash flow streams
- Payback period with automatic year-by-year cumulative cash flow tracking
- ROIC calculated against invested capital for capital efficiency analysis
- NPV linked directly to the DCF tab’s Enterprise Value
16. Sensitivities
Live, fully-wired sensitivity toggles for wheat price, flour price, capacity utilisation, extraction yield, FX, energy costs, and capex — flex any single driver and watch revenue, EBITDA, IRR, and DSCR recalculate across the entire flour mill model instantly.
Highlights:
- Seven live sensitivity toggles wired directly into every operating schedule
- Instant readout of revenue, EBITDA, Project IRR, and Equity IRR
- First-order impact table quantifying each driver’s effect on EBITDA
- No macros, no plug-ins — pure native Excel formulas
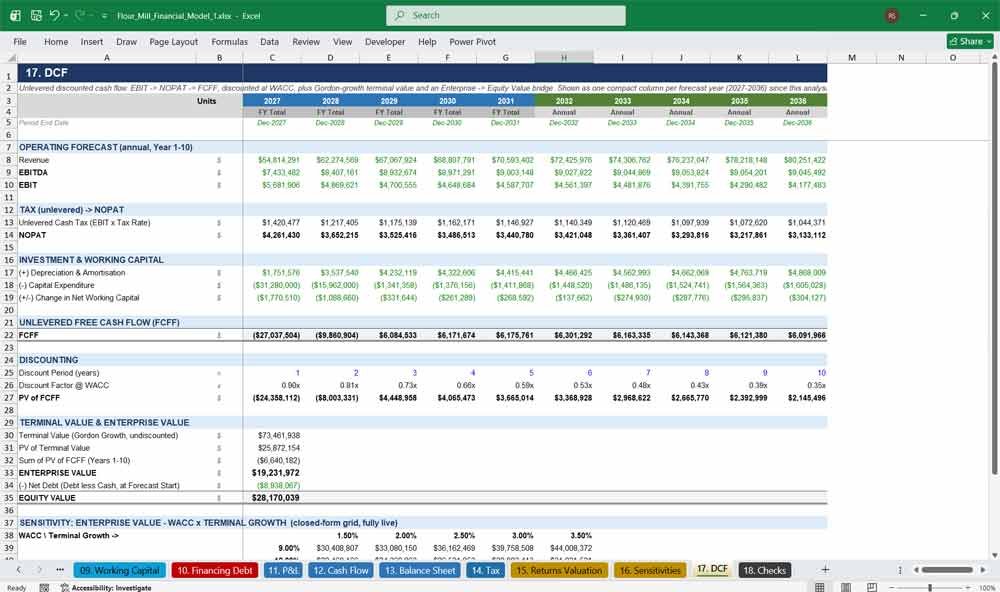
17. Value Your Mill With A DCF
Analysing the Discounted Cash Flow Of Your Flour Mill
A Discounted Cash Flow (DCF) analysis for a flour mill estimates the facility’s value based on projected future cash flows generated from processing wheat into flour and related by-products. Revenue forecasts are driven by milling capacity, utilization rates, flour pricing, by-product sales (such as bran), and regional demand from bakeries and food manufacturers, while costs include wheat procurement, energy, labor, maintenance, and capital expenditures for equipment upgrades. The projected free cash flows over a defined period, along with a terminal value reflecting the mill’s long-term operating life, are discounted to present value to determine the mill’s intrinsic value.
WACC for a Flour Mill
Weighted Average Cost of Capital (WACC) is used as the discount rate in valuing a flour mill and reflects the blended cost of equity and debt financing. The business is influenced by commodity price volatility (particularly wheat), margin pressures, working capital intensity, and competitive dynamics in the food processing industry. The WACC incorporates investors’ required returns, the company’s capital structure, and the tax benefits of debt, representing the minimum return necessary to justify investment in the milling operation.
Sensitivity Analysis for a Flour Mill
Sensitivity analysis is critical in valuing a flour mill due to uncertainties in wheat prices, flour selling prices, demand fluctuations, energy costs, and operating efficiency. Analysts typically test changes in key assumptions such as gross margins, throughput volumes, working capital requirements, capital expenditures, and WACC. By assessing how variations in these inputs affect the DCF valuation, sensitivity analysis identifies the most significant value drivers and provides a range of potential outcomes to support sound financial and operational decision-making.
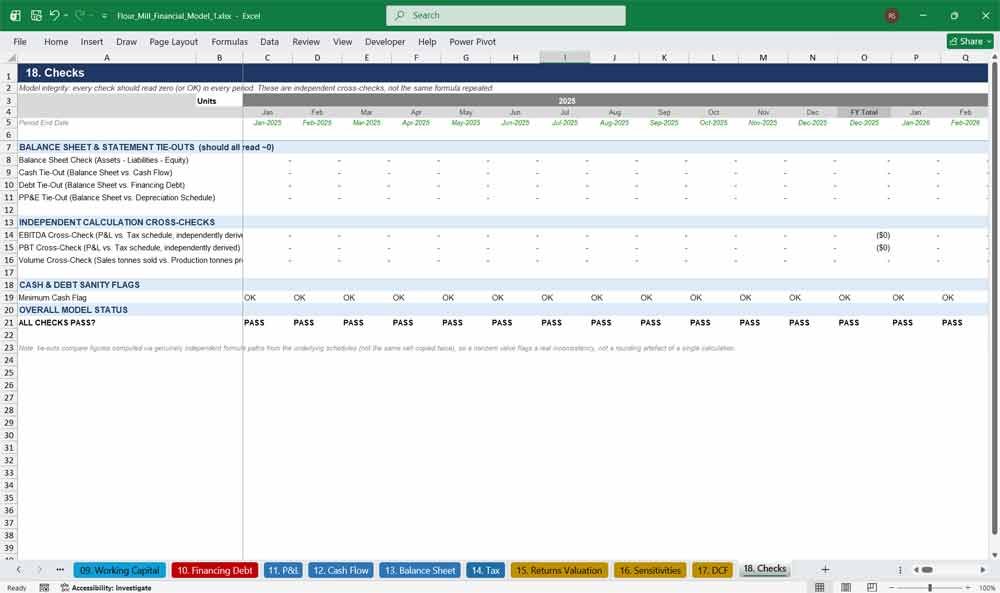
18. Checks
The model integrity tab that gives buyers real confidence: independent balance sheet, cash, debt, and PP&E tie-outs, plus cross-checked EBITDA and profit-before-tax calculations, confirming every one of this flour mill model’s 24,000-plus formulas genuinely ties out correctly.
Highlights:
- Balance sheet check confirming assets equal liabilities plus equity every period
- Independent cash, debt, and fixed asset tie-outs across all 18 tabs
- Cross-validated EBITDA and PBT calculated two different ways
- Clear PASS/REVIEW flag for instant model-wide quality assurance
Flour Milling Frequently sked Questions (Faq)
Q: Is this flour mill financial model fully editable, or is it locked?
A: It’s completely unlocked and editable. Every input cell is color-coded in blue so you always know exactly what you can change — wheat prices, capacity, financing terms, tax rates, and more — without breaking any formulas.
Q: Can I change the start date, or is the model fixed to 2025–2036?
A: Yes. There’s a single Model Start Date input in the Assumptions tab. Change it once and every date across all 18 tabs — monthly, annual, historical, and forecast — automatically re-dates itself.
Q: Do I need to know how to build financial models to use this?
A: No. The model is fully built and pre-linked, with clearly labeled sections, a legend explaining the color-coding, and a Cover Dashboard summarizing the key outputs. You only need to enter your own assumptions where relevant.
Q: What currency does the model use, and can I change it?
A: The model is built in USD with standard financial formatting. Because every cost and price is driven from a single input cell, you can adapt the figures to another currency by updating the relevant assumptions.
Q: Will this work for a bank loan application or investor pitch?
A: Yes. The model was built specifically with lender and investor requirements in mind — DSCR, debt schedules, IRR, NPV, and a fully reconciled three-statement model with a built-in Checks tab to prove integrity.
Q: Does the model include historical financials, or only projections?
A: Both. It includes two years of illustrative historical monthly detail feeding directly into five years of monthly forecasts and five years of annual forecasts, so you can see trend continuity from history into the plan.
Q: Can I adjust the mill’s size, capacity, or product mix?
A: Absolutely. Capacity, utilisation, extraction rate, and product mix are all editable assumptions. The model was built around a large-scale mill but flexes to small, medium, or large operations by changing the capacity input.
Q: Does it include sensitivity or scenario analysis?
A: Yes. The Sensitivities tab has seven live toggles — wheat price, flour price, utilisation, yield, FX, energy cost, and capex — that flex the entire model in real time, plus a first-order impact table and a full WACC/terminal-growth DCF sensitivity grid.
Q: What version of Excel do I need?
A: The model uses standard, widely supported Excel functions (no volatile or unsupported array functions), so it works in any modern version of Excel. It has also been tested to recalculate cleanly and error-free.
Q: How do I know the numbers actually tie out correctly?
A: The dedicated Checks tab independently verifies the balance sheet, cash flow, debt schedule, and fixed assets in every single period, plus cross-checks EBITDA and profit before tax using two separate calculation paths — so you’re not just trusting one formula chain.
Q: Can I use this for a mill expansion instead of a new greenfield project?
A: Yes. The CAPEX and Depreciation tabs already separate “existing” legacy assets from “new” capex spending, so the model works equally well for an expansion, a line upgrade, or a full new-build project.
Final Notes on the Financial Model
This 10 Year Flour Mill Financial Model Template focuses on balancing capital expenditures with steady revenue growth from diversified services. By optimizing operational costs, and power efficiency, and maximizing high-margin services, the model helps long-term sustainable profitability and cash flow stability.
Download Link On Next Page