
Events Venue Financial Model Template
This Events Venue Financial Model is a complete Excel template for anyone planning, buying, financing or running a wedding venue, conference centre or multi-space events venue. It covers 10 years month by month, with an annual total for every year. It builds revenue event by event, from weddings, corporate events, conferences, private parties, Christmas parties, product launches, awards ceremonies and charity events. The results feed a fully linked P&L, cash flow statement and balance sheet. You can use it to write a venue business plan, prepare a bank loan application or pitch to investors, and every number traces back to an assumption you can see and change.
Financial Model for an Events Venue
Unlike a basic venue budget template, this model starts with how your venue actually works. You set up your event spaces, seated, standing, theatre and banquet capacities, operating days, maintenance closures and seasonal demand. The model then turns those into available event slots and checks every month’s bookings against real capacity. Pricing covers venue hire, food and beverage per guest, AV and production, accommodation, decoration, entertainment, parking and other extras, with price escalation and peak and off-peak multipliers. Staffing, event-day labour, operating costs, working capital, customer deposits and capital expenditure are all modelled in detail.
The template is built to lender and investor standards. It uses a single master start date, so changing one cell re-dates the whole model. Inputs, formulas and links from other tabs are colour-coded. The balance sheet balances every month, and a dedicated checks tab confirms that everything ties out. Debt financing, refinancing, a revolving credit facility, DSCR covenants, equity IRR, MOIC, NPV, exit valuation, Base, Upside and Downside scenarios, and sensitivity tables are all included. The result is a professional events venue financial projection you can put in front of a bank, a buyer or a board with confidence.
What’s Inside: Tab-by-Tab Overview
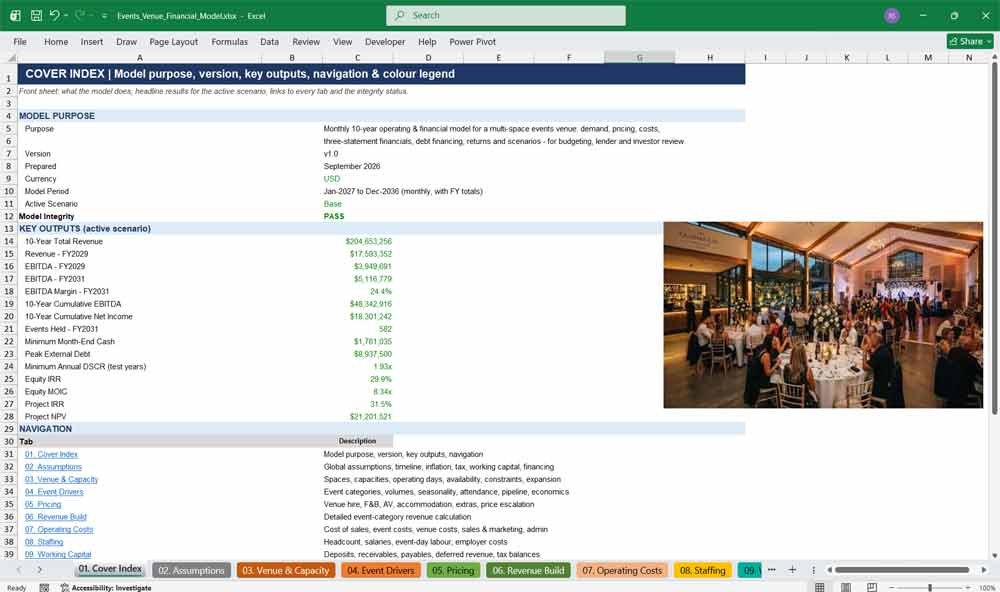
01. Cover Index
The Cover Index is your events venue model’s front page. It shows the model’s purpose, version, currency, model period and active scenario. Headline results such as revenue, EBITDA, equity IRR, MOIC, NPV and DSCR sit next to one-click navigation to every tab.
- Headline results update live for the active scenario
- Clickable links to all 17 tabs
- Model integrity status (PASS / REVIEW) at a glance
- Colour legend: inputs, formulas and links
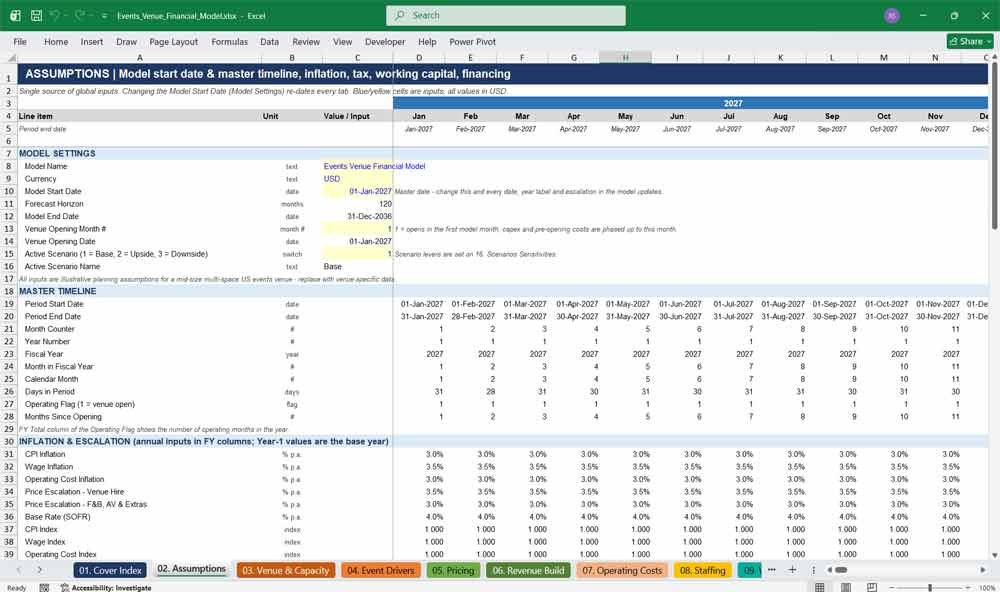
02. Assumptions
The Assumptions tab holds every global input for your venue financial forecast. This covers the master start date, opening month, scenario switch, inflation, wage and price escalation, the SOFR base rate, tax, working capital, debt terms, equity, dividends, exit multiple and discount rate.
- One start date re-dates the entire 10-year model
- Year-by-year inflation, wage, cost and price escalation inputs
- Sources & Uses of funds with a built-in check
- Scenario selector: Base, Upside, Downside
Events Venue Operating Revenues
03. Venue & Capacity
Venue & Capacity sets out the physical venue. It covers six event spaces with floor area and seated, standing, theatre and banquet capacity, plus closed, maintenance and private-hire days, seasonality, venue constraints and a planned expansion. It then calculates the realistic number of events you can sell each month.
- Event space inventory with 15 attributes per space
- Available event days and slots, by calendar month
- Peak, shoulder and off-peak capacity percentages
- Expansion timing, added capacity and expansion capex
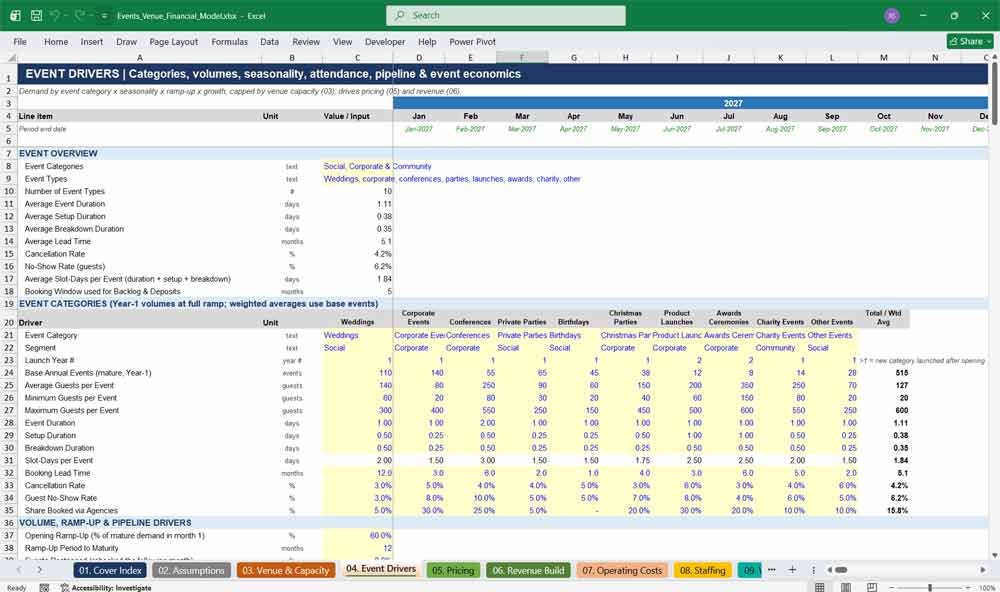
04. Event Drivers
Event Drivers forecasts demand for ten event categories, including weddings, corporate events and conferences. It applies monthly seasonality, a ramp-up after opening, volume growth and cancellations. The tab also covers postponements, the booking backlog, the enquiry-to-contract pipeline, attendance, utilisation and per-event economics, all capped by venue capacity.
- Seasonality profile for each category, by calendar month
- Events booked, held, cancelled, postponed and rebooked
- Enquiry → proposal → contract booking funnel
- Contribution margin and EBITDA per event
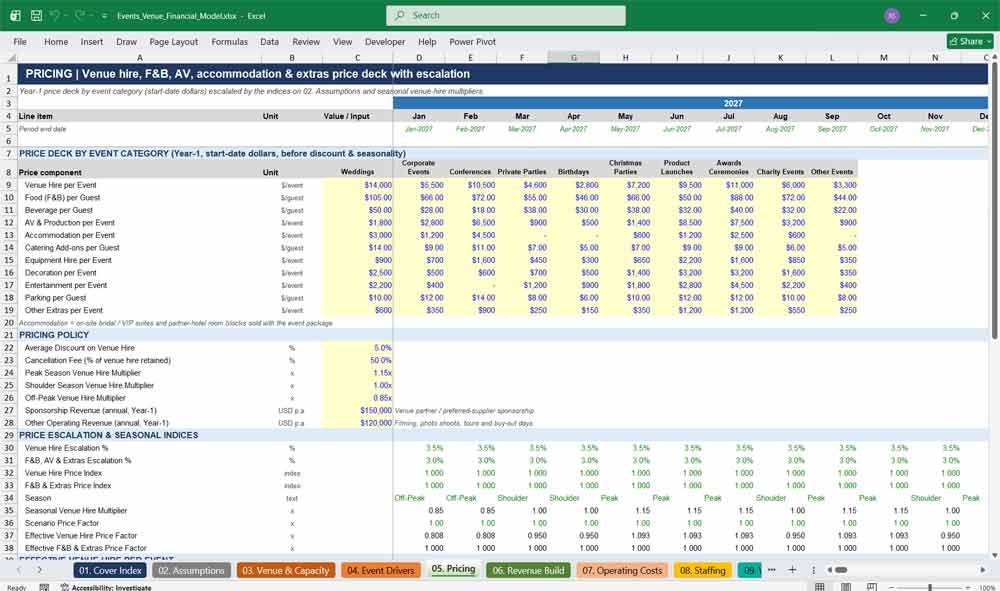
05. Pricing
The Pricing tab holds a full price list for each event category. It covers venue hire, food and beverage per guest, AV and production, accommodation, catering add-ons, equipment hire, decoration, entertainment, parking and extras. Prices escalate each year, and venue hire flexes with peak, shoulder and off-peak seasonal multipliers.
- Year-1 price list across 10 event categories
- Separate escalation for venue hire and for F&B and extras
- Seasonal multipliers and an average discount
- Sponsorship and other operating revenue
06. Revenue Build
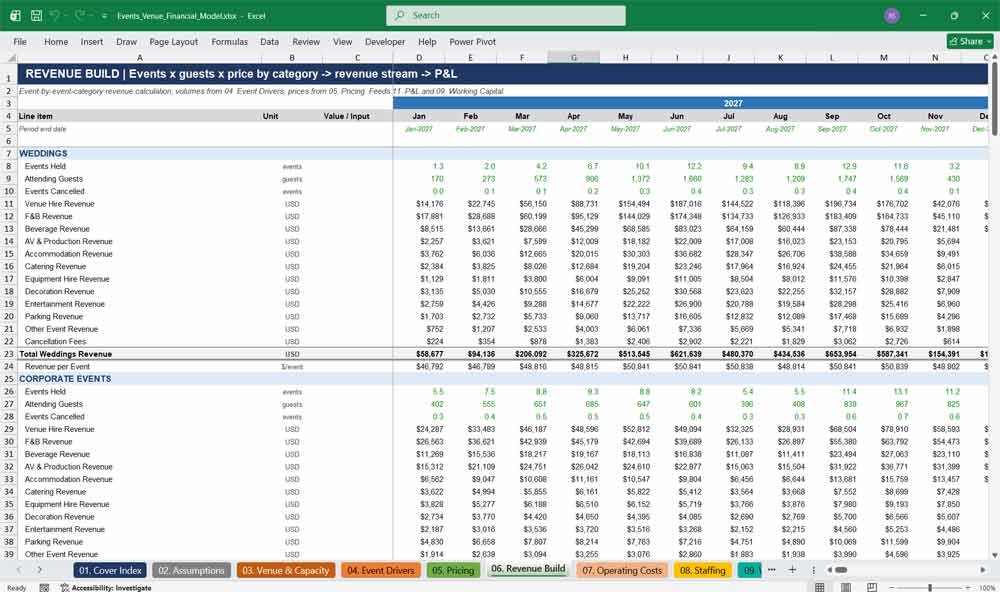
Revenue Build works out income category by category: events held × guests × price for every revenue stream. It includes cancellation fees, sponsorship and non-event income. The results roll up into revenue by stream and revenue by event type, with a check that proves both totals agree.
- 12 revenue streams for each event category
- Revenue by stream and by event type
- Revenue per event and per guest KPIs
- Built-in check that the two revenue views agree
07. Operating Costs
Operating Costs covers cost of sales as a percentage of each revenue stream. It also includes per-event and per-guest costs such as security, cleaning, setup, linen and commissions. Fixed venue costs, sales and marketing, and administration are entered in Year-1 dollars and escalate with inflation.
- Food and beverage cost percentages and other direct costs
- Event operating costs driven by events and guests
- Rent with fixed lease escalation, utilities and insurance
- Sales & marketing and admin cost lines
08. Staffing
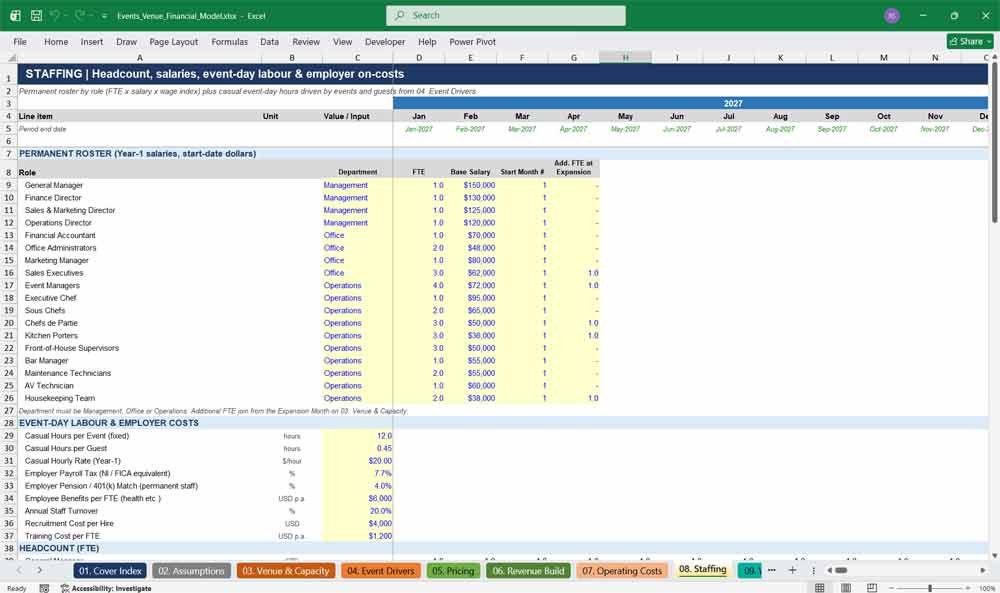
Staffing builds a full permanent staff list by role and department, with FTEs, salaries, start dates and extra hires at expansion. Casual event-day labour is driven by events and guests. Employer payroll tax, pension, benefits, recruitment and training complete the payroll forecast.
- 18 roles across Management, Office and Operations
- Casual labour hours linked to event volume
- Employer on-costs, recruitment and training
- Staff cost as a percentage of revenue
09. Working Capital
Working Capital models the cash timing of an events business. Customer deposits and pre-event balance payments are calculated from future booked revenue. The tab also covers receivables, inventory, prepayments, payables, accruals, payroll taxes, sales tax and corporation tax payable.
- Deposits based on the booking lead time
- Deferred revenue from pre-event balance payments
- Cash impact of every working capital item
- Net working capital shown as a percentage of revenue
10. Capex Fixed Assets
Capex Fixed Assets plans the initial fit-out: venue, event spaces, furniture, kitchen, AV, IT, vehicles and intangibles. It also covers maintenance capex, a mid-life refurbishment and expansion capex. Each asset class is depreciated straight-line by the month it was bought, over its useful life.
- Capex mapped to cash flow lines and balance sheet asset classes
- Useful lives set for each asset class
- Gross cost, accumulated depreciation and net book value
- Check that asset additions equal capex
Events Venue Financial Statements
11. P&L
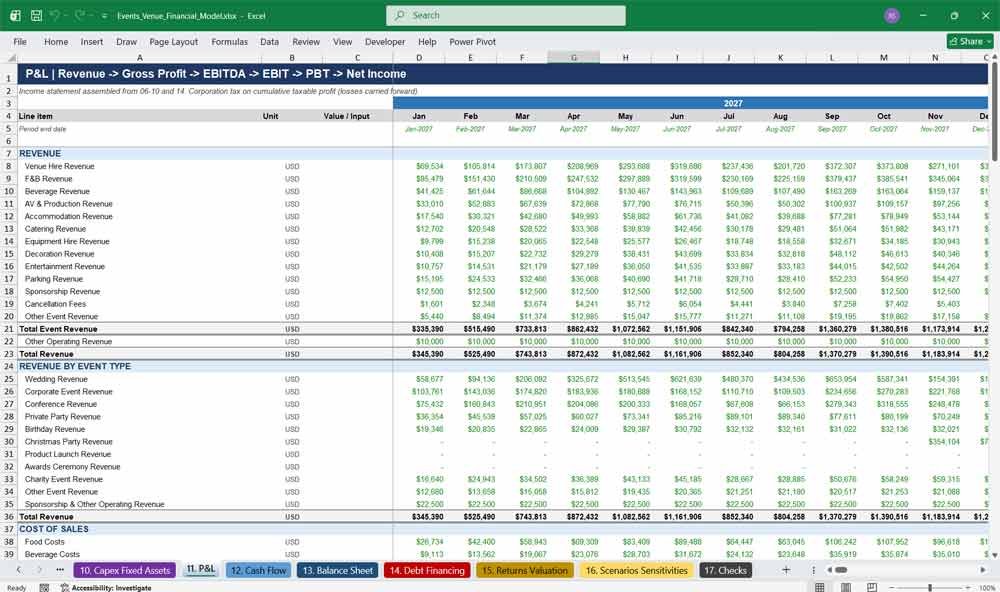
The P&L takes revenue through gross profit, EBITDA, EBIT and profit before tax down to net income. It includes revenue by event type, cost of sales, event and venue operating costs, sales and marketing, administration and payroll. Tax is calculated with losses carried forward.
- Revenue broken down by stream and by event type
- EBITDA margin, EBITDA per event and per guest
- Key metrics: staff cost %, F&B cost % and net margin
- Profit before tax calculated two ways and reconciled
12. Cash Flow
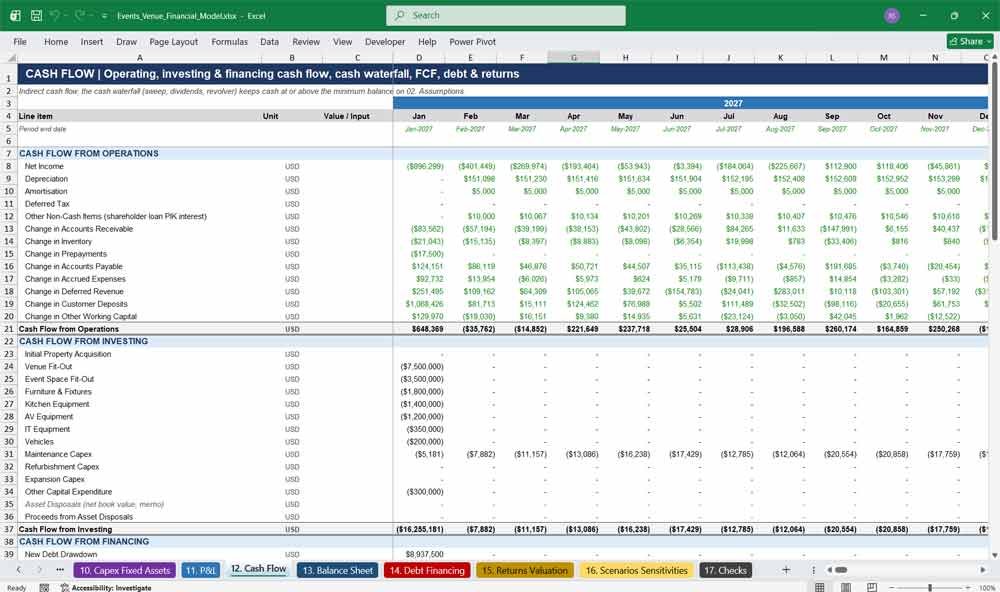
The Cash Flow tab shows operating, investing and financing cash flows using the indirect method. A cash waterfall applies an optional cash sweep, then dividends, then the revolving credit facility, keeping cash above your chosen minimum balance.
- Cash flow from operations, investing and financing
- Free, levered and unlevered free cash flow
- Debt & liquidity section with DSCR and excess cash
- Equity cash flows, IRR and MOIC
13. Balance Sheet
The Balance Sheet shows current and non-current assets, current and non-current liabilities, and equity for every month and year-end. Customer deposits, deferred revenue, the current portion of debt, retained earnings and dividends are all tracked, with a balance check for every period.
- Fixed assets by class at gross cost, less accumulated depreciation
- Current portion of debt worked out from the next 12 months’ repayments
- Balances in every month
- Current ratio, quick ratio, net debt / EBITDA and gearing
14. Debt Financing
Debt Financing models a senior term loan with a grace period and amortisation, an optional refinancing facility and a revolving credit facility with commitment fees. It also covers a PIK shareholder loan, interest, arrangement fees and an annual DSCR covenant test.
- Term loan drawdown, repayments and cash sweep
- Refinancing switch, month and new margin
- Revolver draws and repayments tied to minimum cash
- DSCR, covenant PASS / BREACH and leverage
Events Venue Key Metrics and Ratios
15. Returns Valuation
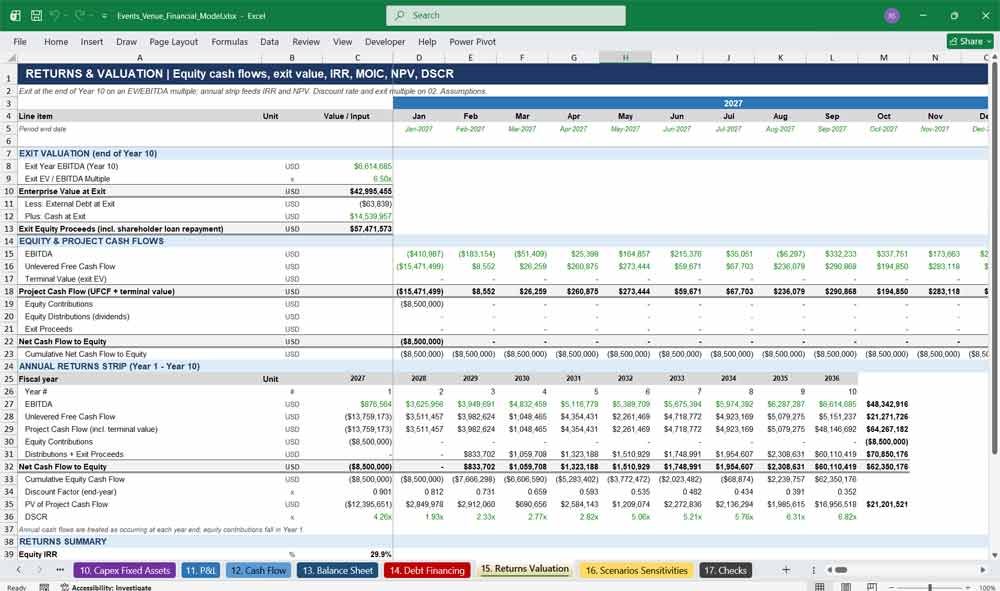
Returns Valuation calculates the exit value on an EV/EBITDA multiple at the end of Year 10. It also covers equity contributions and distributions, equity IRR, MOIC, project IRR, NPV at your discount rate, payback year and the minimum and average DSCR.
- Exit enterprise value and exit equity proceeds
- Annual returns summary for IRR and NPV
- Equity IRR, MOIC and project IRR
- Equity payback and DSCR summary
16. Scenarios Sensitivities
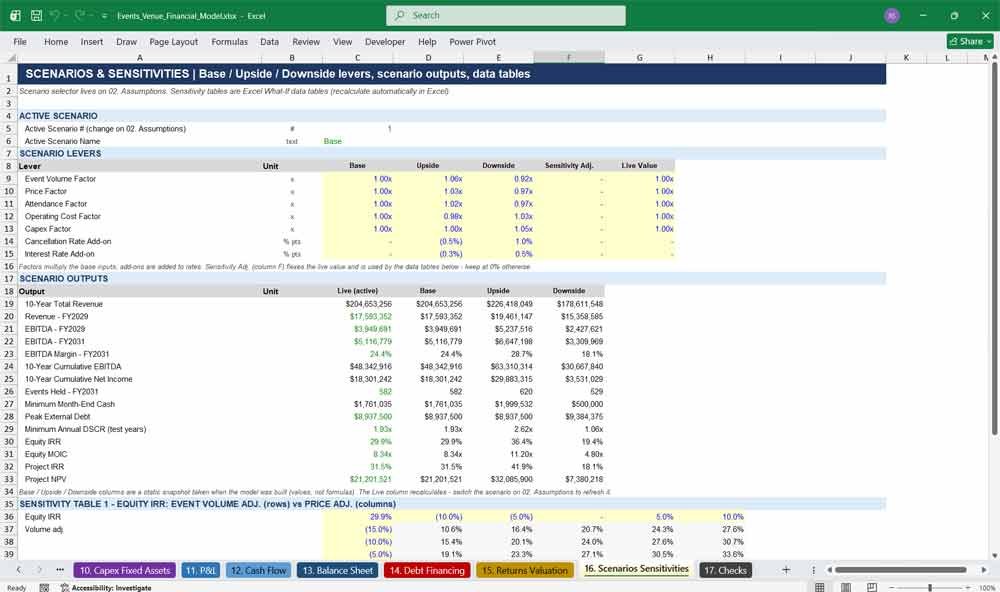
Scenarios Sensitivities compares Base, Upside and Downside cases using levers for volume, price, attendance, costs, capex, cancellations and interest rates. It shows scenario outputs side by side. Two Excel data tables flex equity IRR and project NPV against event volume, price and cost changes.
- Seven scenario levers in one table
- Live scenario output plus a snapshot of all three cases
- Equity IRR sensitivity table: volume vs price
- Project NPV sensitivity table: volume vs operating cost
17. Checks
The Checks tab tests model integrity every month and every year. It confirms the balance sheet balances, cash reconciles, revenue ties out, profit before tax agrees both ways, debt stays positive, cash never goes negative and bookings stay within capacity. It then shows PASS or REVIEW.
- 12 automated integrity checks
- PASS / REVIEW status for every period
- Overall model status shown on the Cover
- Lets reviewers and lenders confirm the model ties out
Why Buy This Model
Building a lender-ready events venue financial model from scratch takes weeks, and one broken link can undermine your whole business case. This template gives you a proven structure straight away. Venue capacity, event demand, pricing, staffing, working capital, capex, debt and returns are all fully linked in one colour-coded workbook, with monthly detail and an annual summary for every year. You enter your own spaces, prices and costs, and the P&L, cash flow and balance sheet update instantly. Integrity checks confirm everything still ties out. Whether you’re opening a new wedding venue, buying an existing events business, refinancing, or presenting to investors, you get a credible, fully auditable 10-year forecast. It shows lenders your DSCR, shows investors their IRR and MOIC, and shows you exactly how many events you need to sell to succeed.
Events Venue Frequently Asked Questions (Faq)
I’m opening a wedding venue, not a conference centre. Will this model work for me?
Yes. The model covers ten event categories, including weddings, and each has its own volumes, guest numbers, seasonality and pricing. If you only host weddings and private parties, set the other categories’ base events to zero and the rest of the model adjusts automatically.
My venue opens in a different year. Can I change the timeline?
Yes. Change the Model Start Date on the Assumptions tab and every date, month label, year heading, seasonality pattern and escalation updates across all 17 tabs. You can also set a later opening month, and capex and pre-opening costs are phased up to it.
Is the model monthly or annual?
Both. It runs for 120 months (10 years), with an FY Total column after each year. Months are grouped by year, so you can collapse them to see only the annual figures.
Will a bank accept this model for a loan application?
The model follows the conventions lenders expect: colour-coded inputs, a linked P&L, cash flow statement and balance sheet, an annual DSCR covenant test, a Sources & Uses table and automated integrity checks. You’ll still need to replace the illustrative assumptions with your own researched figures.
Are the numbers in the template real market data?
No. The model comes loaded with illustrative assumptions for a mid-size, multi-space venue so you can see how it works. Every assumption is a blue input cell, so you can replace it with your own quotes, market research and pricing.
How many event spaces can I model?
The Venue & Capacity tab has six event spaces, each with floor area, several capacity layouts, available days, setup and breakdown time, concurrent events and a utilisation target. You can rename them and change the details to match your venue.
Does the model handle customer deposits?
Yes. Deposits are calculated as a percentage of future booked revenue over your booking lead time, and pre-event balance payments are held as deferred revenue. This shows the positive working capital cash flow typical of events businesses.
Can I model an expansion, such as adding a marquee or new event space?
Yes. Set the expansion month, extra capacity, number of new spaces and expansion capex. The model adds event slots, lifts demand, adds staff and capitalises the investment from that month onwards.
What financing options are included?
A senior term loan with a grace period and amortisation, an optional refinancing facility, a revolving credit facility, sponsor equity and a shareholder loan with PIK interest. Dividends, an optional cash sweep and a minimum cash balance are also built in.
Can I test best-case and worst-case scenarios?
Yes. Choose Base, Upside or Downside with one switch. Each scenario flexes event volume, pricing, attendance, operating costs, capex, cancellation rates and interest rates. Two sensitivity tables show how equity IRR and project NPV change with volume, price and cost.
Does it calculate IRR, NPV and exit value?
Yes. The Returns Valuation tab calculates exit enterprise value on an EV/EBITDA multiple, exit equity proceeds, equity IRR, MOIC, project IRR, NPV at your chosen discount rate and the equity payback year.
Does the model contain macros or VBA?
No. It uses standard Excel formulas only. The sensitivity tables use Excel’s built-in What-If data tables.
Can I use it in Google Sheets or Apple Numbers?
The model is built for Microsoft Excel. Most formulas will work in other spreadsheet programs, but the What-If sensitivity tables and some formatting are designed for Excel and may not work the same way elsewhere.
The model is in USD. Can I use another currency?
Yes. Change the currency label on the Assumptions tab and enter your prices and costs in your own currency. The calculations work in any currency. Only the “$” symbol in the number formats would need updating.
How do I know the model is working correctly after I change the inputs?
The Checks tab runs 12 integrity tests every month and every year, including balance sheet balance, cash reconciliation, revenue tie-out, capacity limits and non-negative cash. The overall PASS / REVIEW status is shown on the Cover Index.
Can I edit the formulas and structure?
Yes. The workbook is fully unlocked. Blue cells on yellow are inputs, black cells are formulas and green cells are links from other tabs, so you can easily see what is safe to change.
Conclusion
This financial model offers a comprehensive structure to manage the event venue’s profitability, cash flow, and long-term sustainability. With subscription packages for Birthday Parties, Corporate Events, Weddings, and Music Events, the venue can stabilize revenue while increasing operational efficiency. Monitoring key metrics ensures healthy growth and liquidity for ongoing operations.