
Desalination Plant Financial Model Template
The Desalination Plant Financial Model is a professional, lender-ready Excel project finance model built for seawater reverse osmosis (SWRO) desalination plants. It covers the full project lifecycle: a three-year monthly construction period followed by a 25-year operating period. Operating years 1–5 are modelled monthly with annual roll-up columns, and years 6–25 annually. Developers, investors, lenders, consultants and utilities can use it to assess the bankability, returns and cost of water of a new desalination project, all in USD with horizontal year-by-year timelines.
Financial Model for a Desalination Plant
At the heart of the model is a transparent water production engine: nameplate capacity × availability × utilization × operating days. It then adjusts for start-up losses, ramp-up, capacity degradation, RO recovery rate, feedwater volume, process water and losses. Electricity, the single largest operating cost in reverse osmosis desalination, has its own dedicated calculation: water produced × specific energy consumption (kWh/m³) × electricity price. It includes energy-price escalation, grid supply, a renewable Power Purchase Agreement (PPA) option, on-site solar, demand charges and carbon costs. Revenue follows a Water Purchase Agreement (WPA) tariff, with capacity, availability, variable, take-or-pay and merchant water components.
The model is fully integrated across 23 colour-coded tabs. It contains more than 100,000 live formulas, a fully linked income statement, cash flow and balance sheet, and a balance check that balances in every period. Change the start date and every date, label and escalation index updates automatically. Financing outputs include a debt schedule with interest during construction, a DSRA, an operating reserve and a major maintenance reserve. Valuation outputs include project and equity IRR, NPV, MOIC, DSCR, LLCR, a DCF valuation, the levelised cost of water (LCOW), scenario analysis and live sensitivity tables.
What’s Inside: Tab-by-Tab Guide
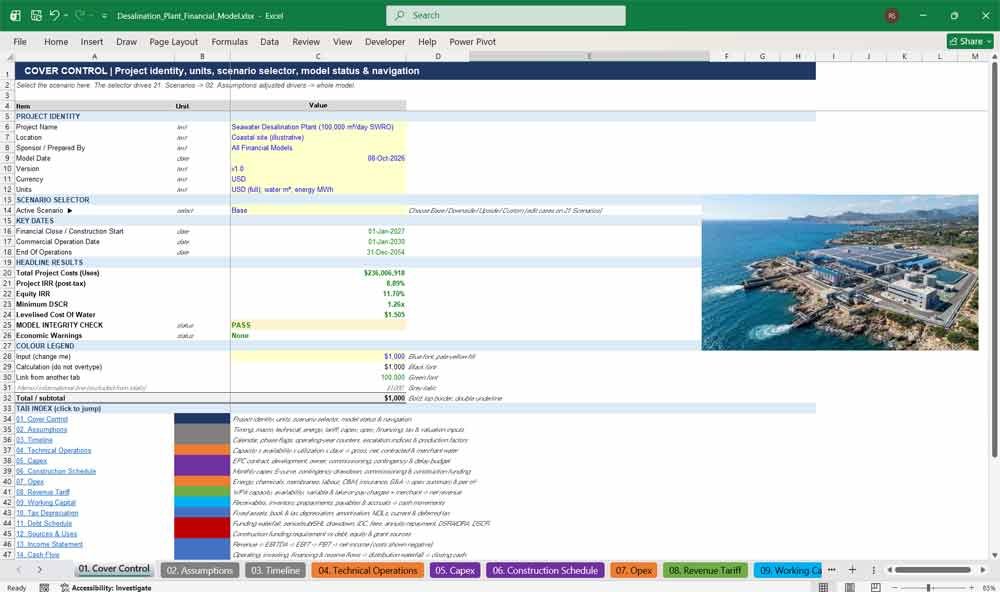
01. Cover Control
The Cover Control tab is the command centre of the desalination financial model. It records the project name, model date, version, currency and units, and holds the scenario selector. It also shows headline results, the integrity status and a clickable navigation index.
- One-click scenario selector: Base, Downside, Upside or Custom
- Headline project IRR, equity IRR, minimum DSCR and levelised cost of water
- Live model integrity check (PASS / REVIEW) and economic warnings
- Colour legend and hyperlinked tab index for fast navigation
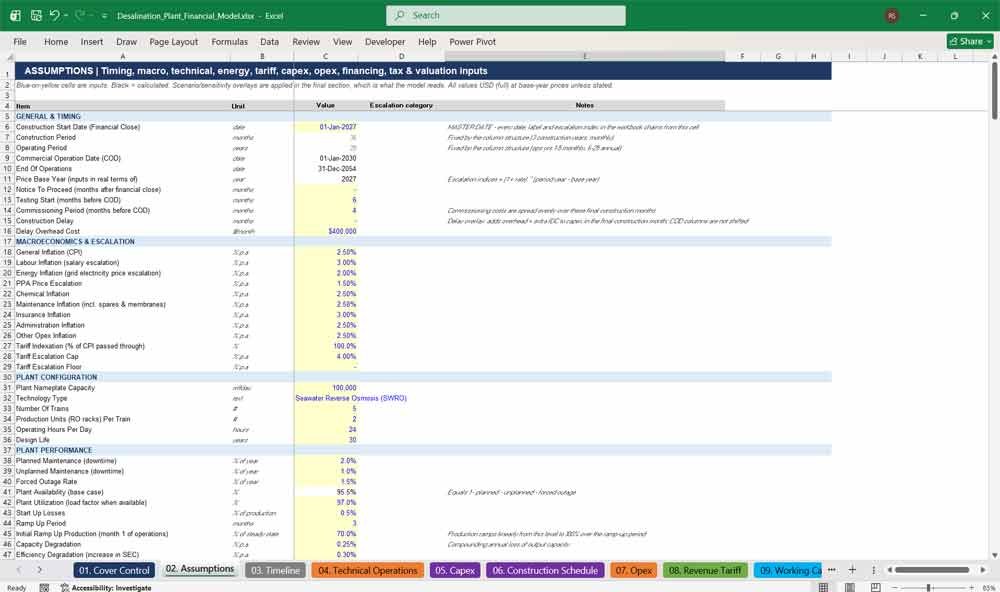
02. Assumptions
The Assumptions tab holds every input that drives the desalination plant model: timing, macroeconomics, plant performance, feedwater, electricity, tariff, capex, opex, financing, tax and valuation. Inputs are clearly colour-coded, so you can tailor the model to any SWRO project quickly.
- One master start date drives every date in the workbook
- Separate inflation rates for labour, energy, chemicals, maintenance, insurance and administration
- Escalation category drop-downs for every fixed cost line
- Scenario- and sensitivity-adjusted drivers that the model reads automatically
Desalination Plant Opex & Capex
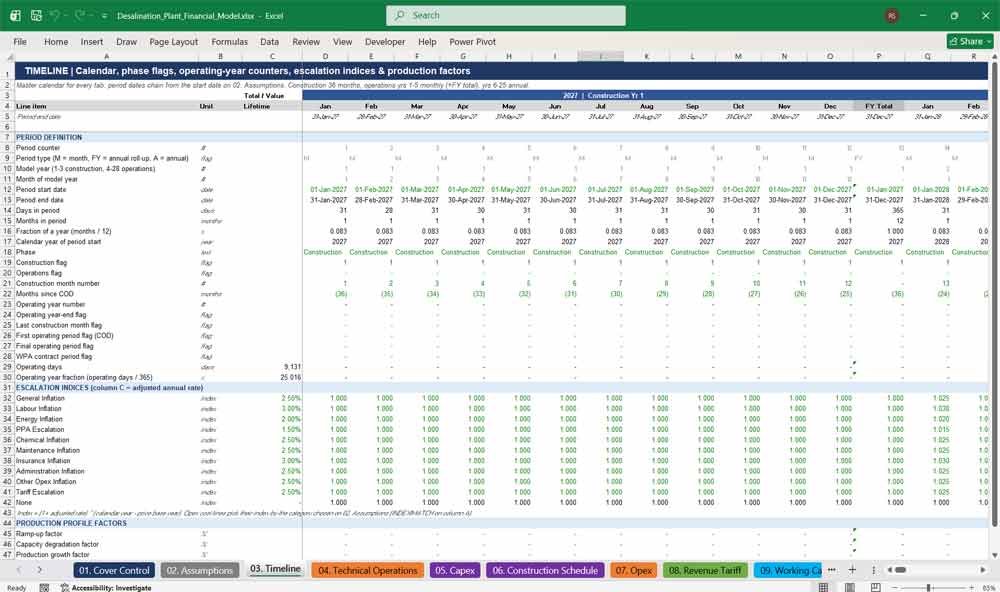
03. Timeline
The Timeline tab is the master calendar for the desalination project. It builds 36 construction months, operating years 1–5 monthly with annual roll-ups, and years 6–25 annually. Phase flags, operating-year counters and escalation indices are all formula-driven from the start date.
- Construction, operations, COD, contract and final-period flags
- Operating days and year-fraction counters for monthly and annual columns
- Ten escalation indices with caps and floors on the tariff
- Ramp-up, degradation and major-maintenance cycle factors
04. Technical Operations
The Technical Operations tab models desalinated water production. It starts from nameplate capacity, availability, utilization and operating days, then calculates feedwater intake, RO recovery, brine, net production, contracted and merchant volumes, and electricity consumption for the reverse osmosis plant.
- Gross production = capacity × availability × utilization × operating days
- Feedwater, pretreatment and RO recovery, backwash and brine volumes
- Contracted, take-or-pay, delivered-to-offtaker and merchant water volumes
- Electricity consumption split between grid, PPA and on-site renewables, plus CO₂ emissions
05. Capex
The Capex tab sets out the full capital cost budget for the desalination plant. It covers each EPC component, development costs, owner’s costs, commissioning, contingency and construction delays. A scenario adjustment flows through to an effective budget, with % of total and $ per m³/day metrics.
- EPC breakdown: intake, outfall, pretreatment, RO trains, product water, storage and utilities
- Engineering, procurement and construction classification
- Contingency allowance and construction-delay overlay
- Total project capex, before and after financing costs
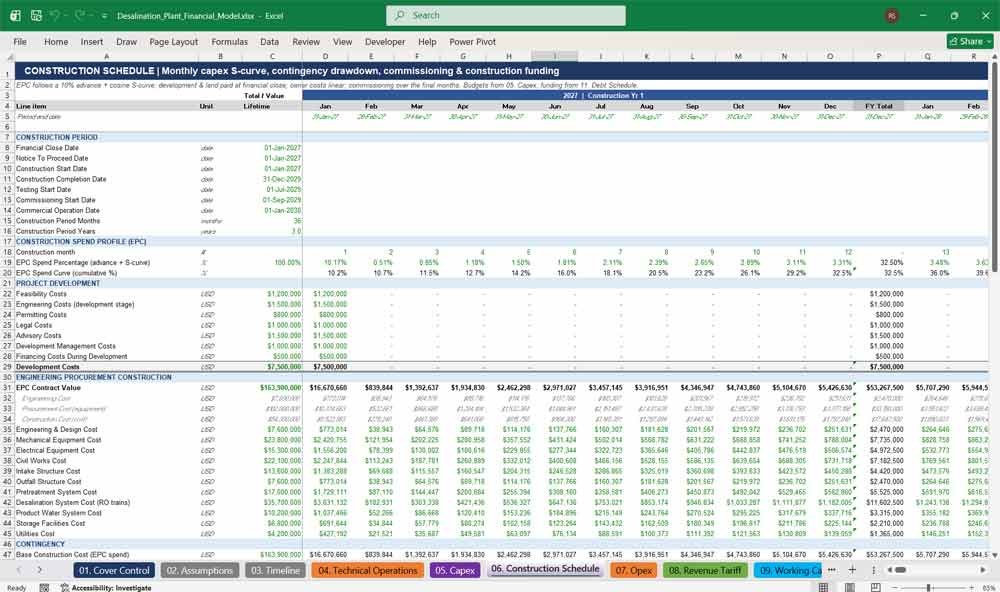
06. Construction Schedule
The Construction Schedule tab spreads desalination capex month by month across the three-year build. It uses an EPC advance payment and an S-curve, and tracks contingency drawdown, owner’s costs, commissioning, construction financing and all key construction dates.
- Financial close, NTP, testing, commissioning and COD dates
- Cosine S-curve EPC spend with cumulative and remaining spend
- Commissioning completion %, initial chemicals and spare parts
- Construction debt, equity, capitalised interest and financing fees
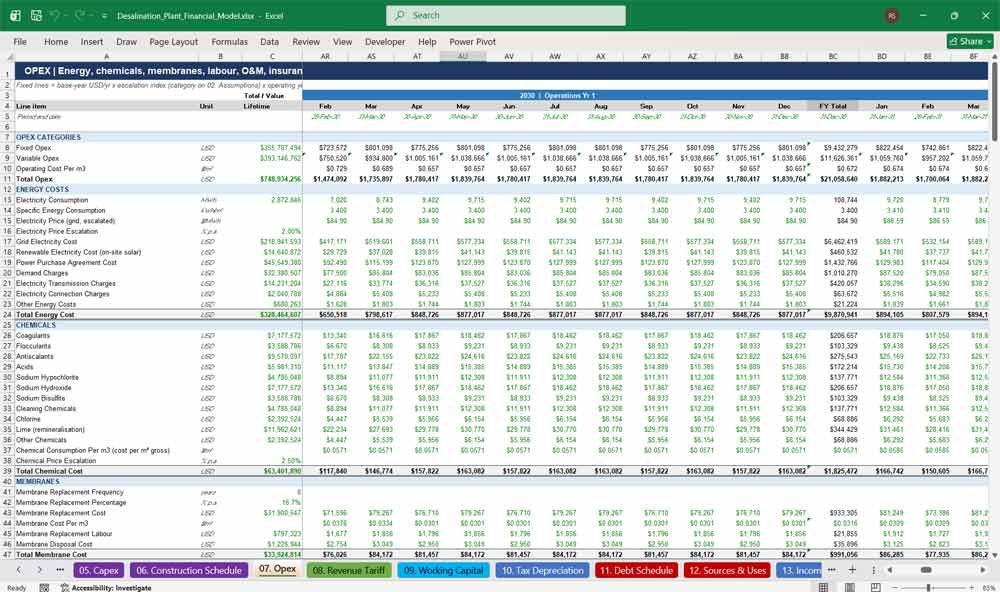
07. Opex
The Opex tab builds every operating cost of the desalination plant. Electricity is a dedicated calculation alongside chemicals, membranes, labour, O&M, spare parts, intake, treatment, brine disposal, insurance, land, administration, regulatory, environmental, security and major maintenance, giving total opex per m³.
- Energy cost = water × SEC × price, with PPA, demand and transmission charges
- Eleven chemical lines priced in $/m³ and membrane replacement cycles
- Labour by role with headcount, salary escalation, payroll taxes and benefits
- Fixed vs variable opex, opex per m³ and opex as a % of revenue
08. Revenue Tariff
The Revenue Tariff tab calculates desalinated water revenue under a Water Purchase Agreement. It covers the fixed capacity charge, availability payment, variable water charge, take-or-pay, merchant water sales, CPI tariff indexation with caps and floors, deductions and collections.
- Two-part WPA tariff with capacity and variable components
- Take-or-pay, merchant revenue and other operating revenue
- Availability, performance and volume-shortfall deductions
- Days sales outstanding, collection rate and bad debt
09. Working Capital
The Working Capital tab models receivables, inventory, prepaid insurance, payables, accruals and other liabilities for the desalination project. Days-based formulas work across monthly and annual periods, with cash-impact movements and a full unwind at the end of operations.
- Accounts receivable from DSO on net revenue
- Chemical and spare-parts inventory days
- Payables and accrued energy and payroll costs
- Net working capital movements that feed the cash flow
10. Tax Depreciation
The Tax Depreciation tab covers fixed assets and taxation. It handles construction work in progress, transfer to fixed assets at COD, book depreciation, tax depreciation, amortisation of development costs and financing fees, net operating losses, and current and deferred tax.
- CWIP roll-forward with transfer at COD
- Separate book and tax depreciation lives
- Net operating loss carry-forward and utilisation
- Current tax, deferred tax liability and tax payments in arrears
11. Debt Schedule
The Debt Schedule tab models desalination project financing. It covers monthly pro-rata debt and equity drawdowns, senior and subordinated debt, shareholder loans, interest during construction, fees, annuity repayment, DSRA, operating reserve and major maintenance reserve accounts. No circular references are used.
- Senior, subordinated and shareholder loan tranches
- Arrangement fee, commitment fee and capitalised IDC
- Level-annuity senior repayment and current-portion split
- DSRA, ORA and MMRA funding and release
Desalination Plant Financial Statements
12. Sources & Uses
The Sources & Uses tab summarises the total funding requirement of the desalination plant against senior debt, subordinated debt, equity, shareholder loans and grants. It shows funding ratios, loan-to-cost, loan-to-value and an automatic sources-equals-uses check.
- Uses: EPC, development, owner costs, contingency, fees, IDC and reserves
- Sources: senior debt, sub debt, equity, shareholder loans and grants
- Debt-to-funding, loan-to-cost and loan-to-value ratios
- Funding check that confirms sources less uses equals zero
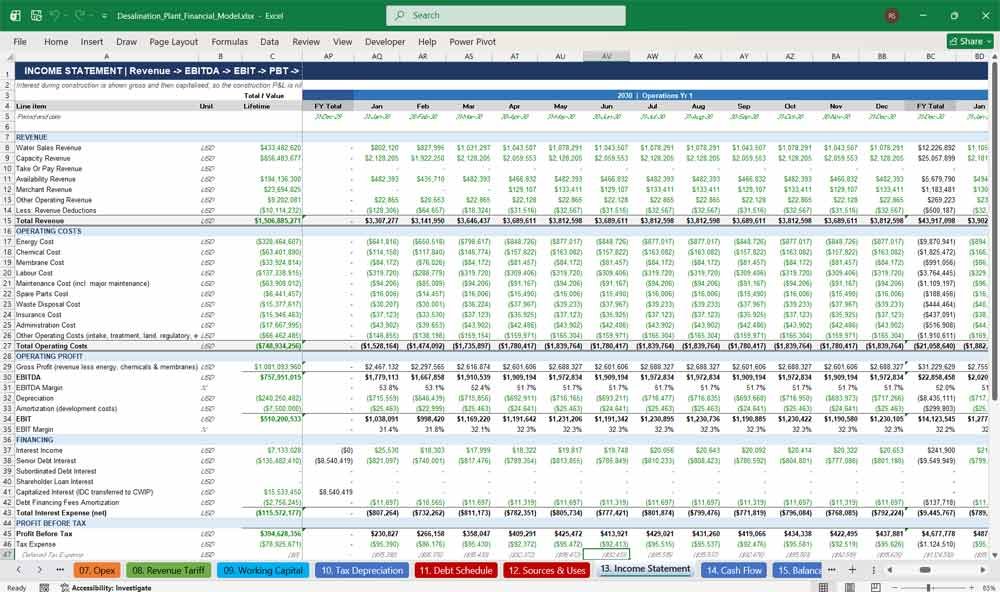
13. Income Statement
The Income Statement tab presents the desalination project’s profit and loss, from revenue through EBITDA, EBIT, financing costs and tax to net income. Revenue lines, cost categories, margins and non-cash items are shown for every month and year.
- Water sales, capacity, availability, take-or-pay and merchant revenue
- Energy, chemicals, membranes, labour and maintenance costs
- EBITDA, EBIT and net income margins
- Interest during construction shown gross, then capitalised
14. Cash Flow
The Cash Flow tab shows the desalination project’s operating, investing, financing and reserve cash flows. A distribution waterfall respects minimum cash and DSCR lock-up, and the tab produces CFADS, free cash flow to firm and free cash flow to equity.
- Cash revenue, cash operating costs and taxes paid
- Development, construction, equipment, maintenance and replacement capex
- Debt drawdowns, repayments, interest, fees and dividends
- CFADS, FCFF, FCFE and the closing cash balance
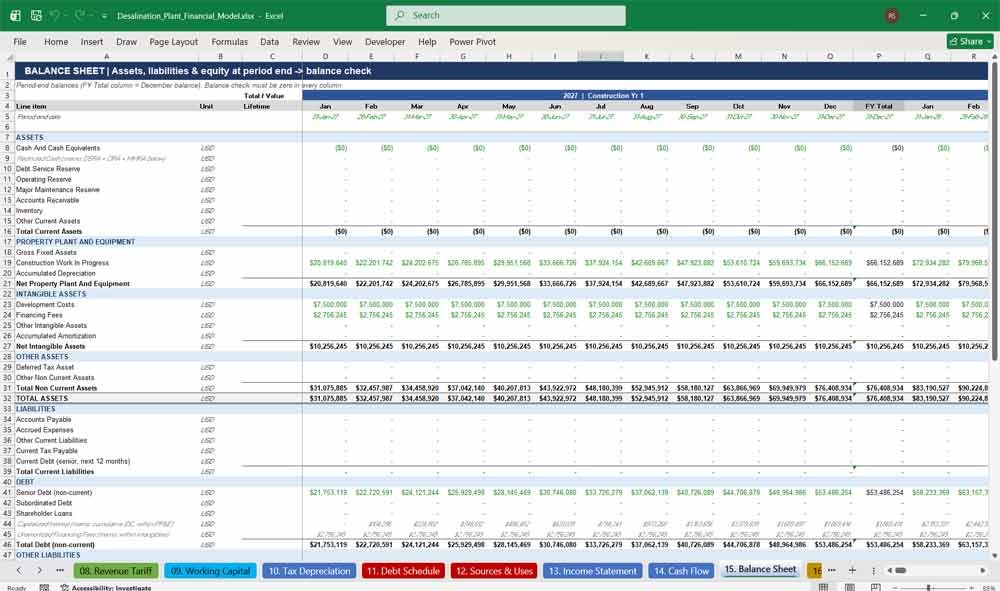
15. Balance Sheet
The Balance Sheet tab presents the desalination project’s assets, liabilities and equity at every period end. It covers cash, reserves, working capital, PP&E, intangibles, debt, deferred tax and retained earnings, with a balance check that balances in every period.
- Cash, DSRA, operating reserve and major maintenance reserve
- Net PP&E, CWIP, intangibles and deferred tax
- Current and non-current debt and liabilities
- Paid-in capital, retained earnings and a zero-difference balance check
16. Project Returns
The Project Returns tab calculates unlevered desalination project cash flows and investment returns. It gives the pre-tax and post-tax project IRR using XIRR, project NPV at WACC, return on invested capital and payback period from COD.
- Project IRR, pre-tax and post-tax
- Project NPV at WACC
- ROIC and annual ROIC profile
- Payback date and payback years from COD
17. Equity Returns
The Equity Returns tab measures returns to sponsors of the desalination project. It tracks equity contributions, shareholder loans, dividends and loan repayments, and gives equity IRR, MOIC, equity NPV at the cost of equity, cash yield and equity payback.
- Equity IRR using XIRR on actual period-end dates
- MOIC and total distributions
- Equity NPV at the cost of equity
- Annualised cash yield and equity payback
Key Financial Metrics for a Desalination Plant
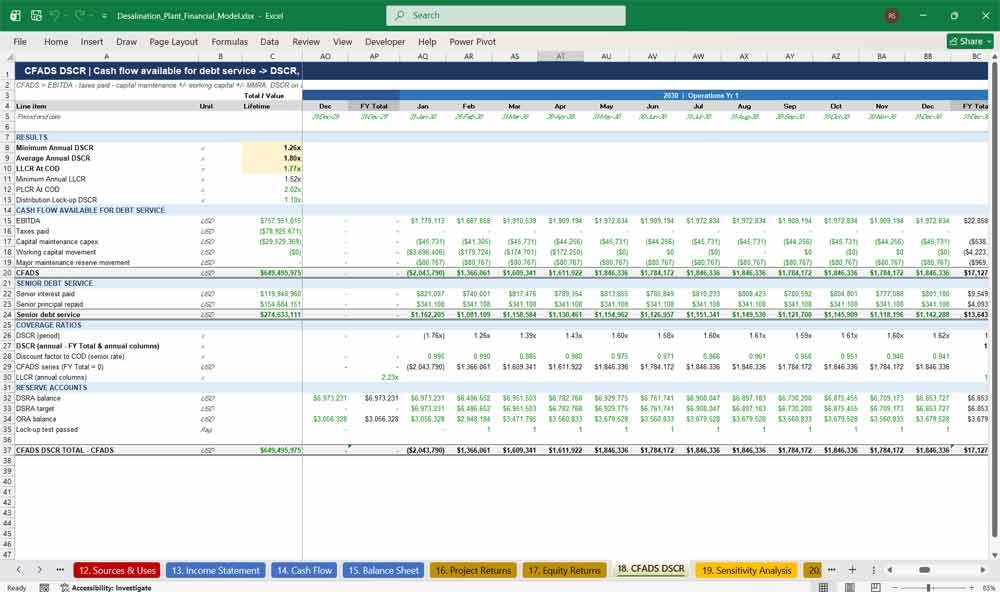
18. CFADS DSCR
The CFADS DSCR tab is built for lenders financing desalination projects. It calculates cash flow available for debt service, period and annual DSCR, minimum and average DSCR, LLCR, PLCR, distribution lock-up tests and the status of the reserve accounts.
- CFADS build including major maintenance reserve movements
- Annual, minimum and average DSCR
- LLCR at COD, annual LLCR and PLCR
- DSRA and ORA balances and lock-up test
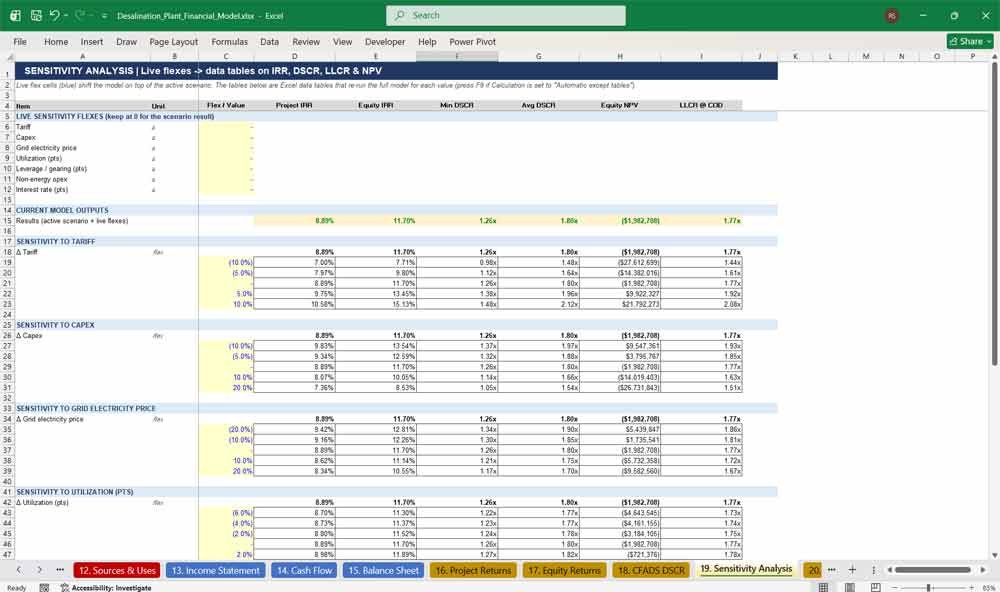
19. Sensitivity Analysis
The Sensitivity Analysis tab stress-tests the desalination model with live flex inputs and Excel data tables. It shows the impact of tariff, capex, electricity price, utilization, gearing, opex and interest rates on IRR, DSCR, LLCR and equity NPV.
- Seven live sensitivity flexes stacked on top of the active scenario
- One-variable data tables for each key value driver
- Outputs: project IRR, equity IRR, minimum and average DSCR, NPV and LLCR
- Fast calculation mode, refreshed with F9
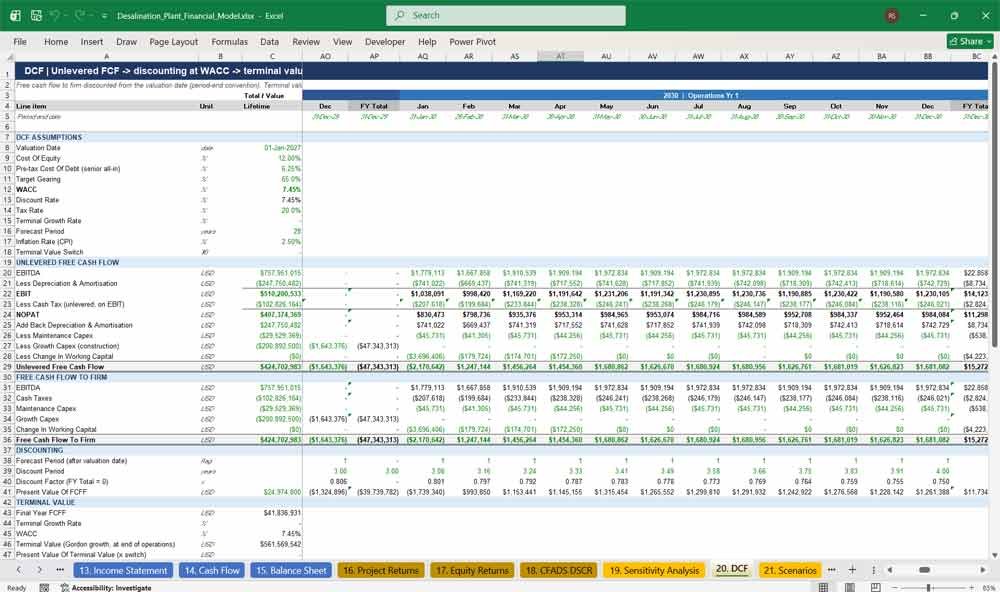
20. DCF
The DCF tab values the desalination plant using unlevered free cash flow discounted at WACC. It covers terminal value, enterprise value, equity value and valuation sense-checks such as implied exit multiple and EV per m³/day.
- WACC built from cost of equity, cost of debt and target gearing
- UFCF and FCFF reconciliation
- Switchable Gordon-growth terminal value
- Enterprise value, equity value and valuation checks
21. Scenarios
The Scenarios tab holds the Base, Downside, Upside and Custom cases for the desalination project. Each case adjusts tariff, capex, electricity price, energy consumption, availability, utilization, opex, interest rates, inflation and gearing, and is selected from the cover tab.
- Four editable scenario columns
- Ten key value drivers in each scenario
- Active case pulled automatically by INDEX/MATCH
- Feeds the adjusted drivers on the Assumptions tab
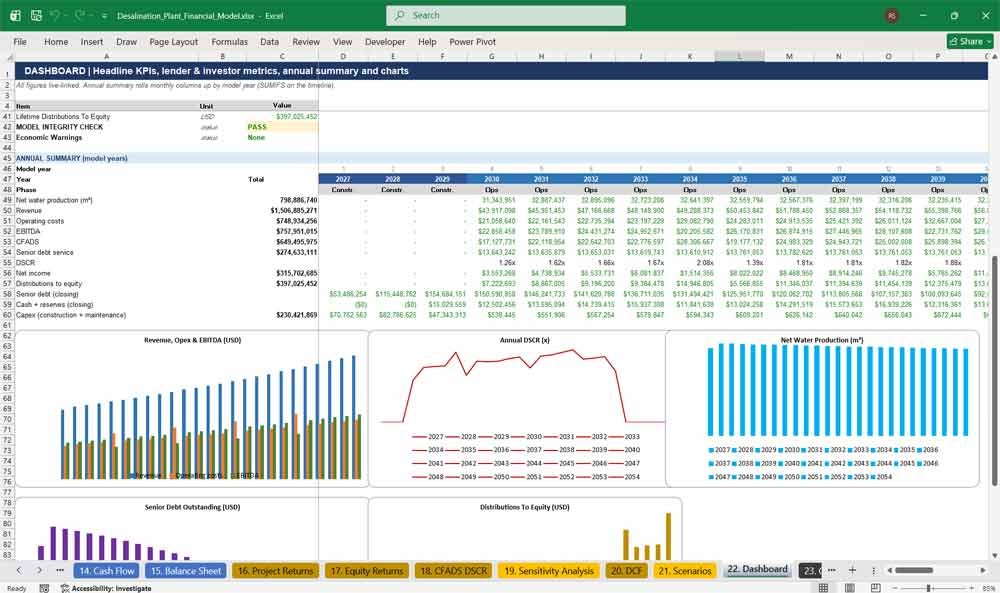
22. Dashboard
The Dashboard tab presents the desalination model’s key investor and lender KPIs on one page: funding, returns, DSCR, LLCR, levelised cost of water, average tariff and opex per m³. It also includes an annual summary table and five charts for presentations.
- Headline project, equity and lender metrics
- Levelised cost of water (LCOW) and opex per m³
- 28-year annual summary built with SUMIFS
- Charts of revenue, EBITDA, DSCR, debt, distributions and production
23. Checks
The Checks tab protects the integrity of the desalination financial model. It tests the balance sheet, cash flow, debt roll-forward, funding, CWIP transfer, production limits, opex, revenue and DCF reconciliations every period, and returns an overall PASS or REVIEW status.
- Period-by-period error amounts and counts
- Model-level checks: sources = uses, debt repaid, cash distributed
- Separate economic warnings for cash shortfalls and DSCR below 1.0x
- Overall status linked to the cover tab and dashboard
Why Buy This Model?
Building a bankable desalination plant financial model from scratch takes weeks of specialist work and carries a real risk of costly errors. This model gives you a complete, fully tested SWRO project finance framework ready to use today. It has 23 integrated tabs and more than 100,000 live formulas, with no hardcoded results. A dedicated electricity calculation reflects how RO desalination economics really work, and a Water Purchase Agreement tariff structure matches how desalination projects are actually contracted. Lender metrics such as DSCR, LLCR and reserve accounts are included. The balance sheet balances in every period, every date updates from a single start date, and built-in checks confirm the model’s integrity. Whether you are preparing a feasibility study, an investment committee paper, a bid for a desalination tender or a lender submission, it lets you spend your time on the decision rather than on building the spreadsheet.
Desalination Plant Frequently Asked Questions (Faq)
Q: I’m developing a desalination project in a different country. Can I use this model?
A: Yes. Every input is on the Assumptions tab: capacity, tariffs, capex, opex, electricity price, inflation, tax rate and financing terms. You can tailor it to any location. The model runs in USD, and you can enter local costs converted at your chosen exchange rate.
Q: Our plant is 50,000 m³/day, not 100,000. Will the model still work?
A: Yes. Change the nameplate and contracted capacity, then update capex and opex to match your plant. Production, chemicals, energy, brine and revenue all scale automatically from the capacity and volume formulas.
Q: How is electricity cost calculated? It’s our biggest cost.
A: Electricity has its own dedicated calculation: water produced × specific energy consumption (kWh/m³) × electricity price. You can split supply between the grid, a renewable PPA and on-site solar, each with its own price and escalation. Demand charges, transmission charges and carbon costs are included too.
Q: Our construction starts later than 2027. Do I have to update all the dates by hand?
A: No. Change the single start date on the Assumptions tab and every date, month label, year header, COD, escalation index and repayment date updates automatically throughout the workbook.
Q: Does the model work for lenders and debt sizing?
A: Yes. It includes senior and subordinated debt, shareholder loans, interest during construction, arrangement and commitment fees, annuity repayment, a DSRA, an operating reserve and a major maintenance reserve. It also calculates CFADS, annual DSCR, minimum and average DSCR, LLCR, PLCR and a distribution lock-up test.
Q: What revenue structures are covered?
A: The model follows a Water Purchase Agreement. It includes a fixed capacity charge, an availability payment, a variable water charge, take-or-pay, merchant sales of excess water and other operating revenue. Tariffs are indexed to CPI with caps and floors, and you can model availability, performance and volume-shortfall deductions.
Q: Can I run downside and upside cases?
A: Yes. The Scenarios tab holds Base, Downside, Upside and Custom cases that you select from the cover tab. The Sensitivity Analysis tab adds live flexes and data tables for tariff, capex, electricity price, utilization, gearing, opex and interest rates.
Q: Is the model protected or locked?
A: No. All formulas are fully visible and editable, so you can audit every calculation, adapt the structure and present it confidently to investors, lenders or a board.
Q: How do I know the model is correct?
A: The Checks tab tests the balance sheet, cash flow, debt roll-forward, sources and uses, CWIP, production limits and statement reconciliations in every period. It returns an overall PASS or REVIEW status, which also shows on the cover and dashboard.
Q: What version of Excel do I need?
A: Any modern desktop version of Microsoft Excel (Excel 2016, 2019, 2021 or Microsoft 365) on Windows or Mac. The model uses standard functions such as XIRR, XNPV, SUMIFS and INDEX/MATCH. It uses no macros, so there is nothing to enable.
Q: Does it calculate the levelised cost of water?
A: Yes. The Dashboard reports the levelised cost of water (LCOW) at WACC. It also shows average realised tariff, average opex per m³ and average energy cost per m³, so you can benchmark your project against other desalination plants and tenders.
Q: Are the numbers in the model real project data?
A: No. The model comes pre-filled with realistic illustrative inputs for a 100,000 m³/day SWRO plant, so you can see how every calculation works. Replace them with your own project data before making investment decisions.
Q: Can I use it for a bid or tender submission?
A: Yes. The model’s clear layout, colour-coded inputs, lender metrics and integrity checks make it suitable as the basis for desalination tenders, feasibility studies and financing submissions. We recommend having your final inputs reviewed by your technical and financial advisors.
Final Notes on the Financial Model
This 20-Year Desalination Plant Financial Model must focus on balancing capital expenditures with steady revenue growth from diversified services. By optimizing operational costs, and power efficiency, and maximizing high-margin services like industrial water and chemical sales, the model ensures sustainable profitability and cash flow stability.
Download Link On Next Page