
Container Port Financial Model Template
This Container Port Financial Model Template is a fully-dynamic, bank-grade Excel valuation template built for anyone analyzing a container terminal acquisition, expansion, or project finance case. Covering three years of historical financials and a full 20-year operating forecast, it links throughput, tariffs, capex, debt, tax and working capital into one fully-integrated engine — giving you defensible EBITDA, free cash flow, DCF valuation and equity returns in minutes rather than weeks. Whether you’re underwriting a port acquisition, preparing an infrastructure fund investment memo, building a lender case, or studying project finance, this template delivers institutional-quality structure without the build time.
Financial Model for a Container Port
Built across 18 fully linked tabs — from a live Cover Dashboard and Control Assumptions through Throughput, Tariffs & Revenue, Capex, Debt Schedule, Tax, Balance Sheet, DCF Valuation and a dedicated Returns tab — the model separates “what the port is worth” from “what the investor actually earns,” exactly as real acquisition finance teams do. Every formula flows from a single Model Start Date, every revenue stream is modeled independently (storage, stevedoring, gate services, reefer, demurrage and more), and a built-in Checks tab continuously verifies that the balance sheet ties to zero. The result is a container terminal valuation and project finance model that behaves like a real deal model, not a static spreadsheet.
Every assumption is color-coded, editable and formula-driven, so you can change the acquisition price, debt terms, throughput growth, tariff rates or exit multiple and watch the entire 20-year forecast, DCF valuation and equity IRR recalculate instantly. A dedicated Scenarios & Sensitivities tab lets you stress-test volume, tariffs, opex, capex costs, FX and construction delay without touching a single formula, while WACC, terminal growth and exit multiple sensitivity tables are already built in. No macros, no VBA, no hidden black boxes — just a transparent, audit-ready Excel financial model you can hand straight to an investment committee, lender or professor.
Tab-By-Tab Guide
01. Cover Dashboard
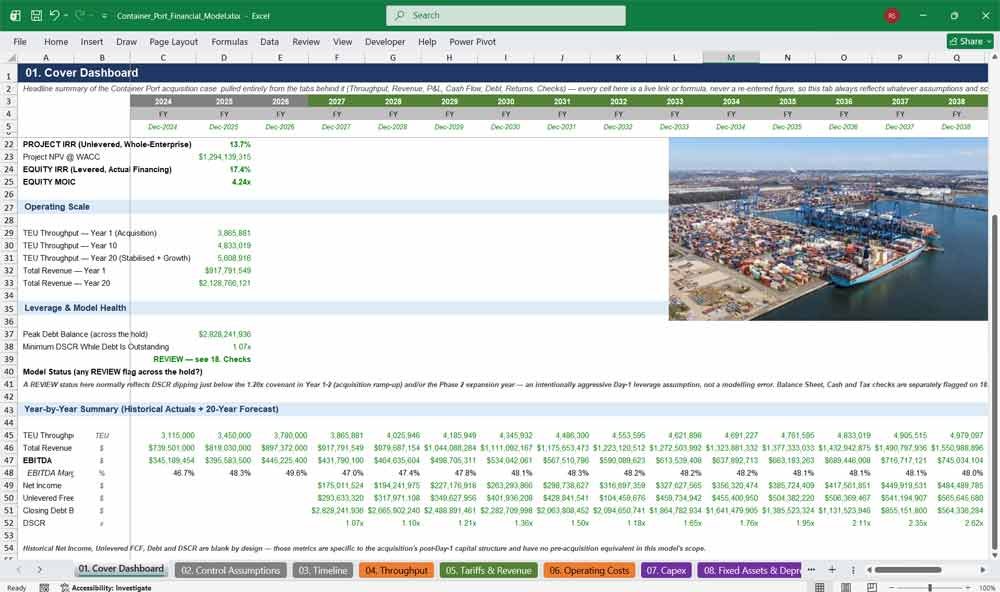
The Cover Dashboard is your one-page executive summary: acquisition structure, implied purchase multiple, headline Project and Equity IRR, EBITDA growth, throughput trends and leverage — all live-linked and chart-driven, so you can present the entire container port investment case on a single screen. (41 words)
- Live-linked KPI snapshot: Acquisition EV, implied multiple, Debt/Equity split, WACC and exit assumptions
- Headline Project IRR, Project NPV, Equity IRR and Equity MOIC pulled straight from the Returns tab
- Built-in Revenue, EBITDA, TEU throughput and debt-paydown charts spanning the full 20-year hold
- One-click visual health check flags any covenant or tie-out issue instantly
02. Control Assumptions
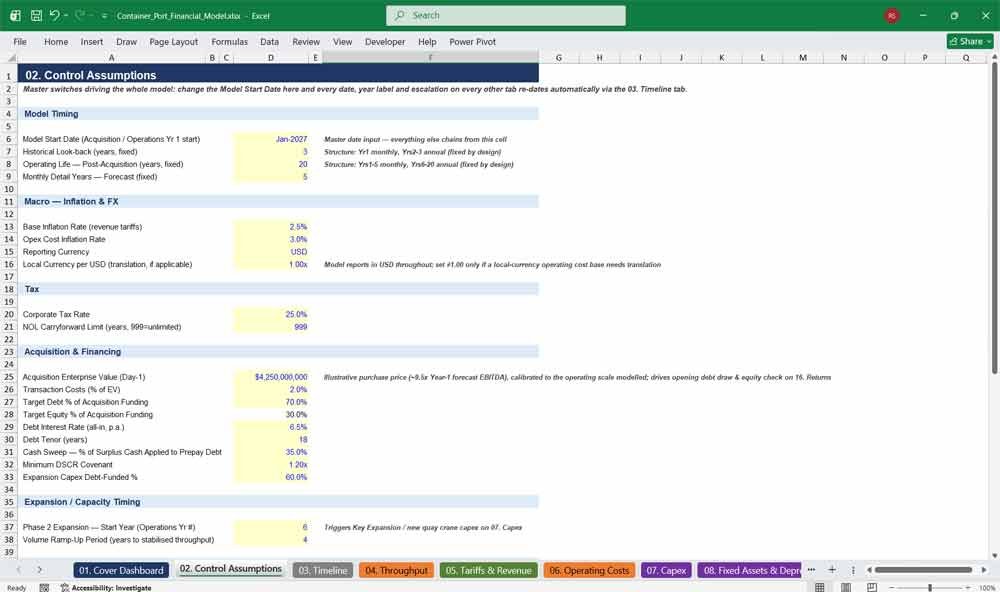
Every driver of the model lives on one tab: acquisition price, debt terms, WACC, tax rate, inflation, exit assumptions and seven scenario override switches. Change the Model Start Date here and every date, escalation and forecast year across all 18 tabs updates automatically — no manual re-linking required. (41 words)
- Single master date input drives every calendar, escalation index and year label in the workbook
- Acquisition price, debt/equity split, interest rate, tenor and cash sweep all centralized and editable
- Seven scenario switches (volume, tariff, opex, capex, FX, inflation, delay) ready to stress-test the deal
Container Port Revenues & Costs
03. Timeline
The Timeline tab is the model’s master calendar, converting one start date into every historical and forecast period across the workbook — monthly detail for the first five years, annual thereafter — plus the ramp-up and escalation indices that keep revenue and cost growth perfectly consistent everywhere. (41 words)
- Formula-driven calendar spans 3 historical years and a full 20-year forecast automatically
- Volume ramp-up curve models a realistic post-acquisition path to stabilised throughput
- Cumulative tariff and opex escalation indices keep every cost and revenue line consistent
04. Throughput
The operating engine of the model: TEU throughput cascades into containers, stevedoring moves, vessel calls, storage days and gate transactions, giving every one of the model’s 11 revenue streams its own defensible, unit-specific volume driver instead of a single generic “units handled” shortcut. (40 words)
- Full TEU → Containers → Moves → Days → Transactions volume hierarchy, not a generic throughput line
- Design capacity, utilisation and import/export/transshipment split all independently adjustable
- Brownfield ramp-up logic continues from the real historical run-rate rather than restarting from zero
05. Tariffs & Revenue
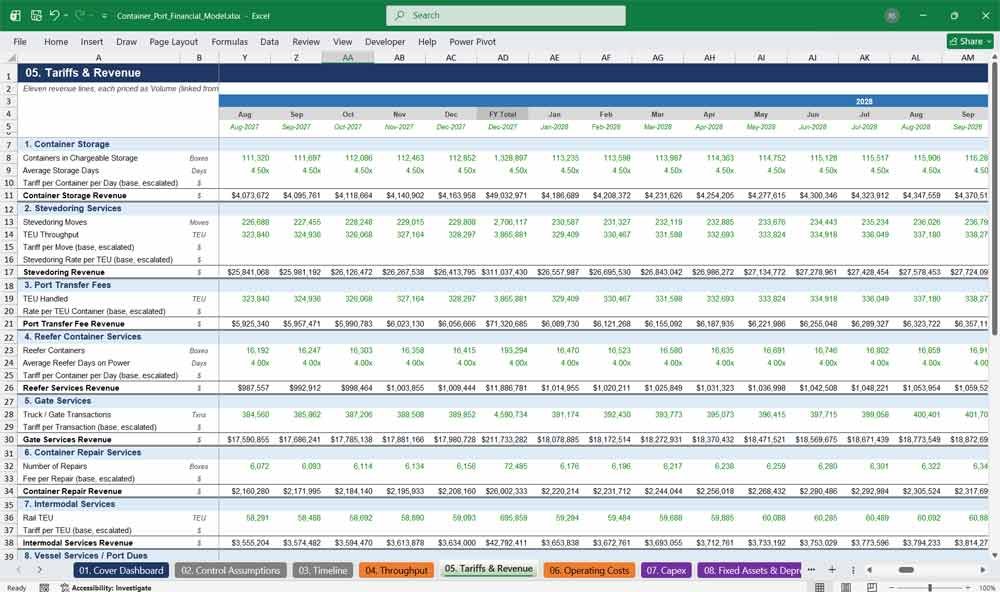
Eleven independent revenue streams — storage, stevedoring, port transfer, reefer, gate services, container repair, intermodal, vessel dues, weighing/VGM, demurrage and equipment/crane fees — each priced off its own volume driver and escalated tariff rate, giving a granular, audit-ready revenue build instead of one blended top-line assumption. (41 words)
- 11 separately priced revenue lines, each linked to its own throughput driver on the Throughput tab
- Equipment and crane service fees modeled separately from stevedoring, matching real terminal tariff structures
- Every tariff rate escalates automatically off the model’s inflation index
06. Operating Costs
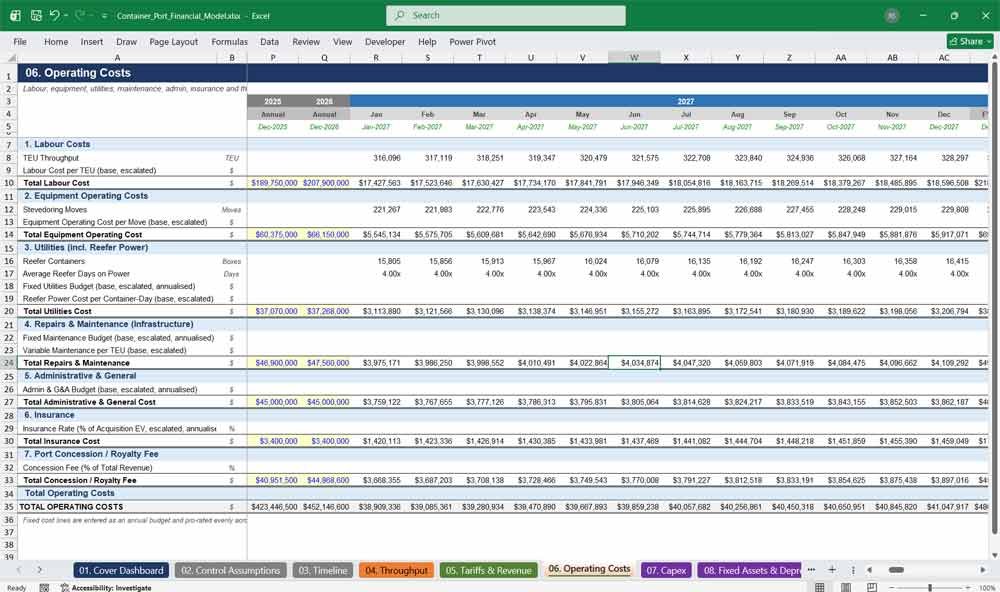
Labour, equipment, utilities, maintenance, administration, insurance and the port concession fee are each modeled with their own fixed and variable drivers, escalated independently of revenue, so operating leverage and margin trends behave realistically as throughput scales toward stabilisation over the 20-year hold. (40 words)
- Seven cost categories split cleanly between fixed budgets and volume-variable rates
- Concession/royalty fee automatically tracks total revenue, exactly as real port concessions work
- Every rate responds to the Opex Scenario Adjustment switch for instant stress-testing
07. Capex
Twelve itemised capital programmes — from key expansion and new quay cranes to security, customs and backup power systems — each fire in their own trigger year, with the Phase 2 Expansion timed off a single input so shifting the expansion date re-times the whole capital plan. (41 words)
- 12 distinct capex line items instead of one lump-sum “capital expenditure” placeholder
- Expansion-linked items automatically re-time off the Expansion Start Year assumption
- Capex Scenario Adjustment and Delay switches stress-test cost overruns and construction delays instantly
08. Fixed Assets & Depreciation
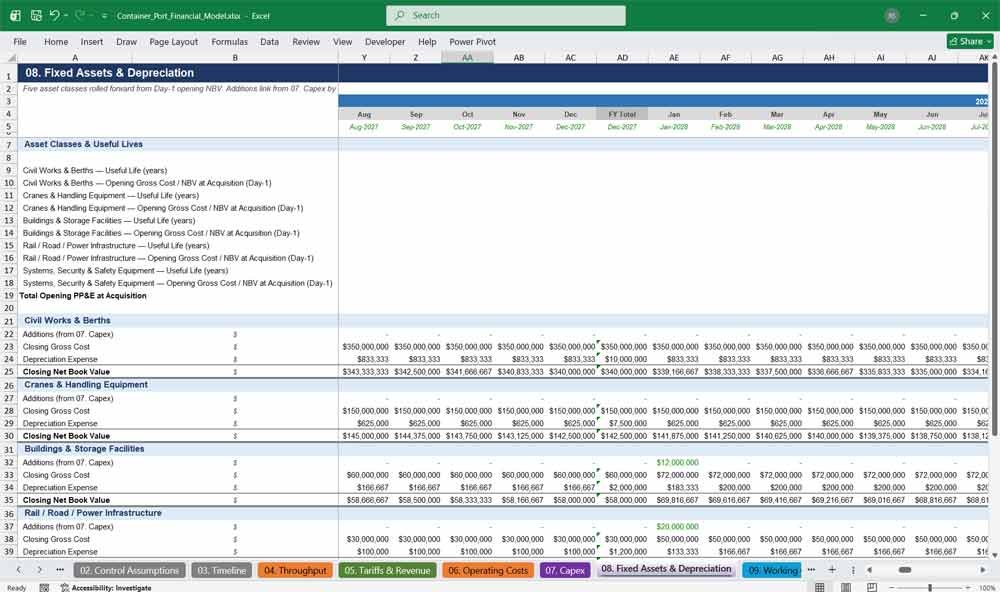
Five asset classes — civil works, cranes, buildings, infrastructure and systems — each roll forward from opening balance through additions and depreciation to closing net book value, feeding depreciation straight into the P&L and Tax tabs with full historical-to-forecast continuity. (39 words)
- Full gross cost, accumulated depreciation and net book value rollforward by asset class
- Depreciation flows automatically into both the P&L and the Tax schedule
- Opening balances carry seamlessly from the acquisition-date purchase accounting
Container Port Financial Statements
09. Working Capital
Accounts receivable, inventory, accounts payable and other current liabilities are each driven off day-based ratios linked to revenue and cost, producing a realistic change-in-net-working-capital line that feeds the cash flow statement — not a static percentage-of-revenue guess. (38 words)
- Days-based AR, inventory, AP and OCL build, not a flat percentage-of-revenue shortcut
- Change in net working capital flows directly into both Cash Flow and the Debt sweep
- Fully consistent across monthly, annual and FY-Total columns
10. P&L
A clean income statement from Total Revenue down to Net Income, where every line below EBITDA is a pure link to the Depreciation, Debt and Tax schedules — never recalculated locally — so the P&L can never silently drift from the tabs that actually drive it. (41 words)
- Revenue and Opex link straight from the Revenue and Operating Costs tabs
- Depreciation, Interest and Tax are pulled, never recomputed, eliminating circular-reference risk
- EBITDA margin trend visible across the full historical and 20-year forecast horizon
11. Cash Flow
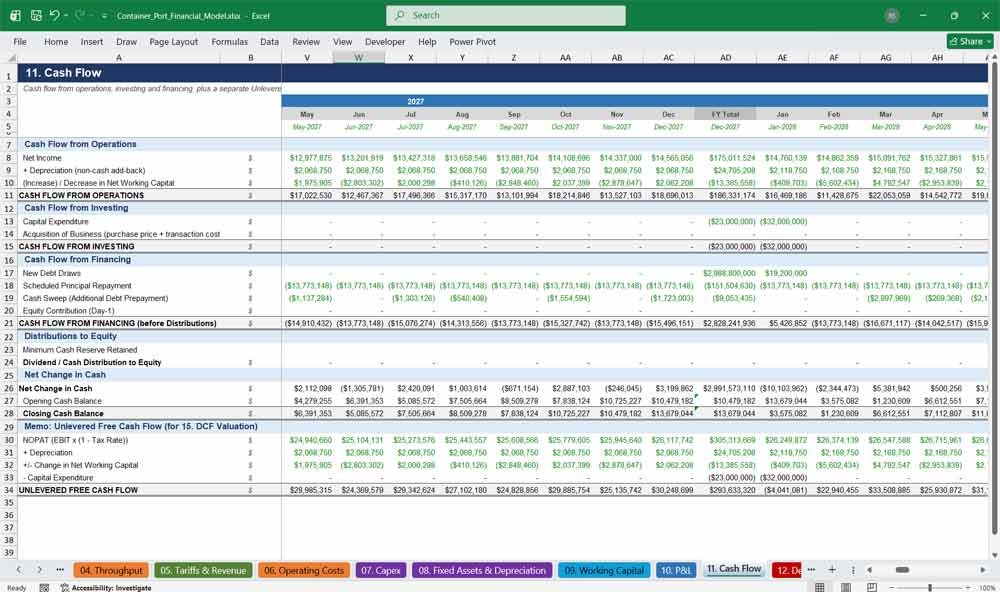
Operating, investing and financing cash flow plus a standalone Unlevered Free Cash Flow memo that the DCF tab pulls directly. The Day-1 acquisition — purchase price, transaction costs, debt draw and equity contribution — is booked cleanly in the first forecast period. (39 words)
- Dedicated Unlevered FCF line feeds the DCF Valuation tab without ever being recomputed there
- Day-1 acquisition funding (debt draw, equity check, transaction costs) modeled explicitly
- Dividend policy sweeps excess cash to equity only once debt is fully repaid
12. Debt Schedule
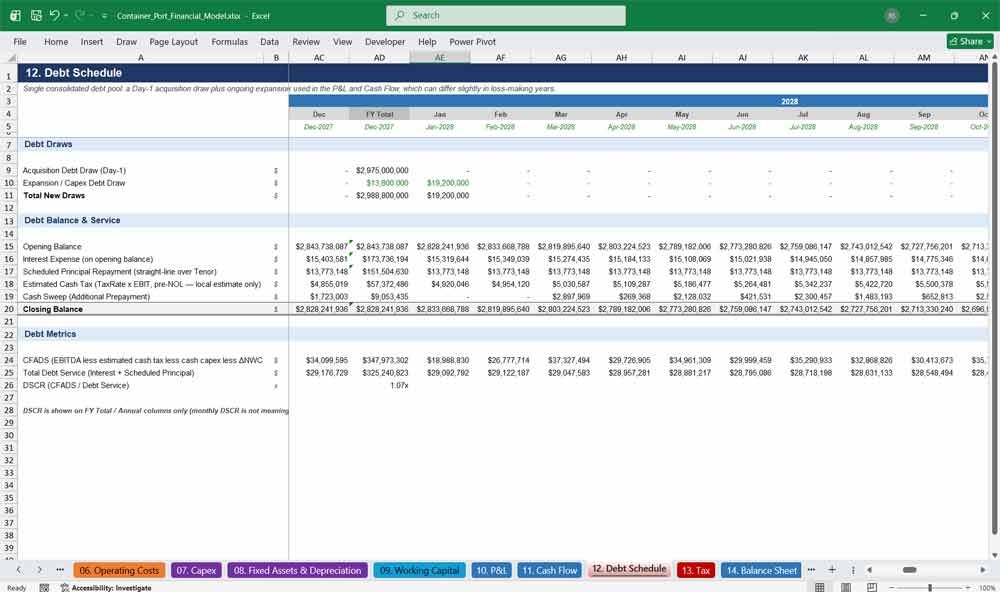
A single consolidated debt pool with a Day-1 acquisition draw and ongoing expansion-capex draws, interest accruing on the opening balance only, plus a cash-sweep mechanic and DSCR covenant test — built to run without circular references or iterative calculation switches. (38 words)
- Acquisition draw plus expansion capex draws combined into one clean debt schedule
- Cash sweep automatically accelerates repayment using surplus CFADS, sized off estimated cash tax
- DSCR covenant tracked every period against your Minimum DSCR input
13. Tax
EBIT less interest generates taxable income, with a full net operating loss carryforward schedule sheltering future taxable income before cash tax is charged at your statutory rate — giving lenders and investors a realistic, NOL-aware cash tax line instead of a flat EBT-times-rate shortcut. (41 words)
- Full NOL carryforward and utilisation schedule, not a simplified flat-tax assumption
- Cash tax feeds both the P&L and the actual financing structure on the Cash Flow tab
- Statutory tax rate and NOL limit fully editable on Control Assumptions
14. Balance Sheet
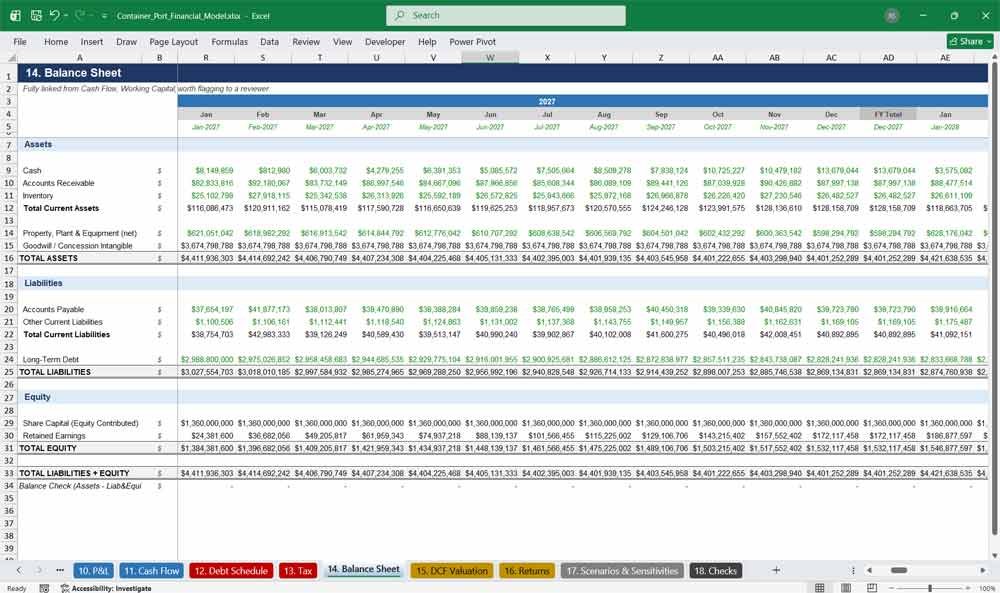
A complete, fully-reconciled balance sheet with purchase-accounting goodwill calculated at acquisition, verified to tie to zero across every one of the model’s 95 monthly, annual and FY-Total columns — the single most important integrity check any financial model buyer should demand. (40 words)
- Goodwill/intangible plug calculated automatically from purchase price less net assets acquired
- Verified to balance to exactly zero across every historical and forecast period
- Cash, debt, working capital and equity all roll forward consistently from the schedules behind them
Container Port Financial Scenarios
15. DCF Valuation
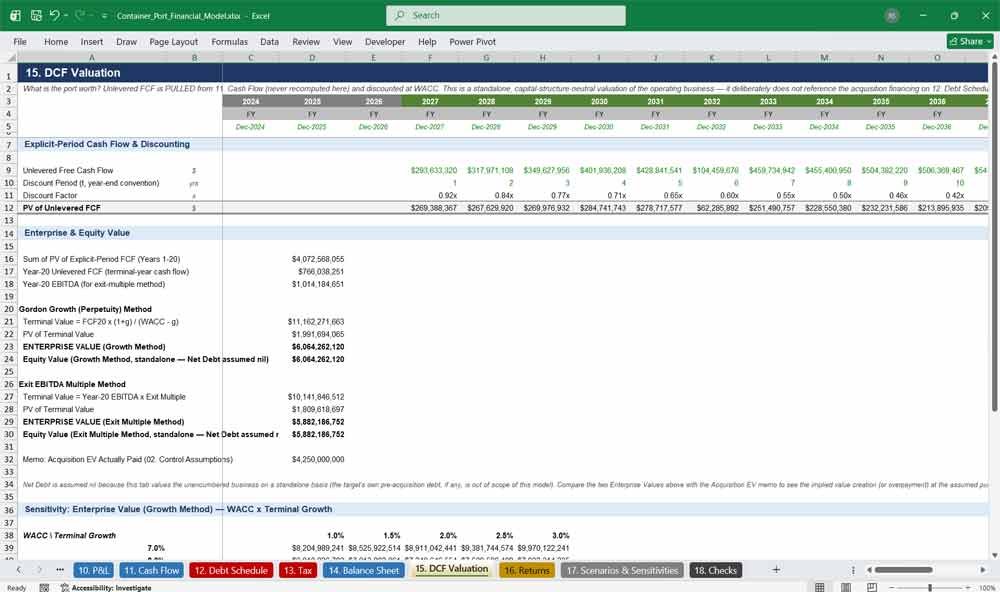
Answers one question only: what is the port worth? Unlevered free cash flow is discounted at WACC using both Gordon Growth and Exit Multiple terminal value methods, with built-in 5×5 sensitivity tables across WACC, terminal growth and exit multiple ranges. (38 words)
- Two independent terminal value methods (perpetuity growth and exit EBITDA multiple) cross-checked against each other
- 5×5 sensitivity grids for WACC vs. terminal growth and WACC vs. exit multiple
- Deliberately excludes acquisition financing, giving a clean, capital-structure-neutral enterprise valuation
16. Returns
Answers the other question: what does the investor actually earn? Built on the real acquisition price, actual debt draw and real dividends received, this tab calculates Project IRR, Project NPV, Equity IRR and Equity MOIC using your chosen exit year and exit multiple. (40 words)
- Separate Project (unlevered) and Equity (levered) IRR, clearly showing the leverage benefit
- Equity MOIC calculated from actual dividends received plus exit proceeds, not a theoretical shortcut
- Exit year and exit multiple both dynamically adjustable via a single input cell
17. Scenarios & Sensitivities
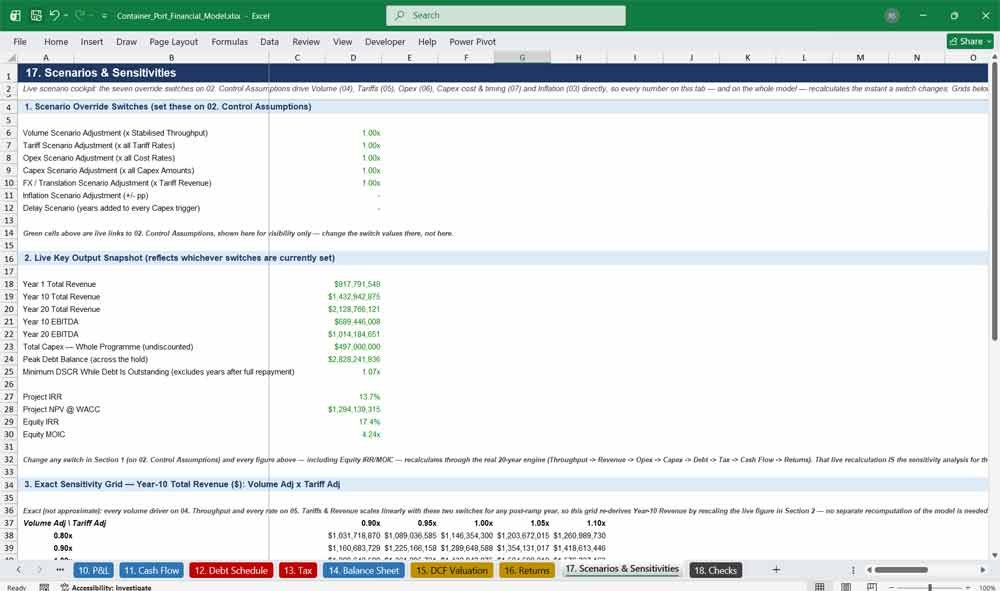
A live scenario cockpit: seven override switches for volume, tariffs, opex, capex cost, FX, inflation and construction delay flow straight through the entire 20-year engine, plus two exact closed-form sensitivity grids for Year-10 revenue and the present value of the total capex programme. (40 words)
- Seven scenario switches instantly re-run the entire model — no macros, no VBA required
- Exact (not approximate) sensitivity grids for revenue and capex present value
- Preset Downside / Base / Upside reference guide included for quick scenario setup
18. Checks
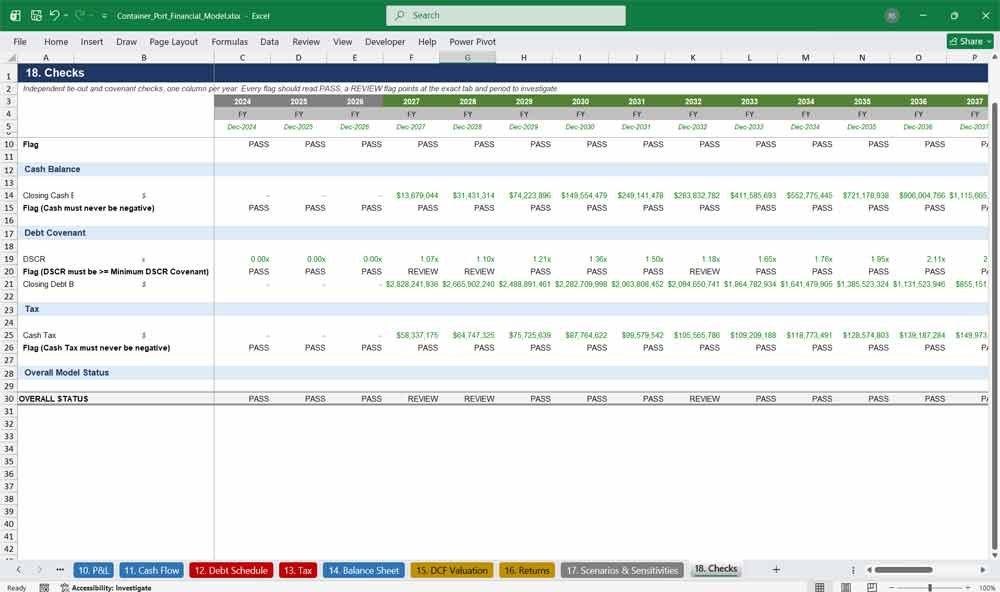
An independent tie-out and covenant control tab: balance sheet integrity, cash balance, DSCR covenant and cash tax are all flagged PASS or REVIEW for every single period, giving buyers instant confidence that the model is mechanically sound before they even open another tab. (40 words)
- Balance sheet, cash, DSCR and tax integrity checks run automatically for every period
- Single Overall Status flag rolls every check into one PASS/REVIEW indicator
- Points directly to the tab and period responsible for any flagged item
Why Buy This Model
Building a bankable, fully-integrated container port financial model from scratch easily takes a professional analyst 80–150 hours — sourcing a defensible tariff structure, engineering a non-circular debt and tax engine, reconciling a balance sheet to zero, and layering in DCF, returns and sensitivity analysis the right way. This template hands you that finished, error-checked engine today: 18 linked tabs, three years of historical detail, a full 20-year monthly-to-annual forecast, 11 distinct revenue streams, 12 itemised capex lines, a non-circular debt sweep, NOL-aware tax, a balance sheet that ties to zero in every single period, and both DCF and Returns analysis built the way real infrastructure investors actually separate them — “what is it worth” versus “what do I earn.” Whether you’re an investment banker preparing a pitch, a private equity or infrastructure fund associate underwriting an acquisition, a lender building a credit case, a port operator modeling an expansion, or a student or professor who needs a real-world teaching case, you get institutional-quality structure, fully transparent formulas, and instant scenario flexibility — without the weeks of build time or the risk of a spreadsheet error nobody catches until it’s too late.
Container Port Frequently Asked Questions (Faq)
Is this a real container port, or a fictional/illustrative case?
This is an illustrative, fully fictional large-scale container terminal (roughly 4–6 million TEU per year at stabilisation) built to be broadly representative of a real brownfield port acquisition. All names, figures and historical actuals are for modeling and training purposes — every driver, tariff and cost assumption is fully editable so you can drop in your own port’s real numbers.
Do I need advanced Excel or financial modeling experience to use this?
Basic Excel familiarity is enough to change inputs and read the outputs. If you want to fully customize the revenue build, debt mechanics or scenario switches, intermediate Excel or financial-modeling knowledge helps — but every formula is visible, color-coded and explained with on-sheet notes, so nothing is hidden or locked.
Is this compatible with Google Sheets, or only Microsoft Excel?
The model is built natively in Excel (.xlsx) using only standard, widely-supported formulas (SUMIFS, INDEX/MATCH, IFERROR, IRR, NPV, MINIFS) with no VBA or macros, so it opens cleanly in current Excel versions and largely works in Google Sheets — though Excel is recommended for full formula and chart fidelity.
Can I change the acquisition price, debt structure, or currency?
Yes. Acquisition price, debt/equity split, interest rate, tenor, cash sweep, tax rate, WACC and exit assumptions are all editable input cells on the Control Assumptions tab, and every other tab recalculates automatically. The model reports in USD by default and includes a translation input for a local-currency cost base.
Does the model include a debt schedule, or just equity returns?
Both. A full, non-circular Debt Schedule models the acquisition debt draw, expansion capex draws, interest, scheduled amortisation, a cash sweep and a DSCR covenant test — and the Returns tab then calculates the equity investor’s actual levered IRR and MOIC on top of that real financing structure.
What’s the difference between the DCF tab and the Returns tab?
The DCF tab values the port on a standalone, capital-structure-neutral basis — “what is it worth?” The Returns tab calculates what an investor actually earns given the real purchase price, actual debt and actual dividends received — “what do I make?” Keeping these separate is standard practice in real acquisition finance and avoids a common modeling mistake.
Can I run different scenarios, like a downside or delayed-construction case?
Yes. The Scenarios & Sensitivities tab gives you seven override switches — volume, tariffs, opex, capex cost, FX, inflation and construction delay — that flow through the entire 20-year model instantly when changed, plus a preset Downside/Base/Upside reference guide to get you started.
How do I know the model is actually correct and not just good-looking?
Every period’s balance sheet is verified to tie to exactly zero, and a dedicated Checks tab independently flags balance sheet integrity, cash balance, DSCR covenant and cash tax as PASS/REVIEW for every single period — so you can verify mechanical soundness yourself in minutes rather than taking it on faith.
Can I adapt this template for a different type of port or infrastructure asset?
Yes. Because every driver — throughput, tariffs, costs, capex, debt and tax — sits on its own tab with clearly labeled, editable input cells, the structure adapts well to other terminal types (bulk, RoRo, multi-purpose) or similar infrastructure assets with moderate rework of the revenue and volume drivers.
Is there a difference between Enterprise Value and Equity Value in this model, and which one do I need?
The DCF tab produces Enterprise Value on a standalone, debt-free basis, while the Returns tab works from the actual Acquisition Enterprise Value and debt draw to solve for equity outcomes. Use the DCF tab to value the business itself; use the Returns tab to assess a specific deal’s investor return.
Does this include historical financials, or does the forecast start from zero?
The model includes three years of illustrative historical actuals (Year 1 monthly, Years 2–3 annual) immediately before the acquisition date, and the 20-year forecast ramps up from that real historical run-rate rather than restarting from zero — reflecting a realistic brownfield acquisition rather than a greenfield build.
Conclusion for the Financial Model
Container Port Financial Model
This financial model provides a comprehensive framework to analyze the profitability, operational efficiency, and financial health of a container port. Each revenue stream contributes to overall income, while operating expenses and capital expenditures must be managed efficiently to ensure long-term profitability.
Download Link On Next Page
Download Link On Next Page