
Consulting Firm Financial Model Template
Build a clear, credible forecast for your consultancy without starting from a blank sheet. This consulting company financial model template in Excel is a complete, integrated three-statement financial model with 24 months of monthly historicals and a 5-year monthly forecast, each year rolled up into an annual column. Revenue, payroll, overheads, working capital, capex and financing all flow into a linked income statement, cash flow statement and balance sheet, in USD, across 18 clearly numbered, colour-coded tabs.
Financial Model for a Consulting Firm
Unlike a generic template, this professional services financial model is built around how consulting firms really make money: headcount by grade, working-day capacity, utilisation, billable days and daily rates. Revenue is calculated by service line, with recurring managed-service revenue and a weighted client pipeline as a cross-check. Model hiring plans, salaries, employer National Insurance, pensions, bonuses, subcontractors and overheads, then see the effect on margin, EBITDA and cash flow immediately.
Change one date and the entire model re-dates itself. Switch between Base, Upside and Downside scenarios with a single selector, monitor six live KPI charts, and rely on more than 20 built-in integrity checks with a PASS / REVIEW flag. With over 48,000 live formulas, no macros and no circular references, this consulting firm budget and forecast template suits founders, finance directors, partners, advisers and investors who need a clear, auditable plan.
Why Buy This Model
Why buy this model? Because building a consulting financial model from scratch takes significant skilled time and still leaves you unsure whether the balance sheet balances. This workbook gives you a finished, tested structure so you can spend your time on decisions, not formulas. It is designed for professional services: revenue comes from people, days, utilisation and rates rather than generic growth percentages, so your forecast reflects the levers a consultancy can actually pull. Every schedule is connected: hiring flows through payroll, capacity, revenue, working capital, tax and cash, and the balance sheet balances in every period, with automated checks to prove it. One start date drives every timeline, so you can re-base the model to any year in seconds. You get a transparent, auditable, macro-free Excel file to adapt, present to a bank or investor, and keep using for budgeting, reforecasting and scenario planning as your firm grows.
What Is Inside: The 18 Tabs
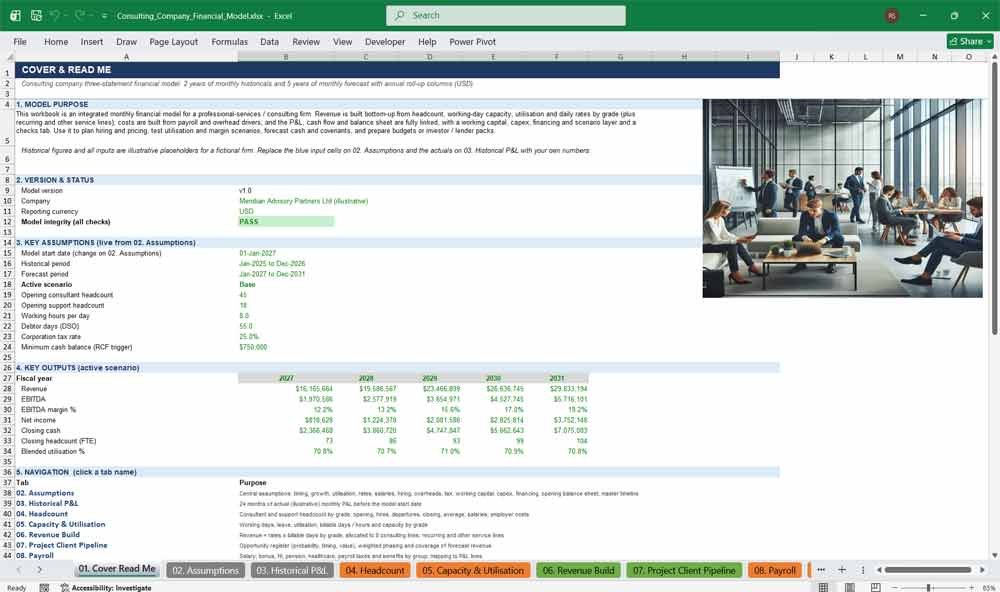
01. Cover Read Me
Start with the Cover Read Me tab: a clear consulting financial model overview covering purpose, version, live key assumptions, headline outputs, integrity status, clickable navigation and colour legend. New users understand structure, conventions and workflow within minutes, before touching inputs.
Highlights
- Live model integrity status (PASS / REVIEW) shown on the front page
- Key assumptions and five-year headline outputs pulled straight from the model
- Clickable navigation to all 18 tabs with a one-line purpose for each
- Colour legend for inputs, calculations and links, plus tab-colour guide
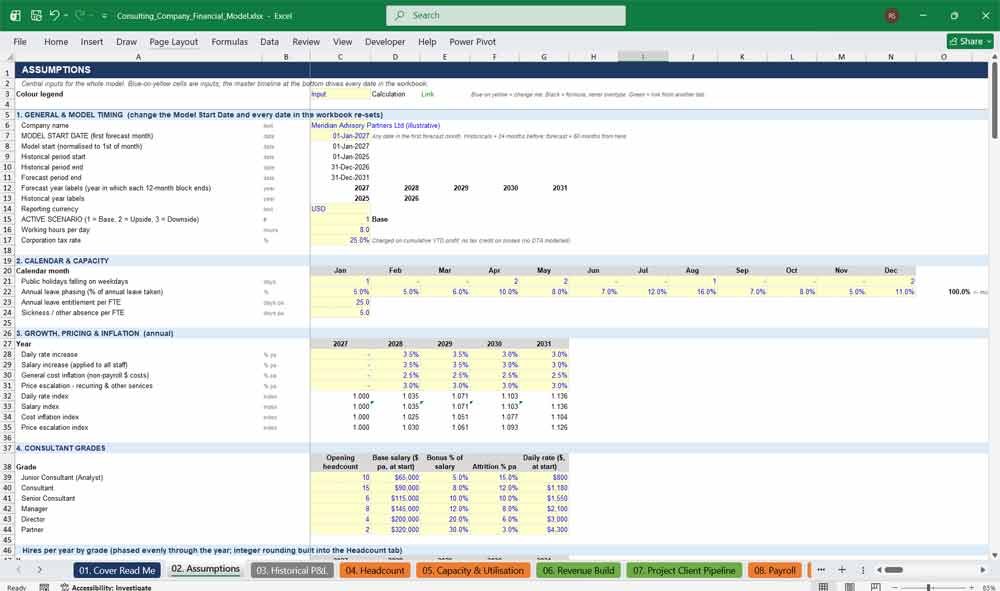
02. Assumptions
Centralise every driver in one Assumptions tab: model start date, growth, pricing, utilisation, salaries, hiring, overheads, tax, working capital, capex, financing and opening balance sheet. Change the start date and the entire consulting financial model re-dates automatically across every tab.
Highlights
- One Model Start Date input drives every date, year label and month header in the workbook
- Inputs for six consultant grades and six support functions, hires and attrition by year
- Revenue, overhead, working capital, capex and financing drivers in blue-on-yellow input cells
- Opening balance sheet with an automatic balancing figure and built-in check
Consulting Firm Revenue Pipeline
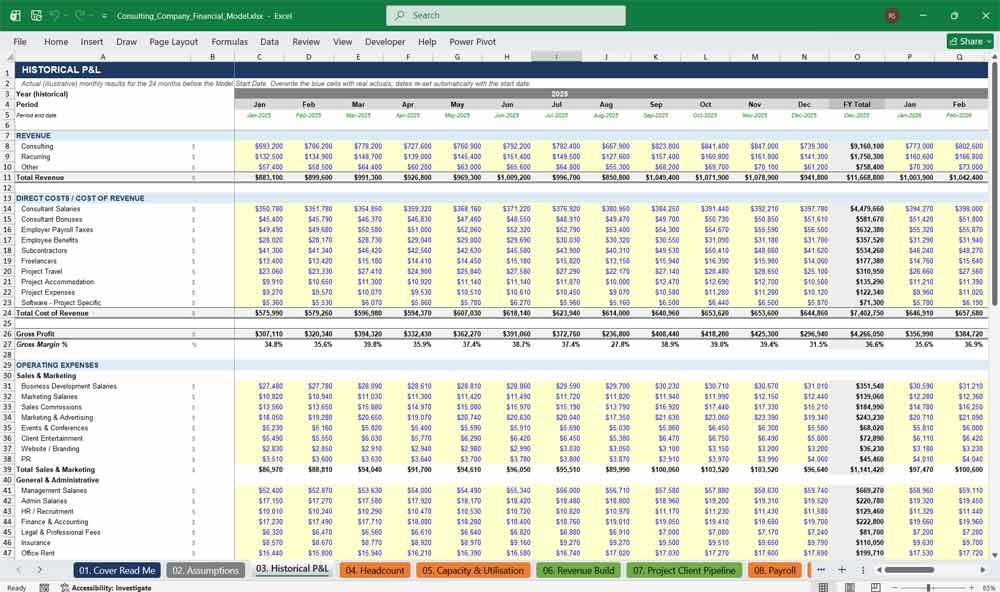
03. Historical P&L
Anchor your forecast in 24 months of monthly historical profit and loss data. The template shows revenue, cost of revenue, overheads, EBITDA, depreciation, finance costs and tax, with subtotals calculated automatically. Overwrite the illustrative actuals with your firm’s real results.
Highlights
- 24 months of monthly actuals with two annual totals
- Full P&L structure that mirrors the forecast income statement line for line
- Subtotals, gross margin and EBITDA margin calculated automatically
- Historical dates re-set automatically when the start date changes
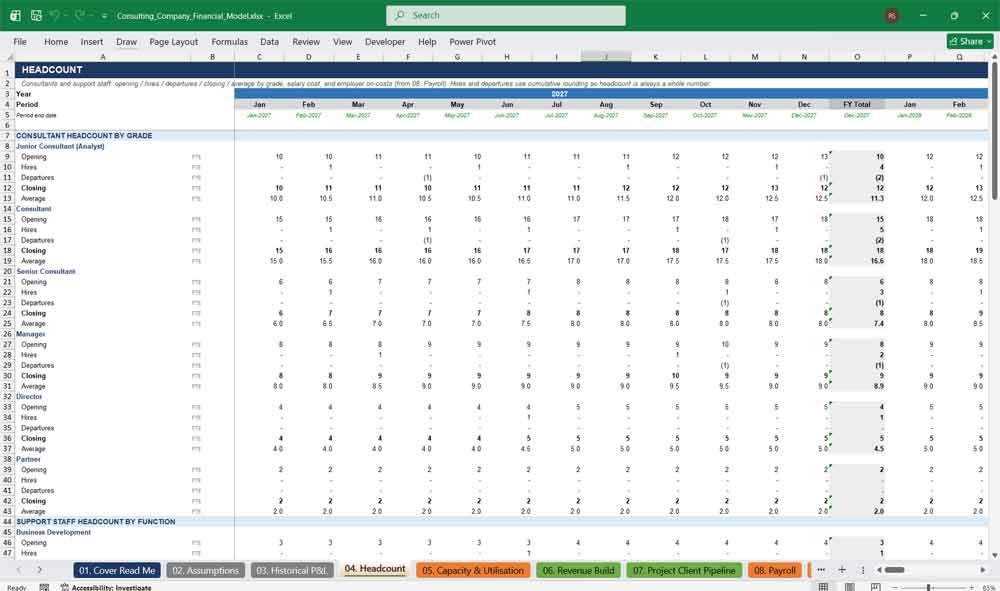
04. Headcount
Plan consultant and support headcount by grade with opening, hires, departures, closing and average FTE each month. Salary costs equal average headcount multiplied by average salary, with employer costs shown clearly, giving accurate workforce planning for professional services firms worldwide.
Highlights
- Roll-forward for six consultant grades and six support functions
- Whole-number hiring and attrition through cumulative rounding
- Consultant headcount summary table (opening, hires, departures, closing, average) for any model year
- Employer National Insurance, pension, healthcare, bonus, payroll taxes and other benefits summarised
05. Capacity & Utilisation
Convert working days into billable capacity. This tab deducts public holidays, annual leave and sickness absence, then applies utilisation targets by grade to calculate available days, billable days and billable hours, the operational engine behind every single consulting revenue forecast.
Highlights
- Working days calculated from the calendar, less public holidays
- Annual leave phased by calendar month, plus sickness allowance
- Utilisation targets by grade and year, adjusted by scenario
- Billable days, billable hours and blended utilisation totals
06. Revenue Build
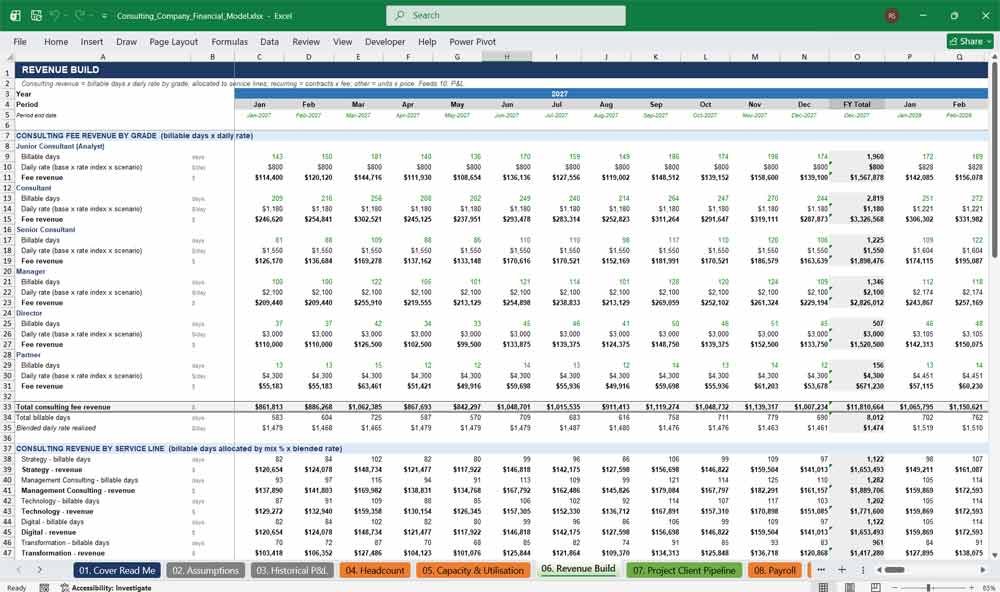
Build consulting revenue bottom-up: billable days multiplied by daily rates for each grade, allocated across eight consulting service lines, plus recurring managed services, retainers, support and maintenance, and other revenue such as training, workshops, assessments and licensing, each calculated separately.
Highlights
- Revenue by grade equals billable days multiplied by daily rate
- Eight consulting lines: Strategy, Management Consulting, Technology, Digital, Transformation, Data & Analytics, Risk and Operations
- Recurring lines driven by contracts and monthly fees
- Other lines driven by units and unit prices, with annual price escalation
07. Project Client Pipeline
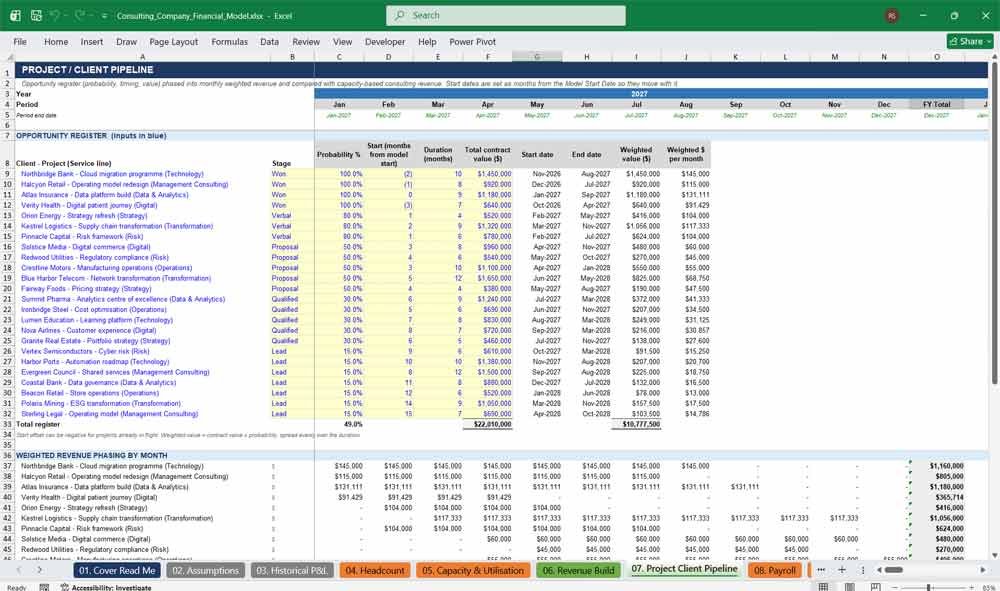
Track 24 client opportunities with probability, start offset, duration and contract value. The pipeline tab phases weighted revenue by month and measures pipeline coverage against forecast consulting revenue, showing exactly how much new work your consultancy still needs to win.
Highlights
- Opportunity register with stage, probability and contract value
- Start dates set as months from the model start so they move with it
- Monthly weighted revenue phasing
- Pipeline coverage percentage and revenue still to be won
08. Payroll
See the full cost of employing your people. Payroll calculates base salary, bonus, employer National Insurance, pension, healthcare, payroll taxes and other benefits for consultants and each support function, then maps every line straight into the correct P&L reporting category.
Highlights
- Bonus by grade and by support function
- Fully loaded cost for each support function
- Share-based compensation included in management costs
- Automatic mapping to P&L lines with a reconciliation check
09. Operating Expenses
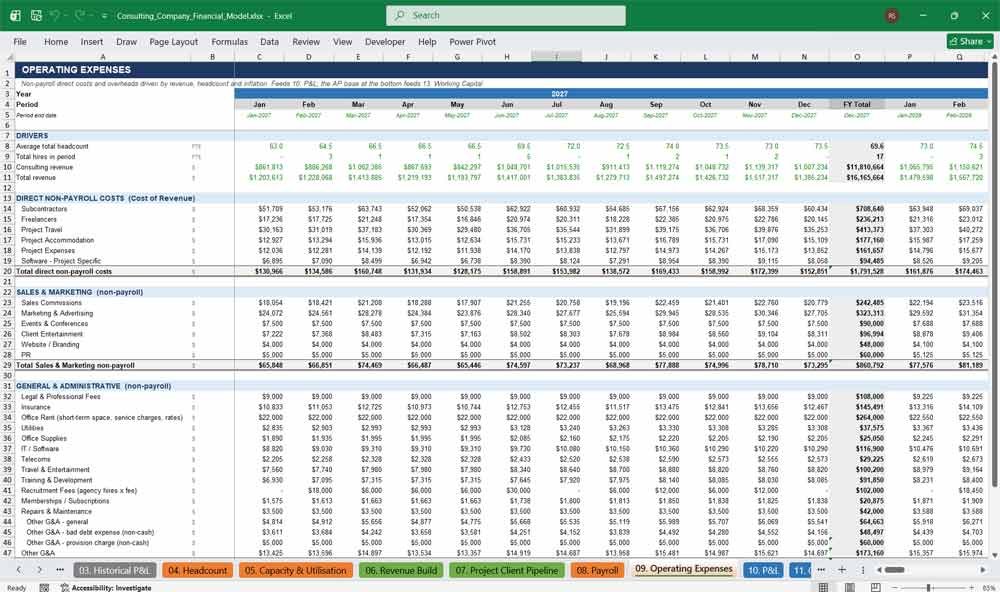
Model overheads and direct non-payroll costs with transparent drivers: subcontractors, freelancers, project travel, marketing, events, rent, IT, insurance, professional fees, recruitment and training. Costs scale automatically with revenue, headcount and inflation, keeping consulting profit forecasts realistic and easy to audit.
Highlights
- Direct costs driven by consulting revenue
- Per-head costs for utilities, IT, telecoms, travel and training
- Recruitment fees driven by hires
- Bad debt and provision charges built in
Consulting Financial Statements
10. P&L
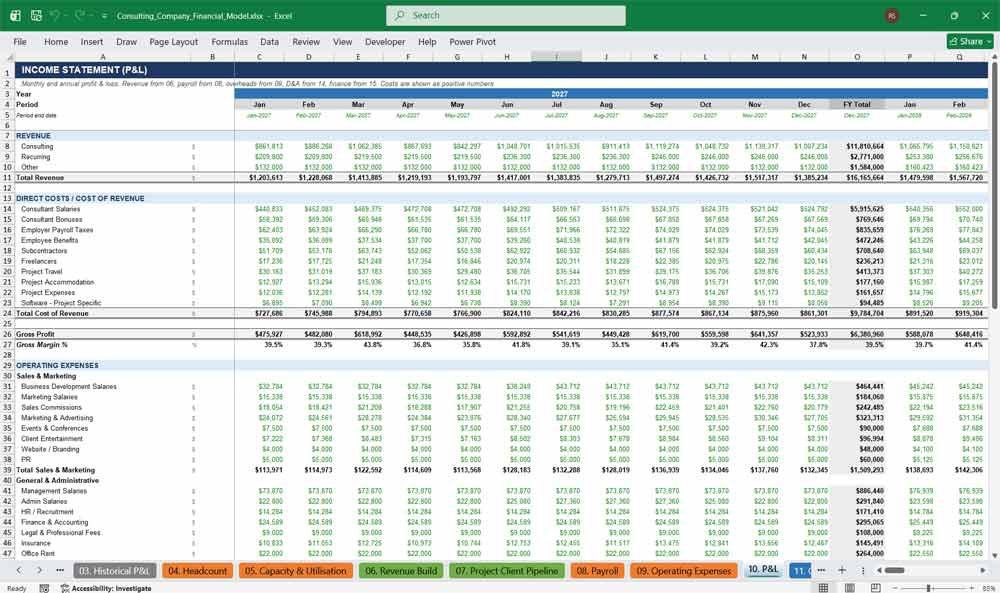
Review a complete monthly and annual income statement: revenue, cost of revenue, gross profit, operating expenses, EBITDA, depreciation, EBIT, finance costs, tax and net income, with gross, EBITDA and net margins calculated automatically for every month and every forecast year.
Highlights
- Cost of revenue split into salaries, bonuses, payroll taxes, benefits and project costs
- Sales & Marketing and General & Administrative sections
- EBITDA, EBIT, profit before tax and net income
- Corporation tax on year-to-date profit
11. Cash Flow
Understand where cash comes from and where it goes. The indirect cash flow statement reconciles net income through non-cash items and working capital to operating, investing and financing cash flows, delivering a reliable closing cash forecast for every single month.
Highlights
- Non-cash adjustments: depreciation, amortisation, share-based compensation and bad debt
- Nine working capital lines
- Interest and tax paid shown separately
- Free cash flow and cash conversion memo lines
12. Balance Sheet
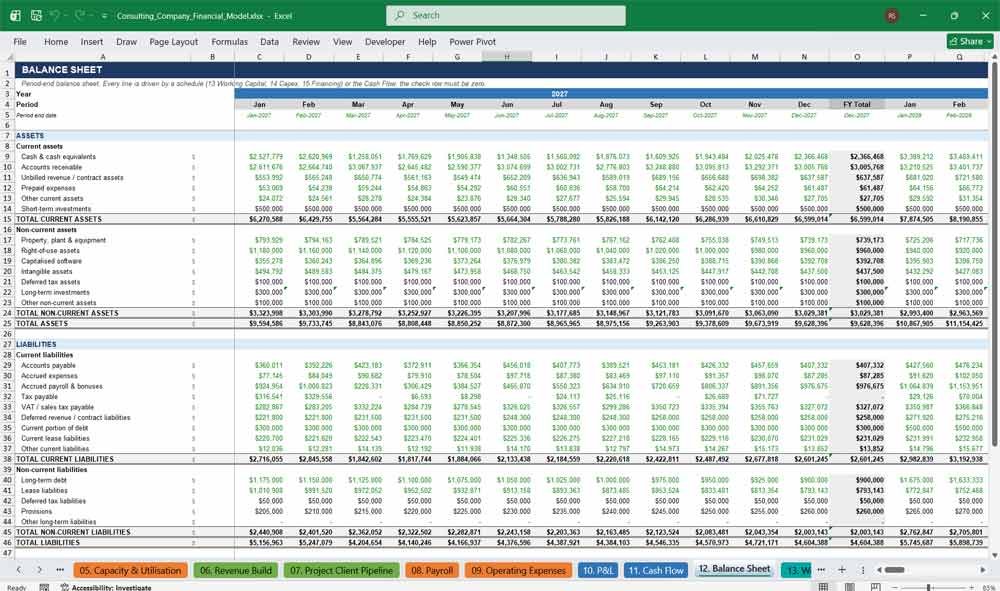
A fully integrated balance sheet with current and non-current assets, liabilities and equity. Every line links to a supporting schedule or the cash flow statement, and a built-in check row confirms assets equal liabilities plus equity in every single period.
Highlights
- Includes right-of-use assets, lease liabilities, deferred revenue and tax payable
- Retained earnings and current-year profit roll correctly
- Balance check for every month and year
- Cash linked directly to the cash flow statement
13. Working Capital
Forecast receivables, unbilled revenue, prepayments, payables, accruals, deferred revenue, VAT, bonus accruals and tax payable using debtor days, creditor days and payment timing drivers. Cash movements feed the cash flow statement automatically, so working capital never again needs manual re-keying.
Highlights
- Debtor days and creditor days drivers
- Bonus accrual paid in a chosen month
- Quarterly corporation tax instalments
- Net working capital as a percentage of revenue
14. Capex Depreciation
Plan fixed-asset purchases and depreciation for office equipment, IT, leasehold improvements, capitalised software and intangibles. Straight-line schedules cover opening assets and new additions, producing net book values and a right-of-use asset for your office lease, all feeding the financial statements.
Highlights
- New-starter IT kit linked to hiring
- Separate lives for opening assets and new additions
- Depreciation capped at net book value
- Feeds the P&L, cash flow and balance sheet
15. Financing
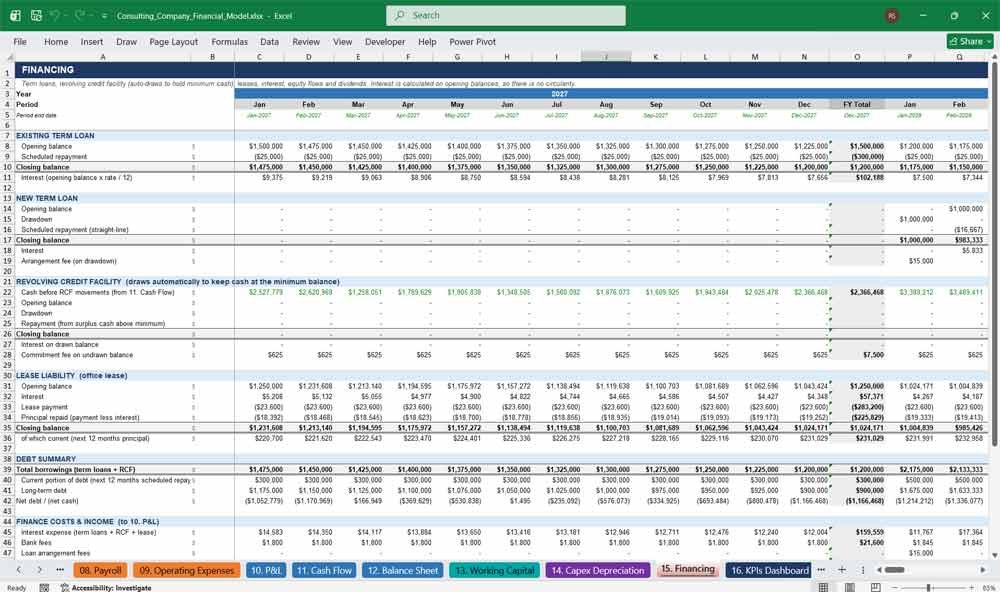
Model term loans, a revolving credit facility that automatically draws to maintain minimum cash, lease liabilities, interest, fees, equity issuance, buybacks and dividends. Interest uses opening balances, so the model avoids circular references and stays stable, fast and easily auditable.
Highlights
- Existing and new term loans with arrangement fees
- Automatic RCF draw and repayment around a minimum cash balance
- Lease liability with interest and principal split
- Dividends based on prior-year net income
16. KPIs Dashboard
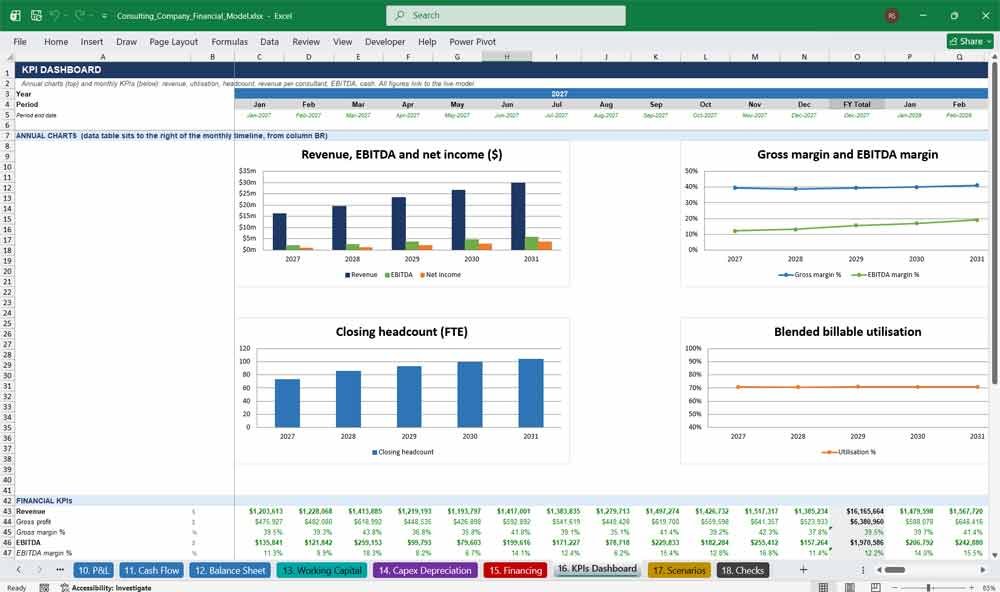
Monitor performance on one dashboard: revenue, utilisation, headcount, revenue per consultant, EBITDA, margins, cash and net debt. Six annual charts and monthly KPI tables update instantly with your assumptions and selected scenario, ready for monthly board packs and investor meetings.
Highlights
- Six annual charts for revenue, margins, headcount, utilisation, cash and revenue per consultant
- Monthly KPI tables with annual totals
- Payroll cost percentage and recurring revenue share
- Pipeline coverage and model-check status
Consulting Firm Key KPIs
17. Scenarios
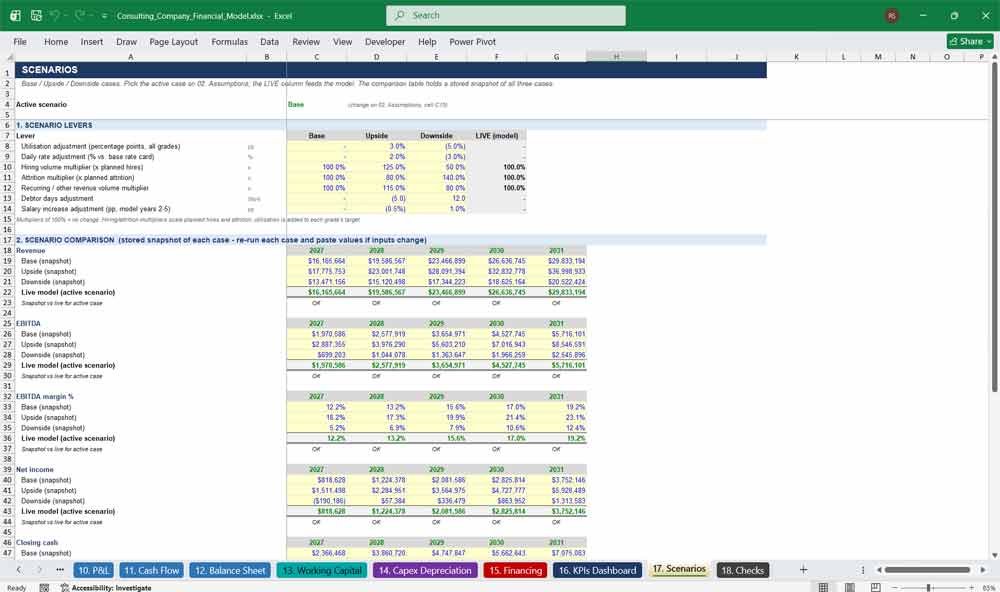
Compare Base, Upside and Downside cases using seven levers: utilisation, daily rates, hiring, attrition, revenue volumes, debtor days and salary inflation. Switch scenarios with one selector and see side-by-side results for five years, supporting confident budgeting and financial stress testing.
Highlights
- Seven editable scenario levers
- One-cell scenario selector on the Assumptions tab
- Stored comparison of revenue, EBITDA, net income, cash, headcount and utilisation
- Automatic flag when the comparison needs refreshing
18. Checks
Trust your numbers with automated integrity tests. Checks confirm the balance sheet balances, cash reconciles, revenue and payroll tie out, debt and depreciation schedules match and headcount rolls forward correctly, then flag any PASS or REVIEW status instantly for you.
Highlights
- More than 20 automated tests across every period
- Independent EBITDA cross-check
- Master PASS / REVIEW flag shown on the Cover
- Conditional formatting highlights errors in red
Consulting Frequently Asked Questions
What is this consulting financial model?
It is a ready-built Excel workbook that forecasts a consulting or professional services firm over five years, month by month, with an annual roll-up for each year. It also holds 24 months of monthly historical profit and loss data. It links headcount, utilisation, revenue, payroll, overheads, working capital, capex and financing into an integrated income statement, cash flow statement and balance sheet.
Who is this financial model for?
It suits owners and partners of consulting firms, finance directors, CFOs, fractional finance leads, business advisers, accountants and investors who need to plan hiring, pricing, utilisation and cash. It works for management, strategy, technology, digital, data, risk and operations consultancies, and for similar professional services businesses.
Do I need advanced Excel skills to use it?
No. Inputs are shown in blue text on a yellow background on the Assumptions tab, calculations are black and links from other tabs are green. If you can type numbers into cells and follow the tab order, you can operate the model. The Cover Read Me tab explains the layout, conventions and how to use it.
Does the model use macros, VBA or add-ins?
No. It contains no macros and no circular references, so there is nothing to enable and no security prompt. It relies on standard Excel functions such as SUMIFS, EDATE, EOMONTH, NETWORKDAYS and CHOOSE. It is designed for Microsoft Excel, and other spreadsheet applications that support these functions should also open it.
How does the start date feature work?
There is one Model Start Date input on the Assumptions tab. A master timeline drives every date, month header, year label, escalation, pipeline date and historical period in the workbook. Change the date and the whole model re-dates itself. Years are shown as calendar years such as 2027, 2028 and 2029, not Year 1 and Year 2.
Can I replace the illustrative numbers with my own data?
Yes. All figures are illustrative placeholders for a fictional firm. Overwrite the blue input cells on the Assumptions tab and the 24 months of actuals on the Historical P&L tab with your own numbers. Everything else recalculates automatically, and the Checks tab confirms that the schedules still tie together.
How is revenue calculated?
Consulting revenue is built bottom-up: average headcount by grade, less working-day deductions for public holidays, leave and absence, multiplied by utilisation gives billable days, and billable days multiplied by the daily rate for each grade gives fee revenue. That revenue is then allocated across eight consulting service lines, and recurring and other revenue lines are added separately.
Which consultant grades and service lines are included?
The model includes six consultant grades and six support functions. Revenue is split across eight consulting service lines, four recurring revenue lines and five other revenue lines. Names, rates, salaries and volumes are all editable inputs, so you can rename or re-price any line to match your own business.
Can I add more grades, service lines or opening balances?
The structure is fixed at the sizes listed above. You can rename any grade or line, and set unused ones to zero. Adding extra rows means extending the formulas that reference them, which is straightforward for an experienced Excel user but not automatic. This fixed structure is what keeps the model stable and auditable.
Is it a true three-statement model? Does the balance sheet balance?
Yes. The income statement, indirect cash flow statement and balance sheet are fully linked, and every balance sheet line ties to a cash flow line. The balance sheet check row shows zero in every month and year. Interest is calculated on opening balances, which avoids circular references.
Can I run scenarios and stress tests?
Yes. Choose Base, Upside or Downside with one selector on the Assumptions tab. Seven levers change utilisation, daily rates, hiring, attrition, revenue volumes, debtor days and salary inflation. The Scenarios tab holds a stored side-by-side comparison of the three cases, with a flag that tells you when it needs refreshing after you change inputs.
What integrity checks are built in?
There are 18 period checks plus four static checks. They test that the balance sheet balances, cash reconciles, revenue and payroll tie between tabs, depreciation and debt match their schedules, headcount rolls forward, dates are continuous and the RCF stays within its limit. A master PASS / REVIEW flag appears on the Cover tab.
What currency, tax and payroll terms does it use?
The model reports in US dollars. Payroll terms follow a UK-style structure, including employer National Insurance, pension, corporation tax and VAT, and all of them are adjustable through rates and inputs. You can set them to reflect your own jurisdiction’s employer costs and tax rate.
Can I view annual results only?
Yes. Each year has 12 monthly columns followed by an annual total column. Month columns are grouped, so you can use the outline buttons above the sheet to collapse the model to an annual view or expand it to monthly detail. The KPI Dashboard also shows annual charts.
Can I use it for fundraising, bank lending or budgeting?
It is well suited to budgets, reforecasts, hiring plans, investor or lender packs and board reporting, and it includes term loans, a revolving credit facility, leases, equity and dividends. You remain responsible for the assumptions you enter, and the model is a planning tool, not financial, tax or legal advice.
Final Notes on the Financial Model
- Profitability Focus: This Consulting Company Financial Model should help your company aim for high-margin revenue streams (retainers and subscriptions) and aids:
- Cash Flow Management: Keep an eye on accounts receivable to avoid cash shortages.
- Scalability Strategy: Automate low-tier services to keep operational costs low.
- Long-Term Sustainability: Because investing in branding, client loyalty, and technology to enhance efficiency leads to long-term stability.
Download Link On Next Page