
Beverages Manufacturer Financial Model Excel Template
This beverage manufacturer financial model is a fully-linked Excel template built for beverage brands, bottlers, and CPG founders who need investor-ready financial projections without building a model from scratch. Covering three years of historical financials and a seven-year operating forecast, the template models everything from SKU-level volume and channel pricing to unit economics, manufacturing capacity, headcount, working capital, debt financing, and a complete three-statement build — P&L, balance sheet, and cash flow — that ties out to the penny. Whether you’re raising a seed round, pitching a private equity buyer, or building your annual budget, this beverage industry financial model gives you a professional, audit-ready foundation in minutes, not weeks.
Financial Model For A Beverage Manufacturer
Every date in this financial model template flows from a single input cell — change the historical start date on the Assumptions tab, and all 18 tabs, thousands of linked formulas, and every monthly and annual column across the ten-year timeline recalculate automatically. Built with SKU-level detail across core, zero-sugar, and sparkling product lines and three distribution channels — retail/grocery, on-premise/foodservice, and D2C/e-commerce — the model includes a live Downside/Base/Upside scenario switch, a revolver and cash-sweep financing mechanic, and a dedicated Checks tab that confirms the balance sheet balances and cash flow reconciles in every single period.
Whether you’re a beverage startup founder preparing a pitch deck, a financial analyst building a budget model, an investor underwriting a beverage industry acquisition, or a student learning three-statement modeling, this Excel financial model template saves dozens of hours of build time. Every tab is color-coded, every input is clearly flagged, and every formula is fully auditable — no hidden macros, no black boxes. Download the beverage manufacturer financial model today and walk into your next fundraising conversation, board meeting, or acquisition analysis with a model built the way professional dealmakers build them.
Beverage Model Tab-by-Tab Highlights
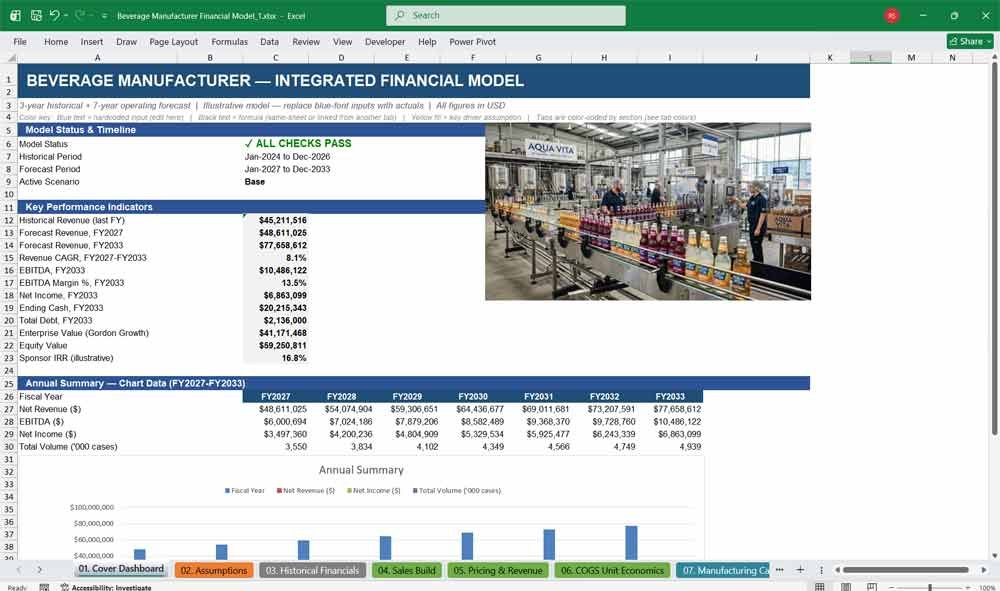
01. Cover Dashboard
The Cover Dashboard gives investors and executives an instant snapshot of your beverage company’s financial health — key revenue, EBITDA, margin, and cash KPIs, live charts, and a one-glance model-status indicator, all pulled automatically from the underlying seven-year financial forecast.
- Live KPI cards: revenue, EBITDA margin, net income, cash, debt, and enterprise value
- Auto-updating revenue, EBITDA, and volume trend charts
- One-click model health indicator linked to the Checks tab
- Historical vs. forecast period summary and active scenario readout
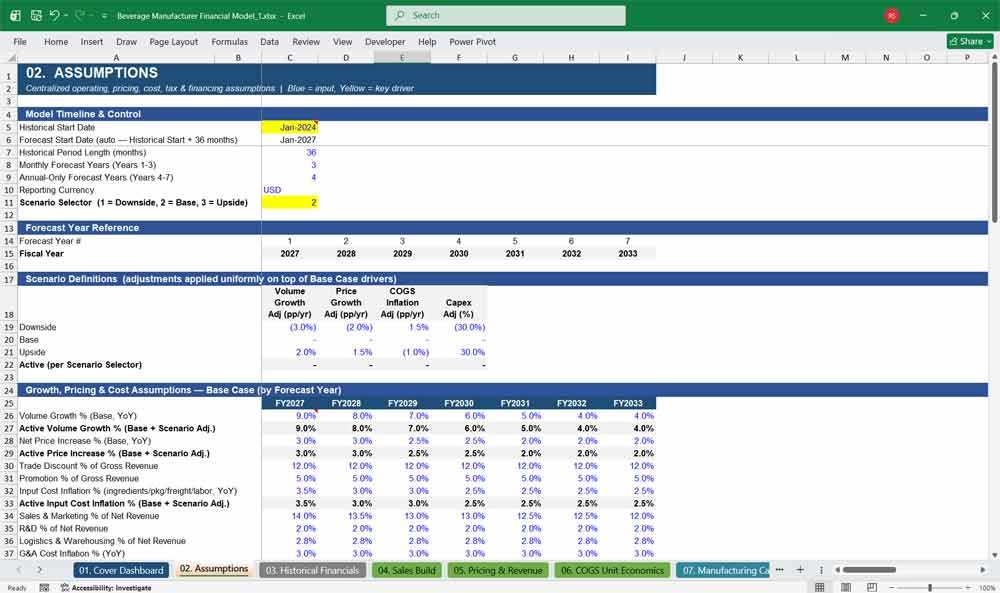
02. Assumptions
The Assumptions tab centralizes every driver behind your beverage manufacturer financial model — pricing, volume growth, cost inflation, headcount, capex, tax, and financing — in one place, plus a dynamic start-date engine and a live Downside, Base, and Upside scenario switch.
- Single start-date cell drives every date across all 18 tabs
- Built-in Downside / Base / Upside scenario toggle
- SKU-level volume and pricing assumptions for 3 product lines
- Centralized tax, WACC, and financing assumptions for easy sensitivity testing
Beverages Manufacturer Financial Pricing & Expenses
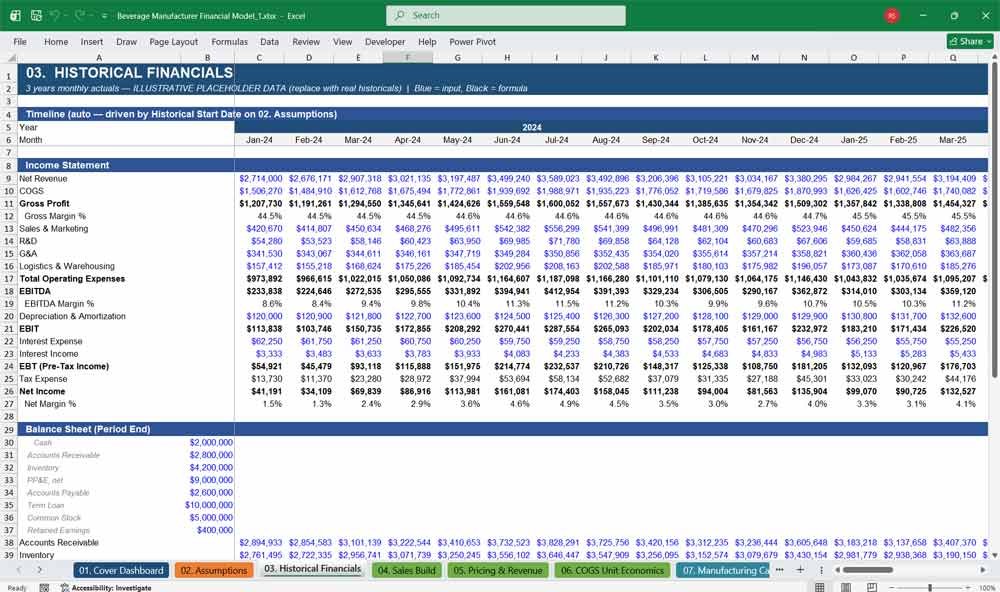
03. Historical Financials
Three years of monthly historical P&L and balance sheet data give your beverage financial model real operating context, showing revenue, gross margin, and cash trends investors expect to review before evaluating your seven-year growth forecast and projections.
- 36 months of historical revenue, COGS, opex, and net income
- Self-balancing historical balance sheet — assets equal liabilities plus equity, every month
- Feeds directly into forecast opening balances for seamless continuity
- Fully editable — swap in your company’s real historical actuals
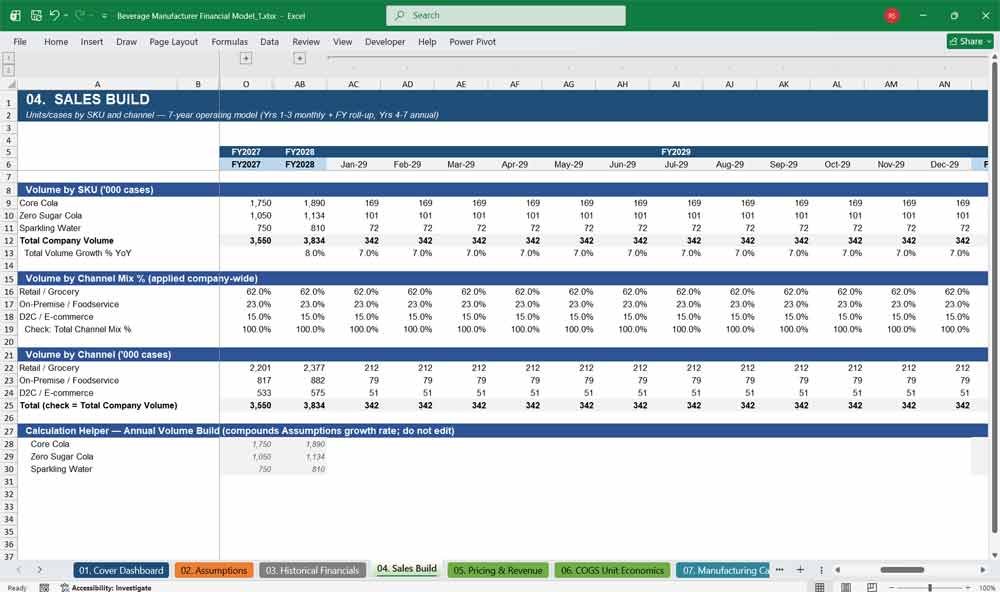
04. Sales Build
The Sales Build tab models unit volume by SKU — core cola, zero-sugar cola, and sparkling water — and by distribution channel across retail, on-premise, and D2C, giving beverage brands a granular, defensible volume forecast for pricing and capacity planning.
- Volume by SKU across 3 core beverage product lines
- Channel mix modeling across retail, on-premise, and D2C/e-commerce
- Automatic year-over-year volume growth tracking
- Fully linked to the Manufacturing Capacity and Pricing & Revenue tabs
05. Pricing & Revenue
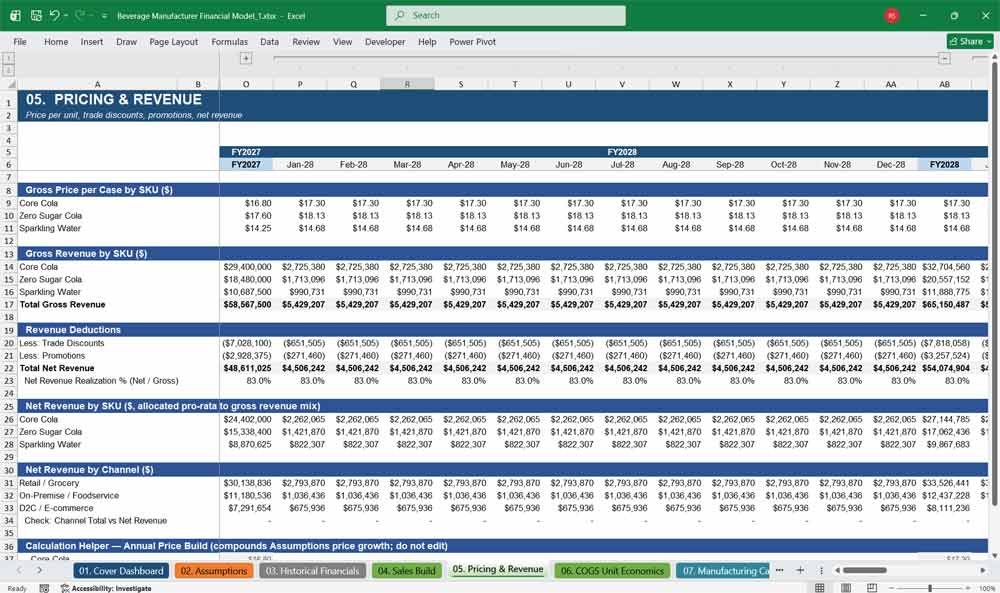
This tab converts unit volume into net revenue, modeling gross price per case, trade discounts, and promotional spend by SKU and channel — the exact revenue waterfall investors, lenders, and acquirers expect from a beverage manufacturer financial model.
- Price-per-case build with automatic annual price escalation
- Trade discount and promotion deductions down to net revenue
- Revenue reconciliation cross-checked by SKU and by channel
- Net revenue realization % tracked automatically
06. COGS Unit Economics
COGS Unit Economics breaks beverage manufacturing costs down per case — ingredients, packaging, direct labor, co-manufacturing fees, and freight — so you can defend gross margin assumptions with the same rigor institutional buyers expect during financial due diligence.
- Per-case cost build across 5 cost components
- Automatic input cost inflation modeling by year
- Gross profit and gross margin % calculated automatically
- Directly supports pricing and profitability sensitivity analysis
07. Manufacturing Capacity
Manufacturing Capacity models production line count, rated capacity, planned downtime, and utilization — flagging exactly when your beverage brand approaches capacity constraints so you can plan capex and plant expansion before growth outpaces your production footprint and lines.
- Installed vs. effective capacity after planned downtime
- Automatic utilization % tracking with color-coded status flags
- Early warning signals for capacity-constrained growth years
- Supports capex and plant-expansion conversations with lenders and investors
08. Operating Expenses
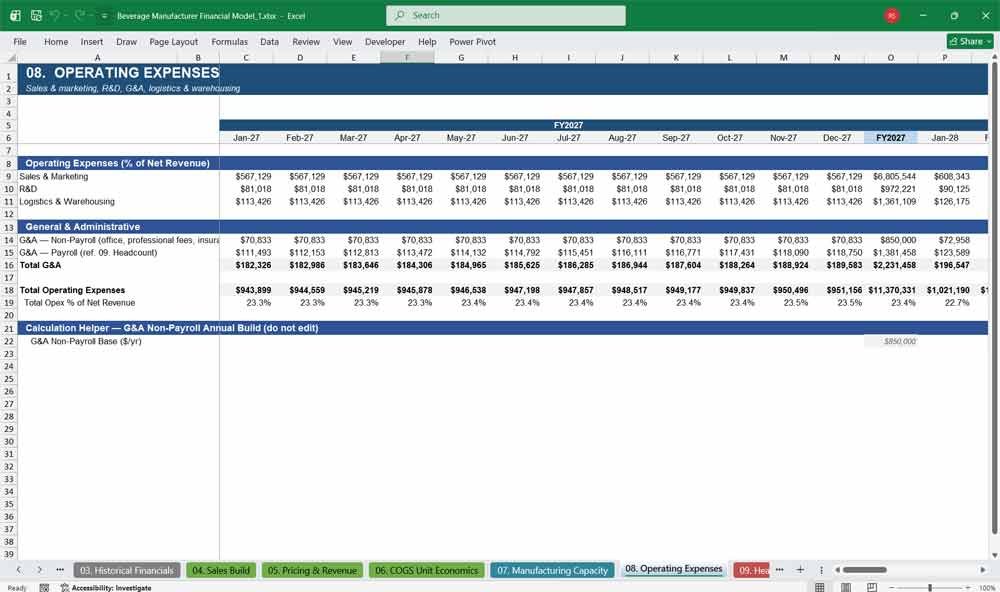
The Operating Expenses tab models sales and marketing, R&D, G&A, and logistics and warehousing costs as a percentage of revenue or fixed base — giving your beverage financial model a realistic, scalable operating cost structure that stands up to investor scrutiny.
- S&M, R&D, logistics, and G&A modeled independently
- G&A payroll linked directly to the Headcount tab
- Total opex as % of revenue tracked automatically
- Fully editable cost assumptions, year by year
09. Headcount
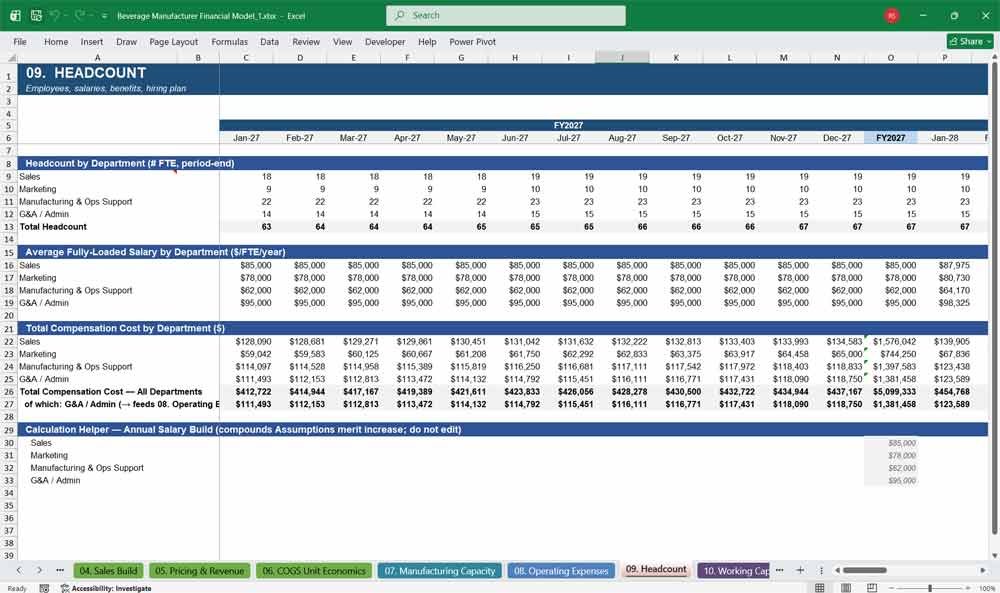
Headcount plans employees, fully-loaded salaries, and hiring by department — sales, marketing, manufacturing support, and G&A — with automatic annual merit increases, giving your beverage company a realistic people-cost build for fundraising, budgeting, and board conversations.
- Department-level headcount roll-forward with a hiring plan assumption
- Fully-loaded salary escalation by year
- G&A payroll cost flows directly into Operating Expenses
- Structured to avoid double-counting with manufacturing labor already in COGS
Beverages Manufacturer Revenues & Cash Flow
10. Working Capital
Working Capital models accounts receivable, inventory, and accounts payable using DSO, DIO, and DPO day assumptions — the same operating metrics lenders and investors use to stress-test a beverage manufacturer’s cash conversion cycle, liquidity, and short-term funding needs.
- DSO / DIO / DPO-driven balance calculations
- Net working capital and period-over-period change tracked automatically
- Feeds directly into the cash flow statement
- Fully adjustable working capital policy assumptions
11. Capex & PP&E
Capex and PP&E models maintenance and growth capital expenditures alongside straight-line depreciation, rolling forward your beverage company’s plant and equipment balance — a critical input for manufacturers planning new bottling lines, warehouse space, or added production capacity.
- Maintenance and growth capex modeled separately, both tied to revenue
- Automatic straight-line depreciation and PP&E roll-forward
- Directly feeds EBIT, cash flow, and the balance sheet
- Supports capital planning for line expansion or new facilities
12. Debt Financing
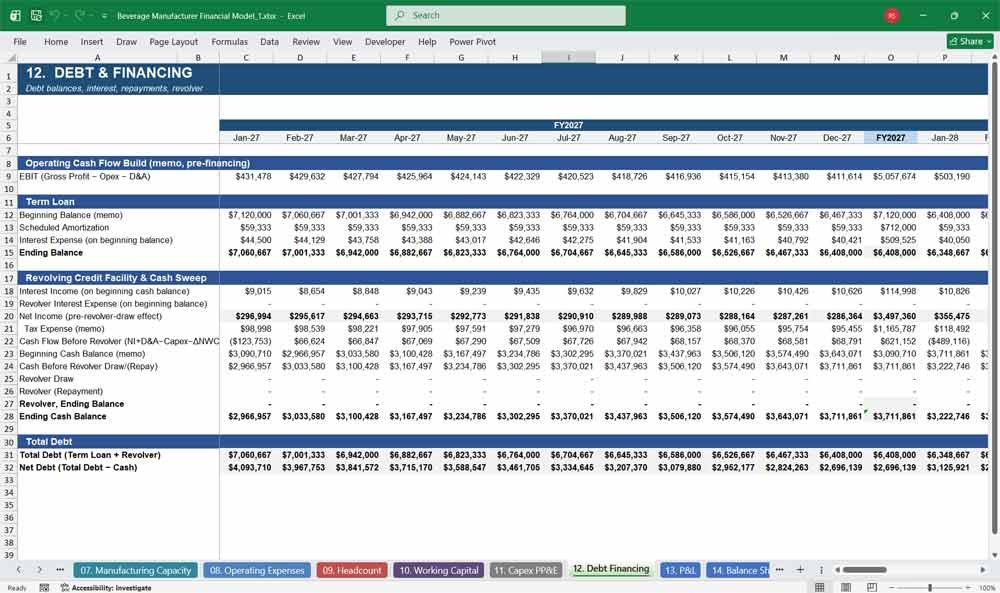
Debt Financing models a term loan amortization schedule and a revolving credit facility with an automatic cash-sweep mechanic — giving your beverage financial model realistic, circularity-free financing dynamics that lenders and private equity buyers will recognize immediately as credible.
- Term loan schedule with scheduled amortization and interest expense
- Revolver draw/repay mechanic tied to a minimum cash target
- Circularity-free interest calculation (built on beginning balances)
- Net debt tracked automatically for valuation and returns analysis
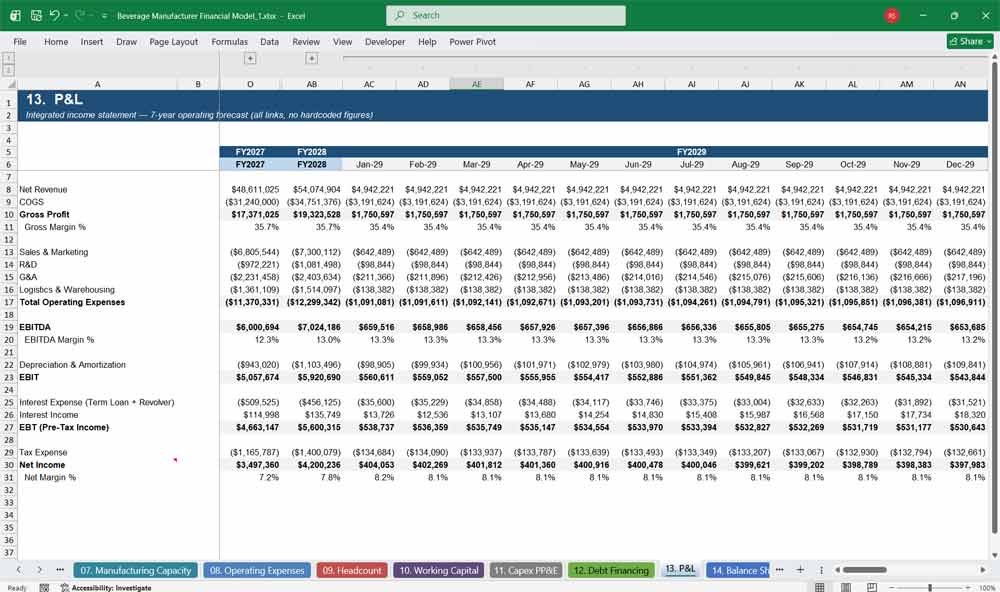
13. P&L
The integrated P&L consolidates revenue, COGS, opex, D&A, interest, and tax into a clean income statement — every line fully linked back to its driver tab, so your beverage manufacturer financial model never relies on a single hardcoded number.
- Fully linked income statement from revenue down to net income
- EBITDA and net margin % calculated automatically
- Zero hardcoded figures — 100% formula-driven
- Investor-ready format for pitch decks and board reporting
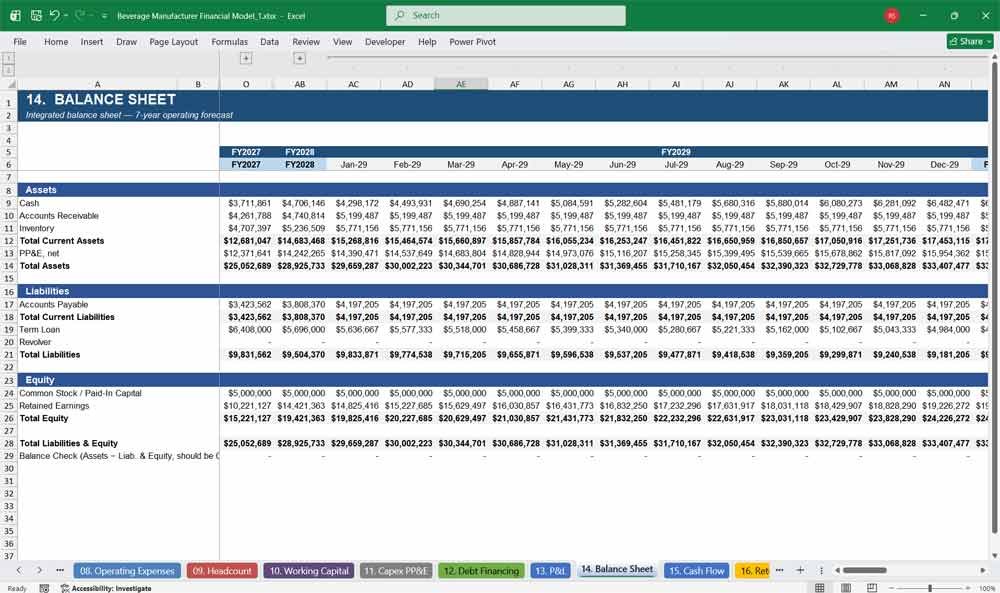
14. Balance Sheet
The integrated Balance Sheet rolls forward cash, receivables, inventory, PP&E, debt, and equity every period — with a built-in balance check confirming assets always equal liabilities plus equity, exactly what due diligence teams verify first in any financial model.
- Full balance sheet roll-forward, every period, automatically
- Built-in balance check — ties to zero across all 43 periods
- Retained earnings automatically rolled forward from net income
- Seamless linkage from historical actuals into the forecast
15. Cash Flow
The Cash Flow statement presents operating, investing, and financing cash flows using the indirect method, reconciling directly to the balance sheet cash balance — giving your beverage manufacturer financial model the audit-ready cash flow rigor that investors and lenders expect.
- Indirect-method CFO, CFI, and CFF fully linked to driver tabs
- Automatic reconciliation check against the balance sheet cash balance
- Clear visibility into capex, debt service, and working capital swings
- Beginning and ending cash tracked every period
Key Financial Metrics for a Beverage Manufacturer
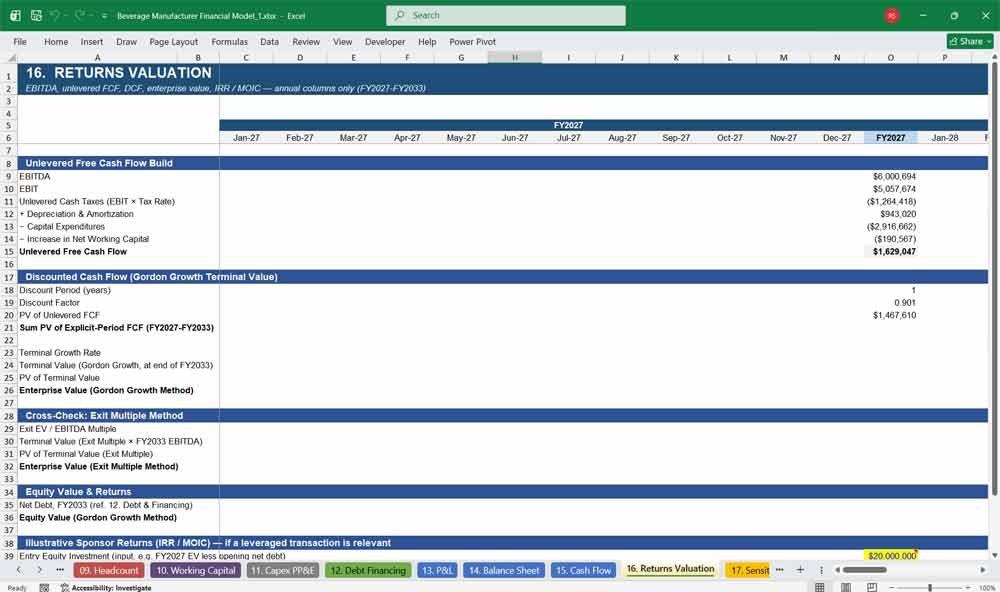
16. Returns Valuation
Returns Valuation calculates unlevered free cash flow, a full DCF with Gordon Growth and exit-multiple terminal value methods, enterprise value, equity value, and illustrative IRR and MOIC — the exact valuation toolkit investors and acquirers use to price a beverage manufacturer.
- Unlevered FCF build with automatic cash tax adjustment
- Dual terminal value methods: Gordon Growth and exit multiple
- Enterprise value, equity value, and net debt bridge
- Illustrative sponsor IRR and MOIC calculator
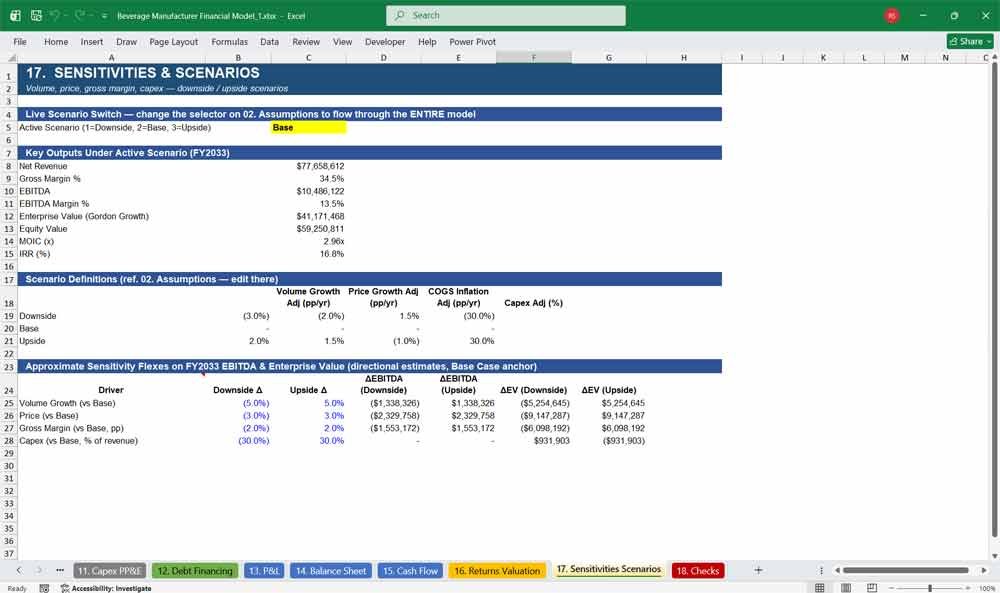
17. Sensitivities & Scenarios
Sensitivities and Scenarios includes a live Downside, Base, and Upside toggle that flows through the entire beverage financial model instantly, plus directional sensitivity flexes showing how volume, price, gross margin, and capex changes move EBITDA and enterprise value.
- Live scenario switch — one cell updates all 18 tabs
- Downside / Base / Upside cases pre-built and fully editable
- Directional sensitivity flexes on EBITDA and enterprise value
- Instantly see how volume, price, or margin shifts affect valuation
18. Checks
The Checks tab is your quality-control dashboard, confirming the balance sheet balances, cash flow reconciles, and revenue and volume cross-foot correctly in every one of forty-three periods — giving buyers total confidence this beverage financial model is error-free.
- Balance sheet and cash flow integrity checks, every period
- Revenue and volume cross-footing checks
- One-glance “All Checks Pass” model status indicator
- Maximum error tracking for full transparency
Valuing Your Beverages Manufacturing With A DCF
Discounted Cash Flow (DCF): Valuing the “High-Volume, Liquid” Cash Engine
A beverage manufacturing business—whether focused on carbonated soft drinks, bottled water, juices, or alcoholic beverages—generates cash flows through a combination of production volume, pricing power, brand equity, and distribution efficiency. The DCF analysis for such a manufacturer typically projects unlevered free cash flows over a 10-15 year horizon, incorporating assumptions about revenue growth (driven by volume and price/mix), gross margin evolution (impacted by input costs like aluminum, PET plastic, sugar, and freight), and working capital requirements. Given the consumer staples nature of many beverage categories, cash flows often demonstrate resilience through economic cycles, though category-specific trends (health consciousness, premiumization, or regulatory pressures on sugar) must be carefully modeled. Terminal value is typically calculated using a perpetuity growth method (2%–3%) or an EBITDA multiple approach, with the latter benchmarked against observable consumer packaged goods transactions in the 8×–15× EBITDA range depending on brand strength and growth profile.
WACC: Pricing Brand Stability and the “Sugar and Aluminum Beta”
The weighted average cost of capital for a beverage manufacturer reflects its positioning within the consumer staples or consumer discretionary spectrum, with corresponding implications for systematic risk. The cost of equity is typically derived using CAPM, with betas ranging from 0.5 to 0.9 for established players with diversified brand portfolios and stable market share, reflecting their defensive characteristics. Smaller, high-growth craft beverage companies or those focused on emerging categories may command higher betas (1.1–1.4) due to greater earnings volatility and execution risk. The cost of debt reflects corporate borrowing rates, typically 4%–7% for investment-grade producers and 7%–12% for smaller or levered players, with capital structures often targeting 30%–50% debt leverage. The WACC must also account for geographic diversification—a beverage manufacturer with significant emerging market exposure may carry a higher cost of equity to reflect currency, regulatory, and macroeconomic volatility.
Sensitivity Analysis: Stress-Testing the “Thirst for Margin”
Sensitivity analysis for beverage manufacturer valuation centers on the key operational and market variables that drive profitability and competitive position. The most critical sensitivities typically include gross margin pressure from input cost volatility (aluminum, resin, sugar, glass, and freight costs can swing 10%–30% annually), volume growth assumptions (reflecting category trends, market share dynamics, and competitive intensity), and pricing power (ability to pass through cost inflation without sacrificing volume). Standard analysis employs two-way data tables and tornado charts to visualize how changes in revenue growth (e.g., 2%–8%), operating margins (10%–20%), and discount rates simultaneously impact enterprise value. Given that beverage manufacturers often trade at premiums to broader consumer staples due to brand intangible value and recurring consumption patterns, sensitivity testing must confirm whether implied valuations remain within market-accepted ranges under scenarios of intensified private label competition, regulatory interventions (sugar taxes or packaging restrictions), or supply chain disruptions affecting key ingredients or packaging materials.
Why Buy This Model
Building a three-statement financial model for a beverage manufacturer from scratch typically takes twenty to forty hours, even for an experienced analyst — sourcing the right cost structure, building a circularity-free debt schedule, and making sure the balance sheet actually balances. This template does that work for you. It isn’t a generic SaaS or e-commerce model with beverage labels slapped on top — it’s purpose-built around SKU-level volume, channel mix, unit economics, manufacturing capacity, and the working capital and capex dynamics specific to beverage production. Every formula is transparent and auditable, every date is dynamically linked to a single control cell, and a dedicated Checks tab proves the model ties out before you ever present it to a lender, investor, or board. Whether you’re fundraising, budgeting, valuing an acquisition, or teaching financial modeling, this template gives you a professional foundation you can trust — and fully customize to your own numbers — in an afternoon instead of a month.
Beverage Manufacturing Frequently Asked Questions
What version of Excel do I need to open this model?
The model is a standard .xlsx file built with formulas compatible with Excel 2016 and later (including Microsoft 365) and LibreOffice Calc. No macros, add-ins, or special plugins are required.
Is this model specific to a real beverage company, or is it a template?
It’s a fully-built template populated with illustrative, placeholder figures — SKU volumes, pricing, costs, headcount, and more — so you can see exactly how a beverage manufacturer’s financials should look. Every blue-font input cell is designed for you to replace with your own company’s real numbers.
How do I update the model with my own company’s numbers?
Start on the 02. Assumptions tab — every blue-font cell is an editable input covering pricing, volume, cost, tax, and financing assumptions. Historical actuals are entered on the Historical Financials tab. Because every formula is linked, updating these inputs automatically flows through all 18 tabs.
Can I change the start date or the number of years the model covers?
Yes. Change the Historical Start Date on the Assumptions tab and every date across all 18 tabs and 43 forecast columns updates automatically. For clean fiscal-year alignment, set it to January 1 of your desired start year.
Does the balance sheet actually balance?
Yes. The model includes a dedicated Checks tab that verifies the balance sheet balances, cash flow reconciles, and revenue and volume cross-foot correctly in every one of the 43 forecast periods, so you can confirm model integrity with one glance before presenting it.
I’m not modeling exactly 3 SKUs or 3 channels — can I add more?
Yes. The Sales Build and Pricing & Revenue tabs are structured so you can insert additional SKU or channel rows and extend the existing formulas across them, following the same pattern used throughout the rest of the model.
Does this model include a valuation or DCF?
Yes. The Returns Valuation tab includes a full unlevered discounted cash flow with both Gordon Growth and exit-multiple terminal value methods, enterprise value, equity value, and an illustrative IRR/MOIC calculator for sponsor returns.
Can I use this for a real fundraise or bank loan application?
Yes — that’s exactly what it’s built for. The model follows standard three-statement modeling conventions, including color-coded inputs, fully linked formulas, and no hardcoded figures, that investors, lenders, and private equity buyers expect to see in due diligence.
Will this work for a beverage company that isn’t exactly like the example — beer, coffee, spirits, or non-alcoholic drinks?
Yes. The underlying structure — SKU/channel volume, unit economics, manufacturing capacity, and a full three-statement build — applies to any beverage manufacturer or CPG brand with a production and distribution model. Simply update the SKU names, cost inputs, and assumptions to match your product category.
Is there scenario or sensitivity analysis included?
Yes. The Assumptions tab includes a live Downside, Base, and Upside scenario switch that flows through the entire model instantly, and the Sensitivities & Scenarios tab shows the estimated EBITDA and enterprise value impact of changes in volume, price, gross margin, and capex.
What if I get stuck customizing the model?
Every tab includes clear labeling, color-coded cells — blue for inputs, black for formulas — and cell comments explaining key assumptions and calculation logic, so you can follow the model’s structure even if you’re not a professional financial modeler.
Key Financial Ratios & Metrics
- Gross Profit Margin = (Revenue – COGS) / Revenue
- Operating Margin = Operating Profit / Revenue
- EBITDA Margin = (Earnings Before Interest, Taxes, Depreciation, and Amortization) / Revenue
- Current Ratio = Current Assets / Current Liabilities
- Debt-to-Equity Ratio = Total Debt / Shareholder’s Equity
- Return on Investment (ROI) = Net Profit / Investment Cost
Scenario Analysis
- Best Case: High subscription retention, strong retail demand, cost efficiency.
- Base Case: Steady sales growth with manageable costs.
- Worst Case: Supply chain disruptions, high churn, increased competition.
Conclusion
These Excel financial models for a beverage manufacturer must balance product variety, cost structure, and revenue channels. By incorporating retail sales, bulk distribution, and a 6-tier subscription model, the business can stabilize cash flow and achieve long-term growth