
Battery Storage Financial Model
20-Year Financial Model for a Battery Storage (BESS).
This very extensive 20-year, 3-statement BESS Model involves detailed revenue projections, cost structures, and capital expenditures. This model provides a thorough understanding of the financial viability, profitability, and cash flow position of your battery storage finances. Covers Capacity Degradation, Depreciation Loss Percentages and Battery Storage Depreciation Value. Includes: 20x Income Statements, Cash Flow Statements, Balance Sheets, CAPEX sheets, OPEX Sheets, Statement Summary Sheets, and Revenue Forecasting Charts with the revenue streams, BEA charts, sales summary charts, employee salary tabs and expenses sheets. Follow this link if you sell products for BESS storage, Grid-Scale Energy Storage Containers, BESS Cabinets, Liquid Cooling Cabinets, for a dedicated model
Editable Revenue within the Model
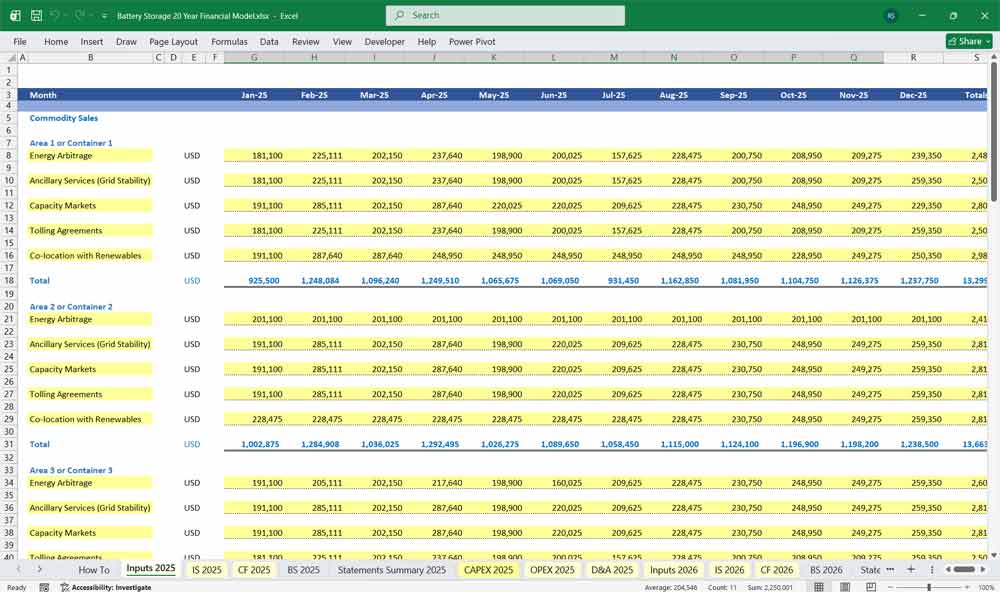
Energy Arbitrage Revenue
Energy arbitrage revenue arises from charging the battery during low-price periods and discharging during high-price periods.
Revenue is driven by:
Hourly or sub-hourly price spreads
Effective usable energy capacity after degradation
Round-trip efficiency losses
Annual number of cycles
Gross arbitrage revenue is calculated based on discharged energy multiplied by the price differential. Charging costs (energy purchased) are deducted to arrive at net arbitrage revenue. As the battery degrades, usable energy capacity declines, directly reducing arbitrage revenue over time.
Ancillary Services Revenue (Grid Stability)
Ancillary services revenue comes from providing services such as:
Frequency regulation
Spinning reserve
Voltage support
Fast frequency response
Revenue may be:
Capacity-based (availability payments)
Performance-based (accuracy and response speed)
Energy-based (limited energy dispatch)
These revenues depend primarily on power capacity (MW), not energy capacity (MWh), and therefore degrade more slowly than arbitrage revenues. However, severe degradation or inverter limitations can reduce available capacity and performance scores.
Capacity Market Revenue
Capacity markets pay the BESS for being available during system stress events.
Revenue drivers include:
Accredited capacity (MW)
Capacity auction clearing prices
Derating factors applied by system operators
Forced outage rates
Capacity degradation reduces accredited capacity over time, leading to a gradual decline in capacity revenues unless augmentation is performed.
Tolling Agreement Revenue
Under tolling agreements, a third party controls the dispatch of the battery and pays a fixed or semi-fixed fee.
Revenue characteristics:
Stable, predictable cash flow
Often indexed to inflation
Limited exposure to merchant price risk
Tolling revenues are usually based on contracted power and energy availability, with penalties for non-performance due to degradation or outages.
Co-location with Renewables Revenue
Does your Battery Storage work with Co-located BESS systems to generate additional value?
Storing curtailed renewable energy
Increasing capture of high-price periods
Avoiding grid export constraints
Improving renewable project PPA value
Revenue is derived from:
Incremental energy sales
PPA price uplift
Reduced curtailment losses
Shared interconnection savings
Editable revenues that are highly dependent on renewable generation profiles and grid congestion patterns.
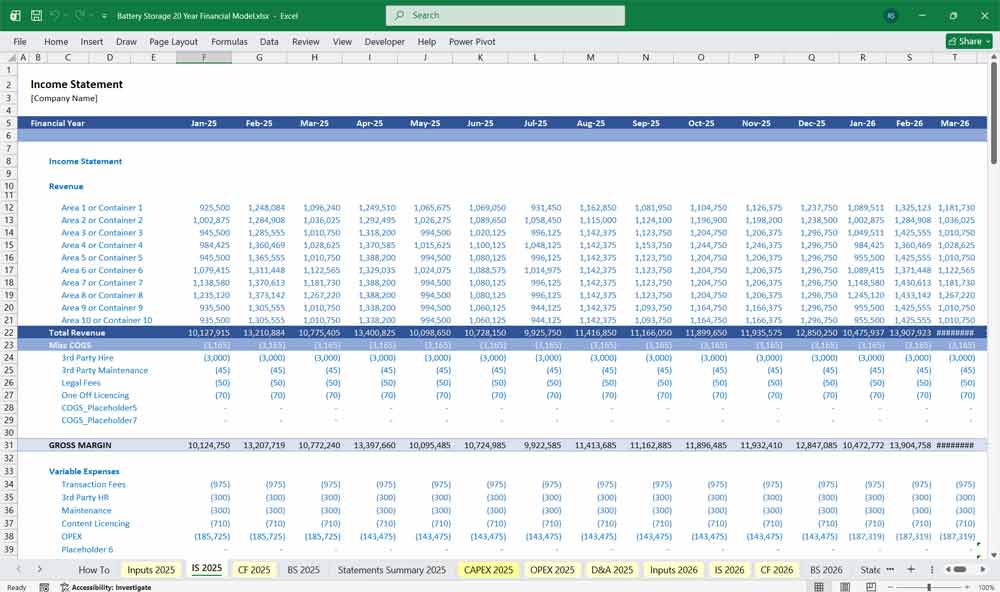
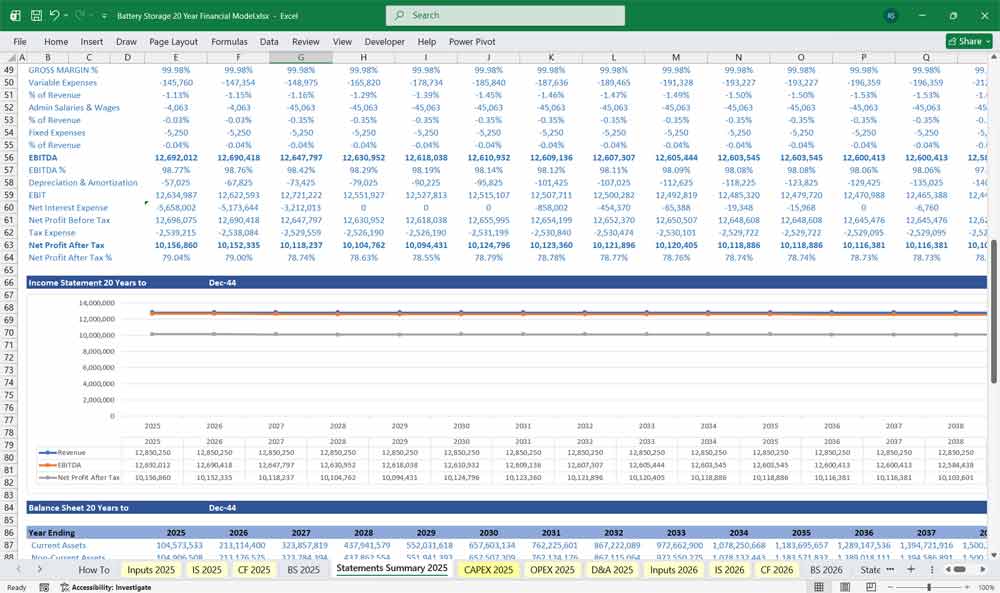
Income Statement
The Income Statement reflects annual profitability.
Key components:
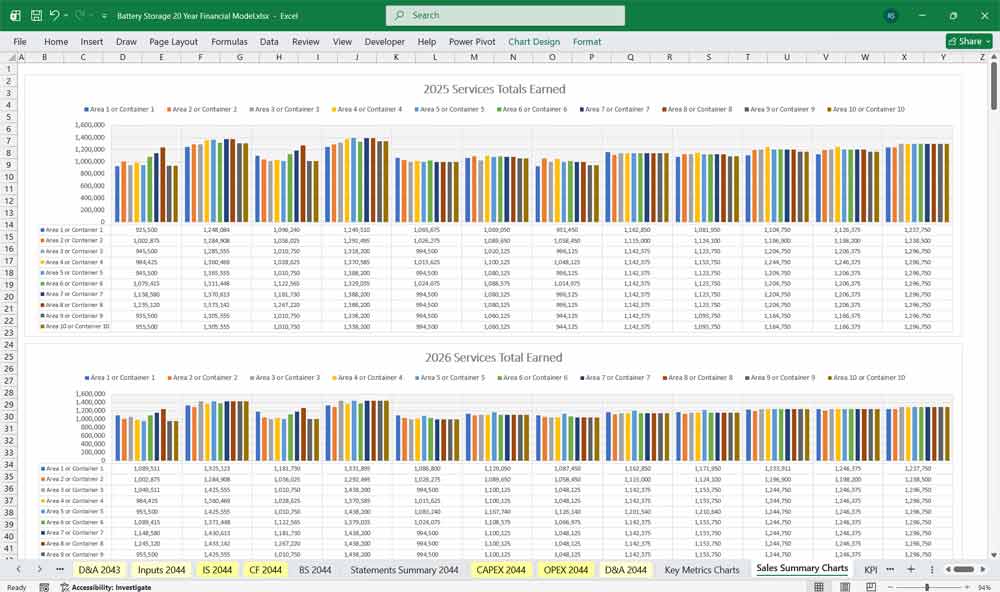
Total Revenue from all revenue streams
Less energy purchase costs
Less fixed and variable operating expenses
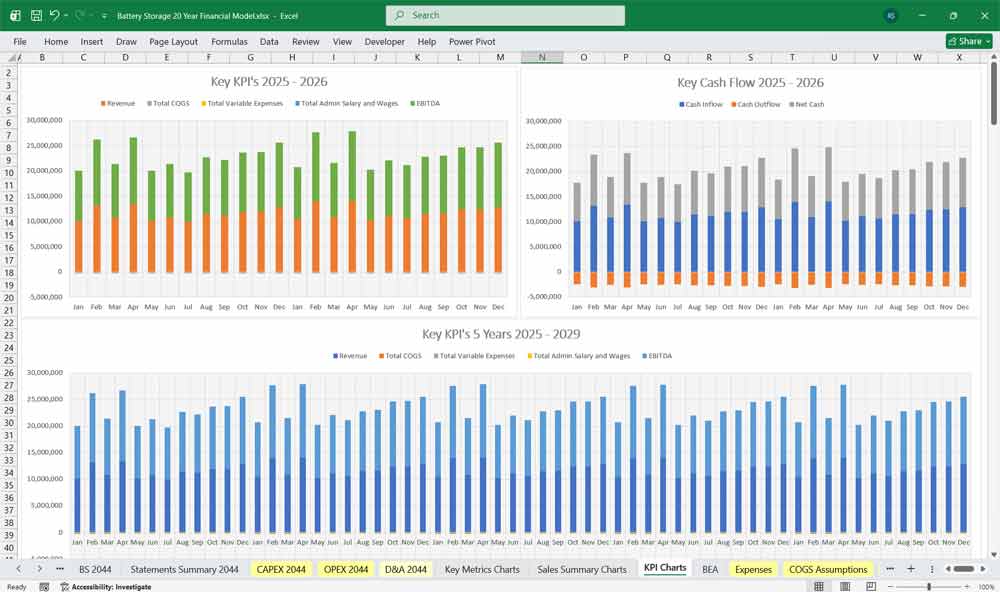
Earnings Before Interest, Taxes, Depreciation, and Amortization (EBITDA)
Less depreciation
Earnings Before Interest and Taxes (EBIT)
Less interest expense
Earnings Before Tax (EBT)
Less taxes
Net Income
Degradation reduces revenue over time, while depreciation remains fixed unless asset augmentation is modeled.
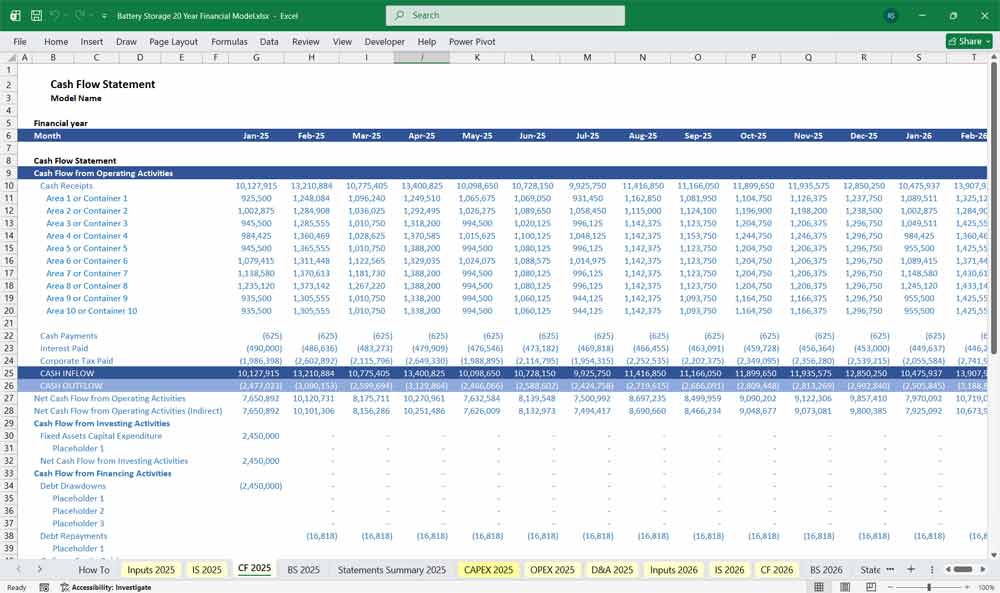
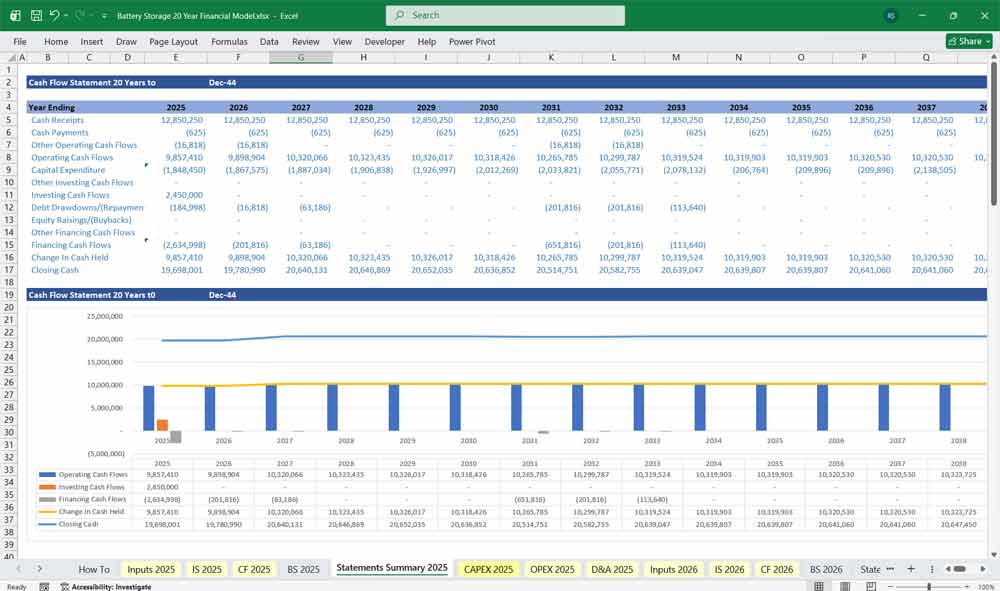
Battery Storage Cash Flow Statement
The Cash Flow Statement tracks liquidity.
7.1 Operating Cash Flow
Includes:
EBITDA
Less cash taxes
Plus/minus working capital changes
Operating cash flow declines over time due to degradation unless offset by price escalation or augmentation.
Investing Cash Flow
Includes:
Initial capital expenditure
Battery augmentation or replacement costs
End-of-life decommissioning costs
Residual or salvage value (if any)
Financing Cash Flow
Includes:
Debt drawdowns
Debt principal repayments
Interest payments
Equity injections
Dividends or distributions
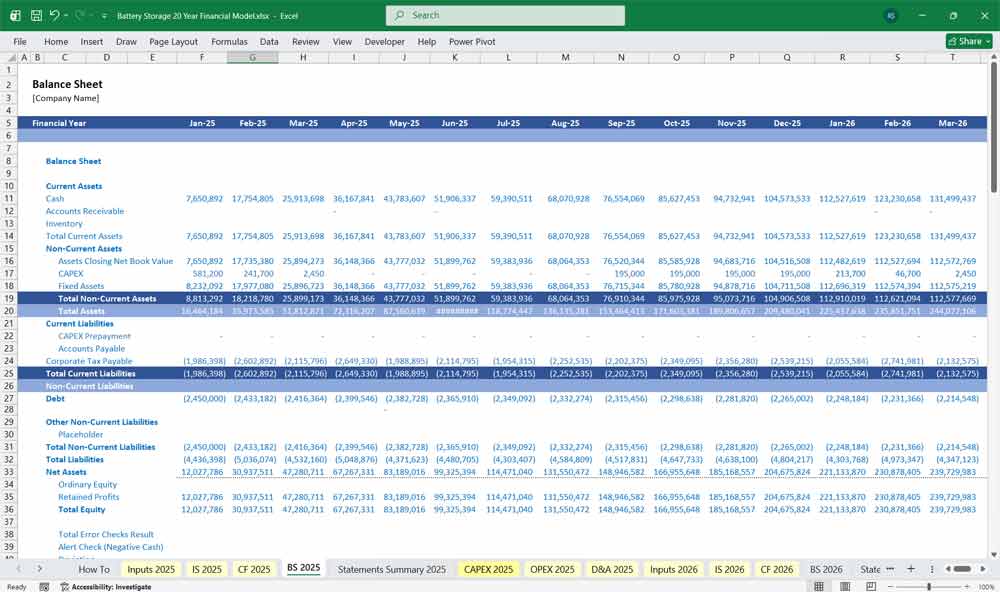
Battery Storage Balance Sheet
The Balance Sheet reflects the financial position.
8.1 Assets
Net fixed assets (CAPEX minus accumulated depreciation)
Cash and cash equivalents
Accounts receivable
Restricted reserves (DSRA, maintenance reserve)
Liabilities
Long-term debt
Current portion of debt
Accounts payable
Accrued operating expenses
Equity
Paid-in capital
Retained earnings
Current year net income
As depreciation accumulates and debt amortizes, equity increases if the project remains profitable.
Key Financial Outputs For A Battery Storage Energy System (BESS)
The model typically produces:
Project IRR and Equity IRR
Net Present Value (NPV)
Debt Service Coverage Ratio (DSCR)
Payback period
Sensitivity to price spreads, degradation, and CAPEX
Capacity Degradation and Efficiency Loss
Capacity Degradation
Battery capacity degrades due to cycling and calendar aging.
Typical assumptions:
Annual degradation rate: 1.5%–3.0%
End-of-life capacity: 60%–80% of original
Degradation applied to usable MWh capacity
Degradation impacts:
Reduced arbitrage volumes
Reduced capacity market accreditation
Lower ancillary service availability
Potential contract penalties
Monitor Efficiency Loss
Round-trip efficiency may decline slightly over time.
Typical assumption:
Initial efficiency: 88%–92%
Annual efficiency loss: 1%–3%
Monitor these increases in charging costs and view how they reduce net arbitrage margins.
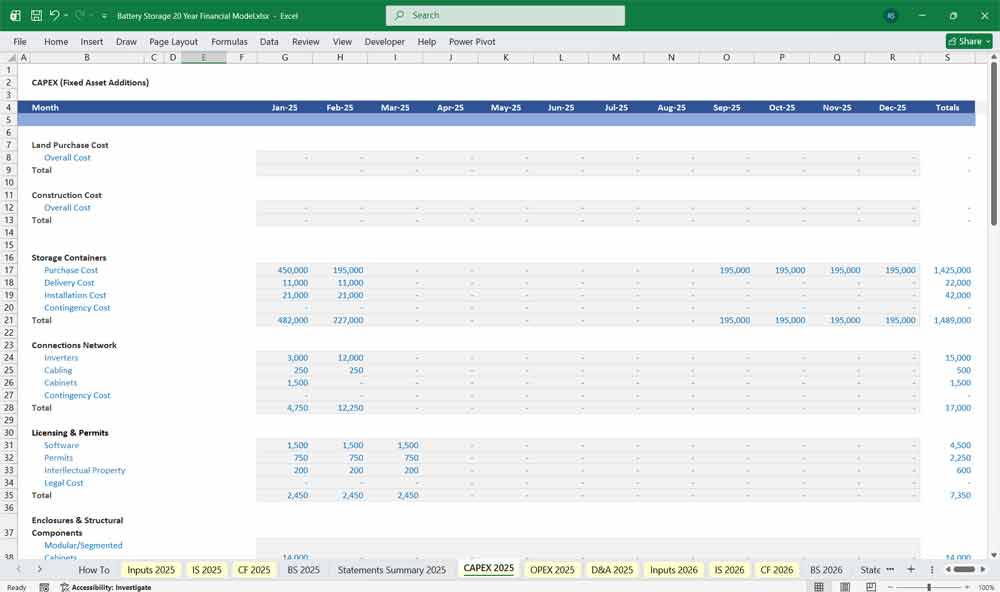
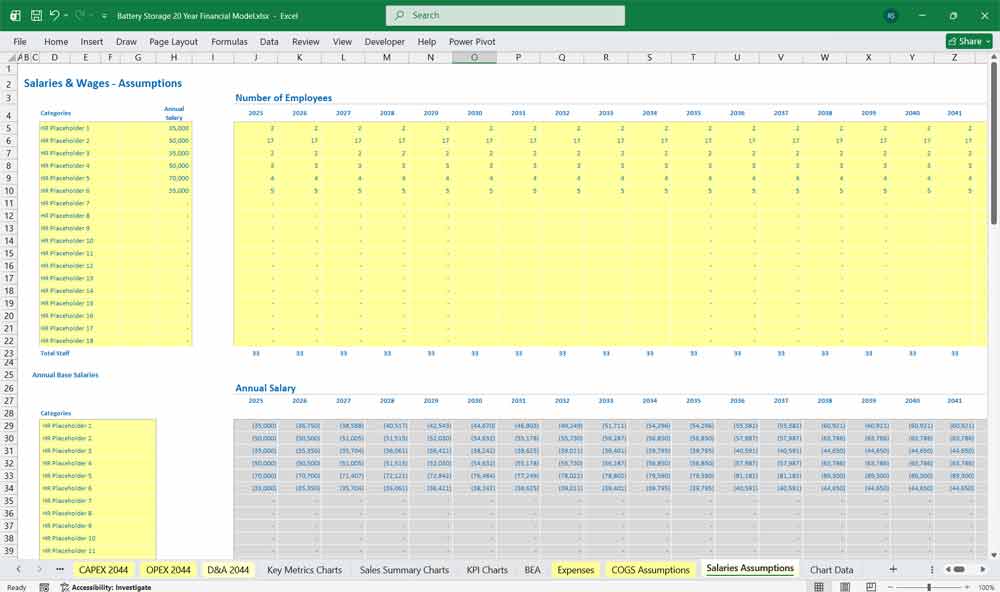
Battery Storage Financial Model Operating Costs
Fixed Operating Expenses
Fixed O&M costs include:
Site lease
Asset management
Software and EMS licenses
Insurance
Monitoring and reporting
These costs are usually escalated annually by inflation.
Variable Operating Expenses
Variable costs depend on usage and include:
Energy losses due to inefficiency
Maintenance tied to cycling
Degradation-related replacement reserves
Performance penalties
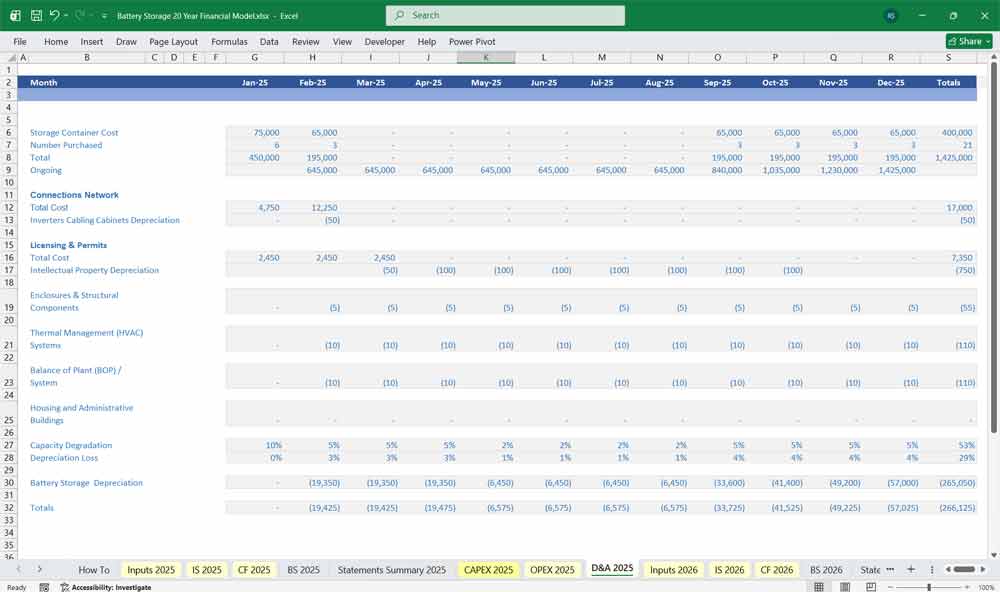
Dedicated Depreciation & Amortization Tab For A Battery Storage Model
View Depreciation and Depreciation Loss Percentages
Depreciation
Editable BESS assets depreciated
Capacity Degradation
- Depreciation Loss Percentage
Battery Storage Depreciation)
- Networking Inverters Cabling Cabinets
- Enclosures & Structural Components
- Intellectual Property Depreciation
- Thermal Management (HVAC) Systems
- Balance of Plant (BOP) / System
Typical depreciation life:
10–15 years for batteries
20–25 years for balance-of-plant and civil works
Battery Storage Financial Model: Advantages of Up to 20 Year Model
A 20-year financial model gives a BESS owner the ability to plan around long product lifecycles and extended contract horizons. In both domestic and commercial industries. Commercial contracts can span 15–20 years, and equipment lifespans often exceed two decades. A long-term model ensures that capital investment decisions—like designing and constructing new products or expanding production capacity—are aligned with the revenue and cash flow timelines they are meant to serve.
Offers A Closer Look At Battery Storage Investments
Long-range modeling allows management to capture the full return on R&D and innovation investments. In the Modular Battery Energy Storage System (BESS), new material systems or manufacturing processes can take years to develop, certify, and commercialize. A 20-year horizon shows not only the upfront development costs but also the long-term payoff in reduced production costs, expanded product lines, and higher market share over time.
Up To 20 Years Of Battery Storage Projections
With 20 years of projections, the business can stress test market and technology scenarios. For example, a 20-year model can incorporate demand surges from programs, downturns from slowdowns, or disruptions from competing materials. This long view supports more resilient strategic planning by highlighting how different economic cycles and technological shifts affect profitability and cash flow across decades.


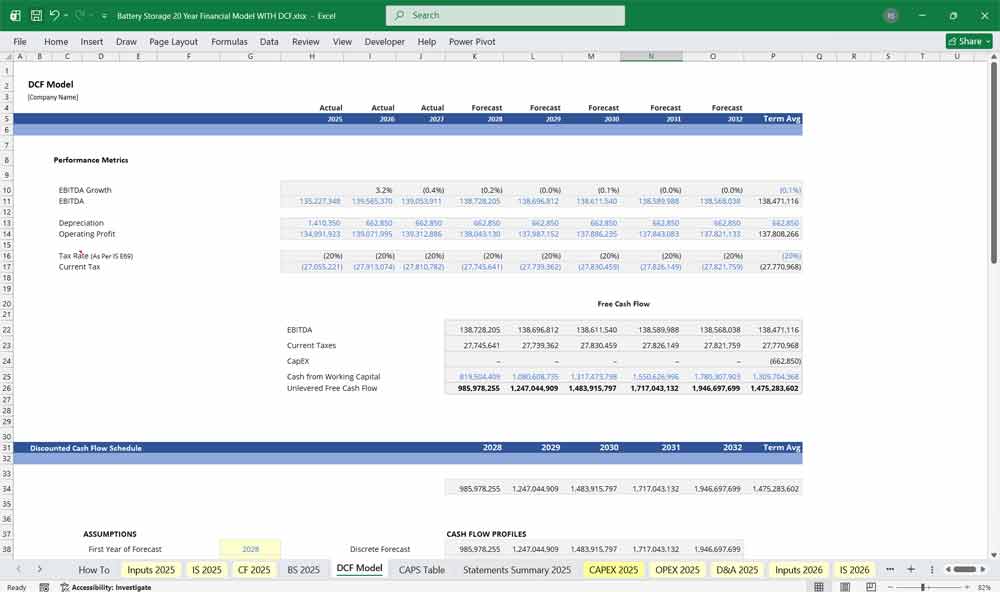
Battery Storage Discounted Cash Flow (DCF) with Terminal Value, Sensitivity Analysis, and WACC Model add-on
DCF (Discounted Cash Flow) for a BESS
The DCF (Discounted Cash Flow) (5-year forecast period for high-growth, detailed projections) model add-on is a valuation that estimates what your Battery Storage is worth today based on its projected future cash flows. The principle is that money you receive in the future is worth less than money you have now. This helps find the present value; you “discount” those future cash flows back to today using a specific rate.
WACC for a BESS
WACC (Weighted Average Cost of Capital) is the discount rate used in a DCF for your Battery Storage. It represents the average cost of raising money from all sources—both equity (shareholders) and debt (lenders). A higher WACC means future cash flows are worth less in today’s terms, leading to a lower valuation. It’s the “hurdle rate” a company must clear to create value.
Sensitivity Analysis for a BESS
Battery Storage Sensitivity Analysis is a “what-if” tool that tests how much the DCF valuation changes when you alter its key assumptions, like the WACC or long-term growth rate. Instead of a single valuation number, it produces a range of outcomes, showing which inputs the model’s result is most sensitive to. This helps identify the biggest risks and provides a more robust, realistic valuation range.
Final Notes on the Financial Model
This 20 Year Battery Storage Financial Model focuses on balancing capital expenditures and Capacity Degradation Depreciation Loss Percentage, against steady revenue growth from a diversified product line. By optimizing operational costs, and power efficiency, and maximizing high-margin sales, the models ensure sustainable profitability and cash flow stability.
Download Link On Next Page
Download Link On Next Page