
Architect DCF Financial Model Template
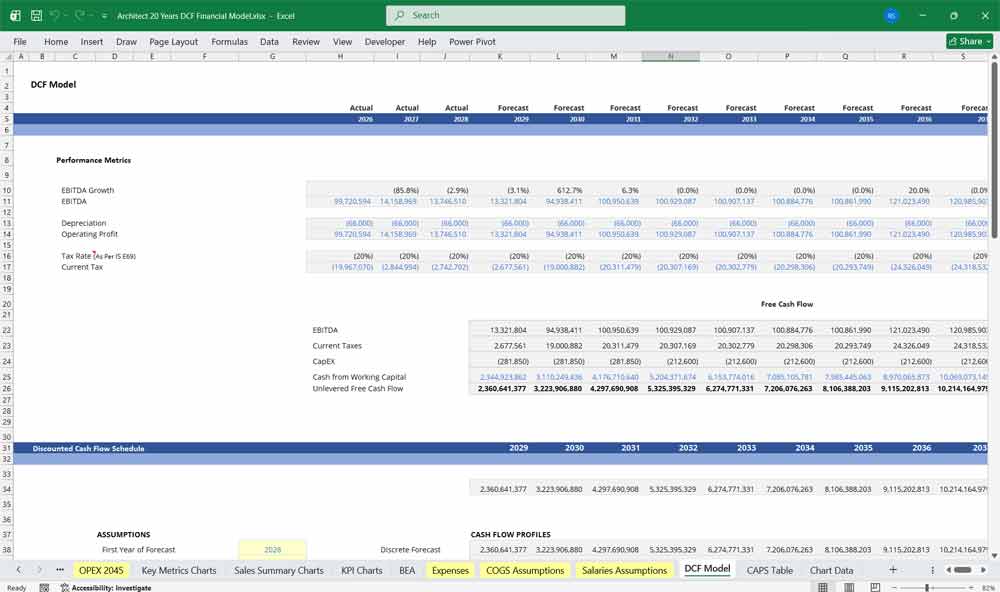
This 20-Year, 3-Statement Excel Architect DCF Financial Model Template includes revenue streams from Architectural Design Services to Interior Design Services, project management and master planning. Cost structures and financial statements, Discounted Cash Flow (DCF) with Terminal Value, Sensitivity Analysis, WACC, NPV, and IRR to forecast the financial health of your Architect business.
20-Year Financial Model for an Architect
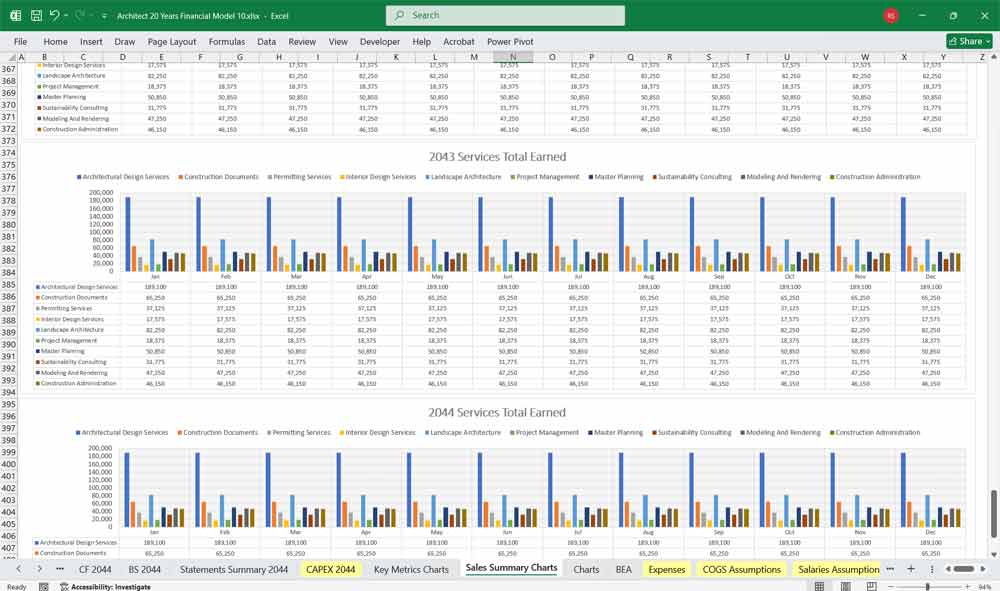
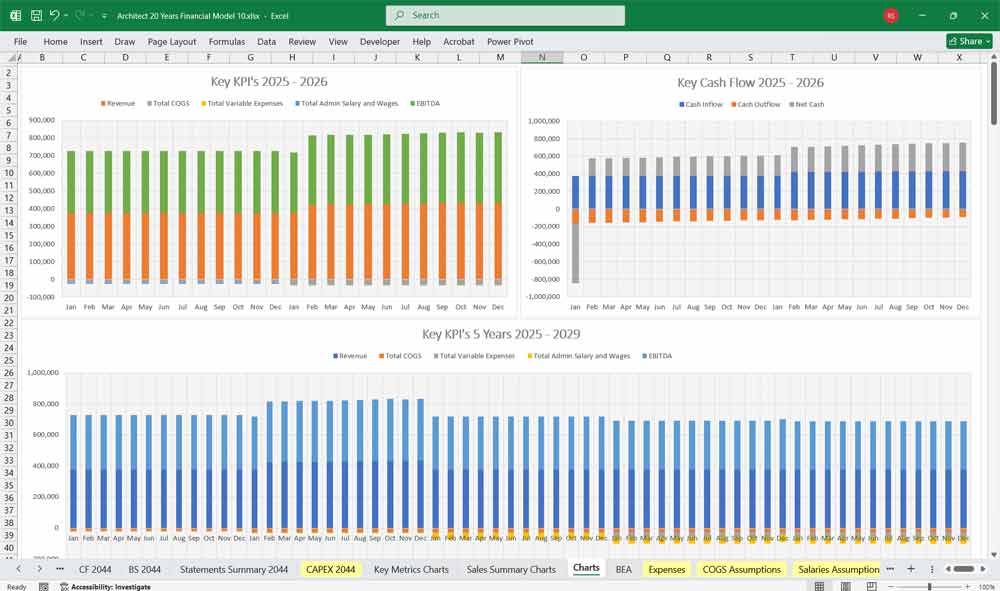
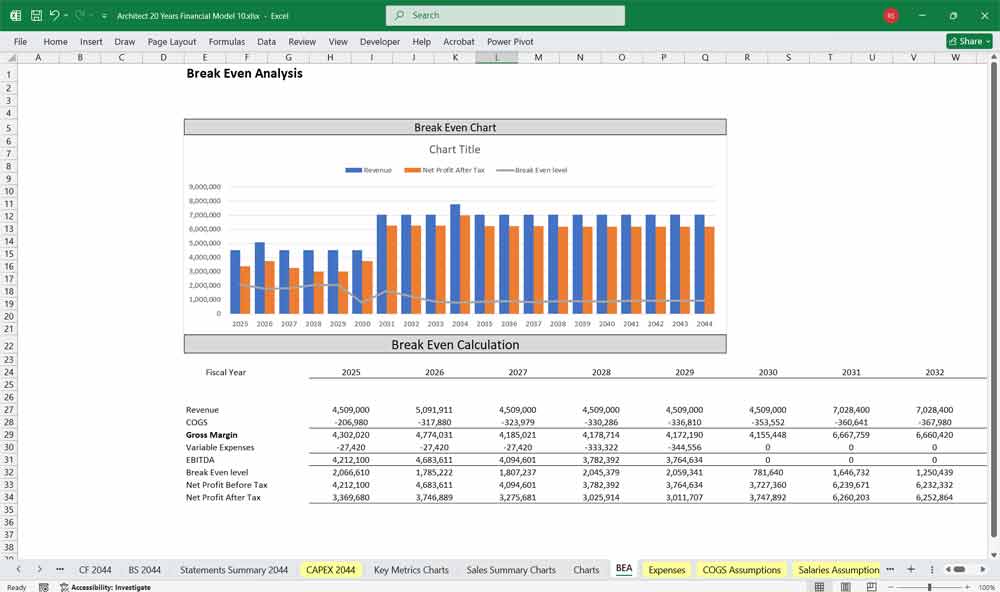
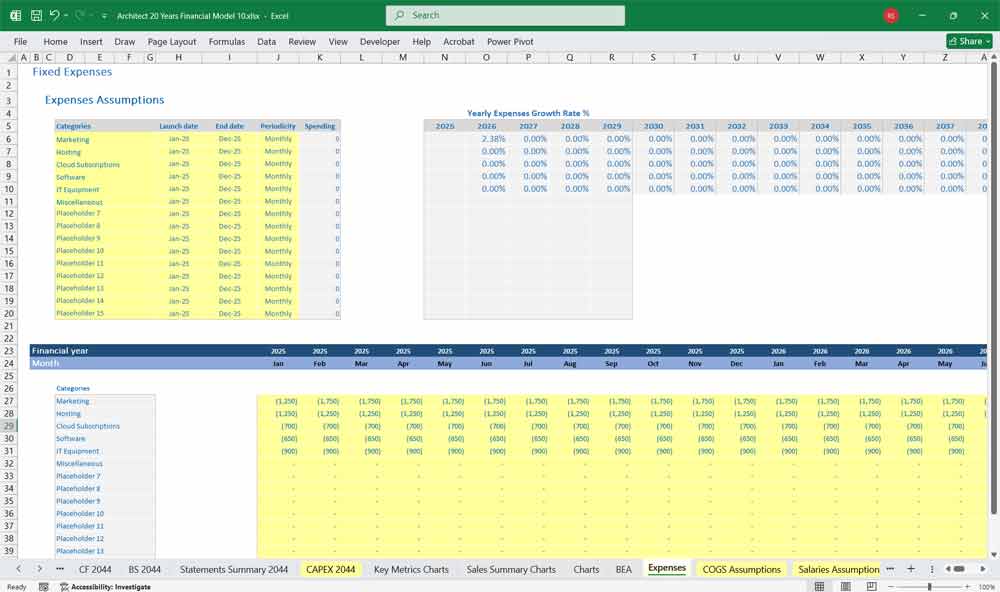
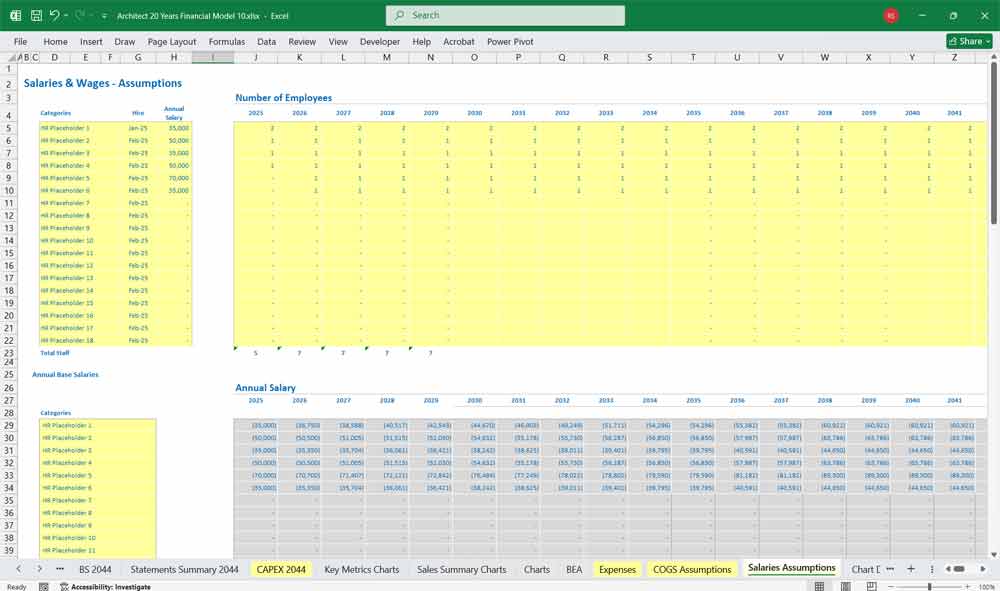
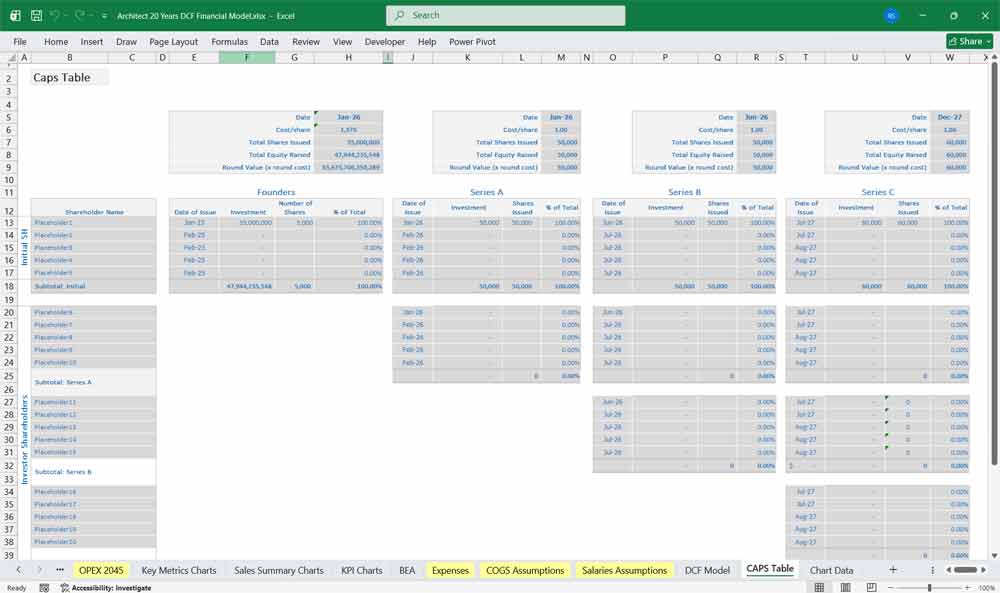
This very extensive 20 Year Architect Model involves detailed revenue projections, cost structures, capital expenditures, and financing needs. This model provides a thorough understanding of the financial viability, profitability, and cash flow position of an architectural company. Includes: 20x Income and Cash Flow Statements, Balance Sheets, CAPEX and OPEX Spreadsheets, Statement Summary Sheets and Charts, and Revenue Forecasting Charts, specified revenue streams, BEA charts, sales summary charts, employee salary tabs and expenses sheets.
Income Statement
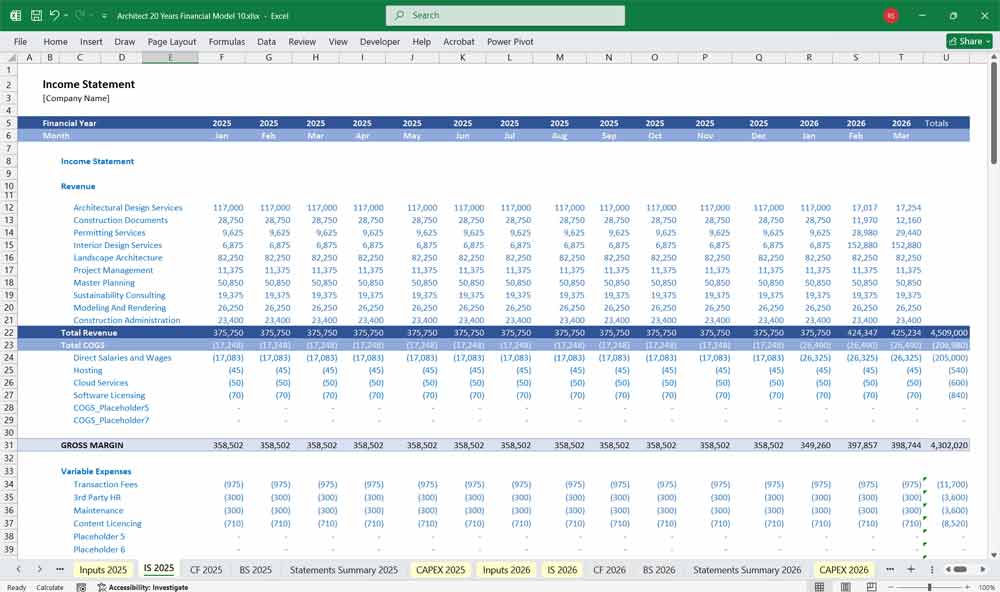
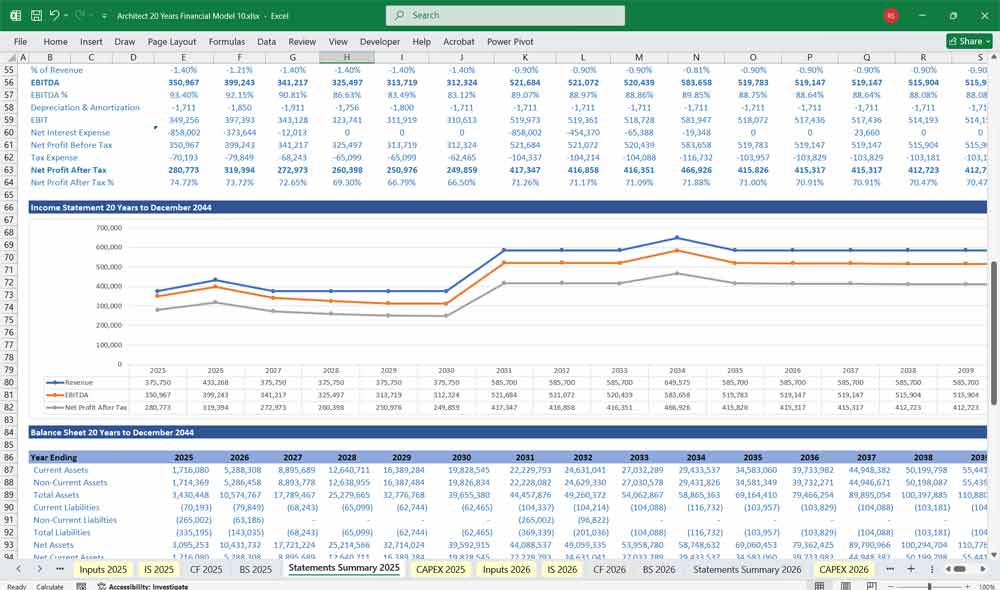
The Income Statement, also known as the Profit and Loss (P&L) statement, shows the company’s revenues and expenses over a period of time, ultimately arriving at net income.
Revenue
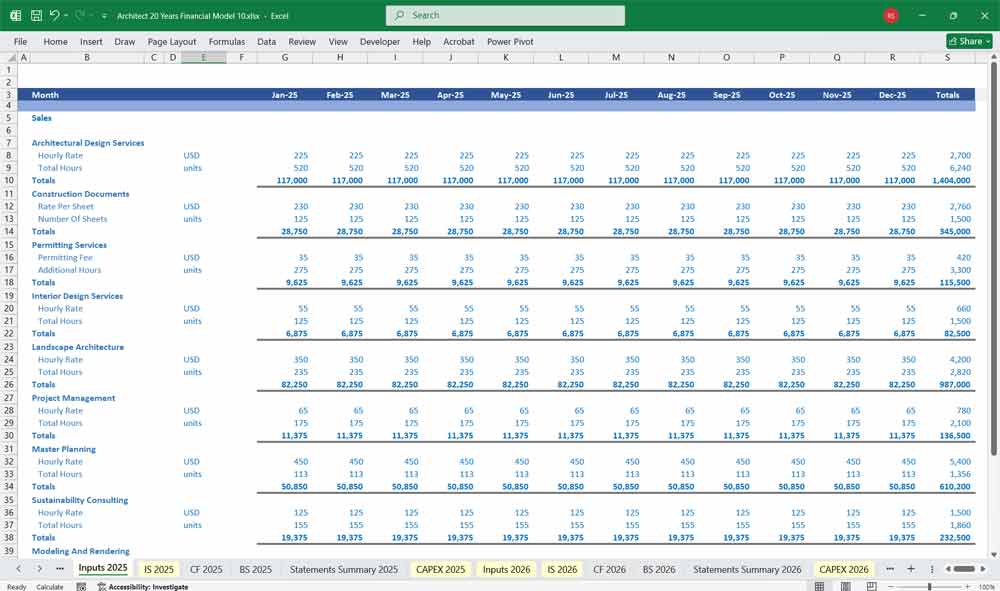
Revenue for an architecture firm is typically tied to the projects it undertakes. The revenue section should be broken down by project type or client to provide a more detailed view.
Projected Billings: This is the primary source of revenue. It’s calculated based on a pipeline of current and future projects. Key inputs include the estimated project value, the fee structure (e.g., percentage of construction cost, lump sum, or time and materials), and the expected timeline for billing and collection.
Other Income: This may include revenue from consulting services, design competitions, or intellectual property.
Cost of Goods Sold (COGS)
For an architecture firm, COGS isn’t about physical goods but rather the direct costs associated with generating revenue.
Project-Specific Labor: This includes the salaries, wages, and benefits of employees directly working on client projects. It’s often the largest expense and is driven by the number of hours worked per project and the employee’s billing rate.
Sub-Consultants: Payments to external consultants like structural engineers, mechanical engineers, or landscape architects that are directly tied to a specific project. These costs are often passed through to the client.
Operating Expenses
These are the indirect costs of running the business, not tied to a specific project.
Salaries & Wages: Compensation for administrative, marketing, and other non-project staff.
Rent & Utilities: The cost of the office space.
Marketing & Business Development: Costs associated with securing new projects, such as proposals, website maintenance, and client entertainment.
Insurance: Professional liability insurance, general business insurance, etc.
Software & Technology: Licenses for design software (e.g., AutoCAD, Revit), project management tools, and other IT expenses.
The model calculates Gross Profit (Revenue – COGS) and then Operating Profit (Gross Profit – Operating Expenses). Finally, it subtracts interest and taxes to arrive at Net Income.
Architect Cash Flow Statement
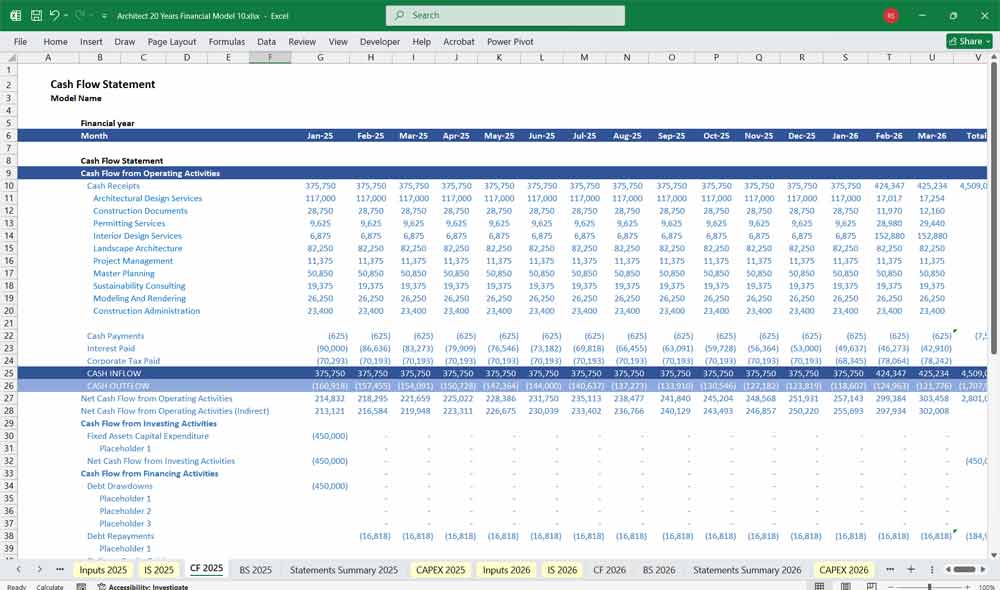
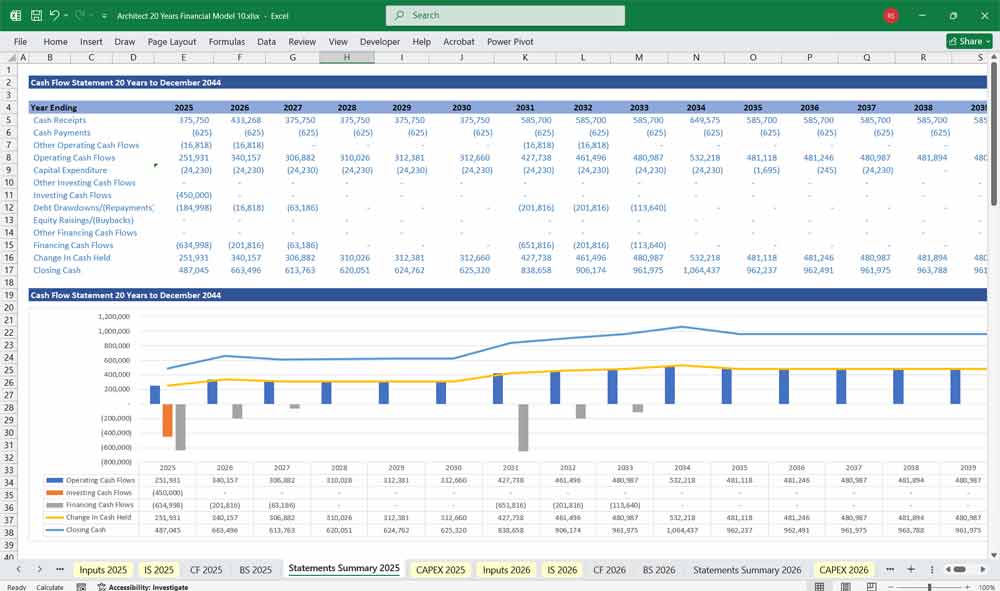
The Cash Flow Statement tracks the movement of cash into and out of the business, categorized into three sections.
Cash from Operating Activities
This section starts with Net Income from the Income Statement and adjusts for non-cash items and changes in working capital.
Depreciation & Amortization: These are non-cash expenses, so they are added back to net income.
Change in Working Capital: This is crucial for an architecture firm. It includes changes in Accounts Receivable, Work in Progress (WIP), and Accounts Payable.
Accounts Receivable: This is the money owed to the company by clients. An increase in accounts receivable means less cash has been collected, so it’s a cash outflow. A decrease is a cash inflow.
WIP: This represents the value of work that has been completed but not yet billed to the client. An increase in WIP ties up cash, while a decrease frees it up.
Accounts Payable: This is money the firm owes to its vendors and sub-consultants. An increase means the firm is holding onto its cash longer (cash inflow), while a decrease means it’s paying its bills faster (cash outflow).
Cash from Investing Activities
This section tracks cash used for investments.
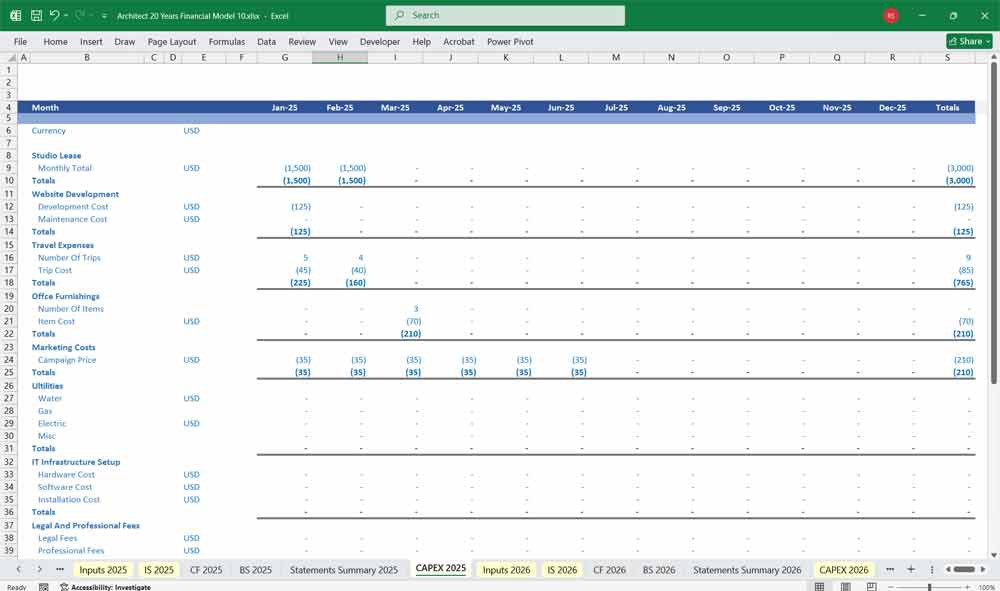
Capital Expenditures (CapEx): This includes the purchase of new computers, furniture, or specialized equipment. These are cash outflows.
Sale of Assets: If the firm sells old equipment, it’s a cash inflow.
Cash from Financing Activities
This section deals with cash flows related to debt and equity.
Debt: Cash inflows from taking on new loans and cash outflows from repaying principal on existing debt.
Equity: Cash inflows from issuing new shares or cash outflows from paying dividends or repurchasing shares.
The sum of these three sections gives the total change in cash, which is then added to the beginning cash balance to get the ending cash balance.
Architect Balance Sheet
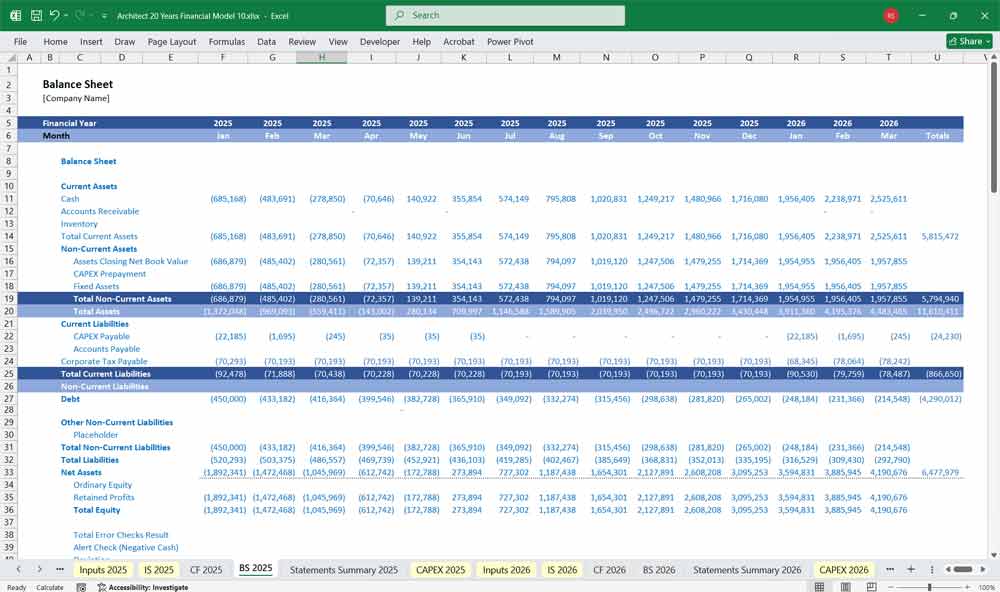
The Balance Sheet provides a snapshot of the company’s financial position at a single point in time. It must always balance, meaning Assets = Liabilities + Owner’s Equity.
Assets
Assets are what the company owns.
Current Assets: These are assets expected to be converted into cash within one year.
Cash & Cash Equivalents: The ending cash balance from the Cash Flow Statement.
Accounts Receivable: The amount of money owed by clients for billed work.
Work in Progress (WIP): The value of work completed but not yet billed. This is a unique and important asset for a service-based firm.
Prepaid Expenses: Payments made in advance for services or goods.
Non-Current Assets: Long-term assets that are not easily converted to cash.
Property, Plant & Equipment (PP&E): The value of the firm’s physical assets (computers, furniture) net of accumulated depreciation.
Goodwill & Intangibles: If the firm has acquired another company, this would include the value of its brand or client list.
Liabilities
Liabilities are what the company owes to others.
Current Liabilities: Debts due within one year.
Accounts Payable: The amount owed to vendors and sub-consultants.
Accrued Expenses: Expenses incurred but not yet paid (e.g., salaries owed to employees).
Deferred Revenue: Payments received from clients for work not yet completed.
Non-Current Liabilities: Long-term debts.
Long-Term Debt: The principal amount of loans due beyond one year.
Owner’s Equity
This is the owner’s stake in the company.
Common Stock & Paid-in Capital: The initial investment by the owners.
Retained Earnings: The accumulated net income of the firm that has not been paid out as dividends. This is a crucial balancing item; it connects the Income Statement and Balance Sheet. The change in retained earnings equals the net income from the Income Statement, less any dividends paid.
A proper financial model links these three statements together, with the output from one statement (e.g., Net Income from the Income Statement) flowing into another (e.g., the Cash Flow Statement and Balance Sheet). The model is dynamic, allowing users to change key assumptions and see the impact on all three financial statements simultaneously.
20-Year Architect Model = significant long-term strategic advantages
Unlike a standard 3-5 year model, this extended timeframe allows a firm to see the cumulative impact of its strategic decisions. It helps in understanding long-term growth trajectories, market positioning, and the sustainable scalability of the business. This kind of model is particularly useful for firms that are considering major, multi-decade projects or strategic expansions, as it can highlight potential cash flow crunches or opportunities far into the future that a shorter model would miss.
Invaluable for succession planning and Architect firm valuation.
For founders or senior partners looking to retire, a 20-year model provides a clear picture of the firm’s health and value over a generation. It can help structure a buyout for a junior partner, demonstrating the future cash flows that will fund the transition. This forward-looking perspective gives potential buyers or new partners confidence in the firm’s long-term viability and helps to establish a more accurate and defendable valuation, which is critical for a smooth leadership transition.
Supports 20-years of Architect capital expenditure (CapEx) planning.
An architecture firm may need to invest in new technologies, a larger office space, or a new software system. A 20-year model allows the firm to project the financial impact of these large, infrequent expenses over their entire useful life. It can show how a major investment today will affect profitability and cash flow in 5, 10, or even 15 years, helping to determine the optimal timing and financing strategy for such purchases.
Architect and risk management
A 20-year model is a powerful tool. It enables the firm to stress-test its business against various long-term scenarios, such as economic downturns, changes in building codes, or shifts in client preferences. By modeling these risks, the firm can develop contingency plans and build financial resilience. For example, it can help the firm understand how a prolonged recession might impact its revenue stream and how much cash it would need to sustain operations.
Long-term Architect Financial Benefits
A 20-year model is an essential aid for long-term financing decisions. Lenders and investors are often more comfortable providing capital for a firm that has a clear vision and a robust plan for its future. The model can be used to demonstrate the firm’s capacity to service debt over a long period, which is crucial for securing a mortgage on an office building or a long-term line of credit. It provides a compelling narrative of the firm’s financial trajectory, making it a powerful tool for attracting and retaining investment.
Value Your Architect Company With A DCF
Discounted Cash Flow (DCF): Valuing Long-Term Billable Pipelines and IP
In a Discounted Cash Flow (DCF) analysis for an architecture business, the valuation centers on billable utilization, project pipelines, and the transition toward recurring master-planning or BIM (Building Information Modeling) advisory services. The model projects cash flows derived from multi-phased design fees (schematic design through construction administration), which are heavily dependent on macroeconomic real estate cycles. Unlike asset-heavy industrials, upfront CapEx is minimal, primarily comprising high-end workstation hardware, rendering software licenses, and office leases. The Terminal Value calculation requires a highly conservative approach; it reflects the firm’s ability to institutionalize its brand equity, client relationships, and design IP so that the business can outlive its founding “principal” architects without triggering severe revenue decay.
WACC: Pricing Human Capital and “Key-Man” Risk
The Weighted Average Cost of Capital (WACC) for an architecture firm typically sits in a higher range of 11% to 14%, reflecting a business structure heavily reliant on discretionary corporate spending and intangible human capital. Because design studios rarely hold physical collateral like factories or machinery, they cannot easily leverage cheap, senior bank debt, resulting in a capital structure funded almost exclusively by a high Cost of Equity. The discount rate must price in a steep “Construction and Key-Man Beta.” In the 2026 real estate landscape, the hurdle rate must penalize future cash flows for the risk that a sudden real estate downturn will freeze developer budgets, or that the departure of a lead designer will cause major clients to defect to competing firms.
Sensitivity Analysis: Stress-Testing Utilization and Project Deferrals
For an architecture firm, Sensitivity Analysis is the primary tool for mapping the line between a profitable studio and an overstaffed, cash-strapped practice. Financial analysts use sensitivity tables to evaluate how a 15% drop in average billable hourly rates or a six-month deferral of major commercial projects impacts the net present value. A highly industry-specific variable to stress-test is the “Billable Utilization Rate”—measuring the exact percentage of employee hours that can be directly invoiced to clients versus unbillable time spent on speculative competitions, marketing pitches, and administrative overhead. By identifying where the break-even point sits against fixed studio salaries and rent, the sensitivity analysis reveals how long the firm can survive a cyclical freeze in the broader construction market.
Final Notes on the Financial Model
This 20 Year Architect Financial Model focuses on balancing capital expenditures with steady revenue growth from diversified services. By optimizing operational costs, efficiency, and maximizing high-margin services like Architectural Design and Interior Design Services, the model ensures sustainable profitability and cash flow stability.
Download Link On Next Page