
Air Cargo Hub Financial Model Template Excel
This 5-bundle 20-Year, 3-Statement Excel Air Cargo Hub Financial Model Template Excel includes revenue streams from Landing & Parking Fees, Cargo Handling & Warehousing, Transfer Fees (Air-to-Air, Air-to-Truck), cost structures, Discounted Cash Flow (DCF) with Terminal Value, Sensitivity Analysis, WACC Model and financial statements to forecast the financial health of your Air Cargo Hub.
20-Year Financial Model for an Air Cargo Hub
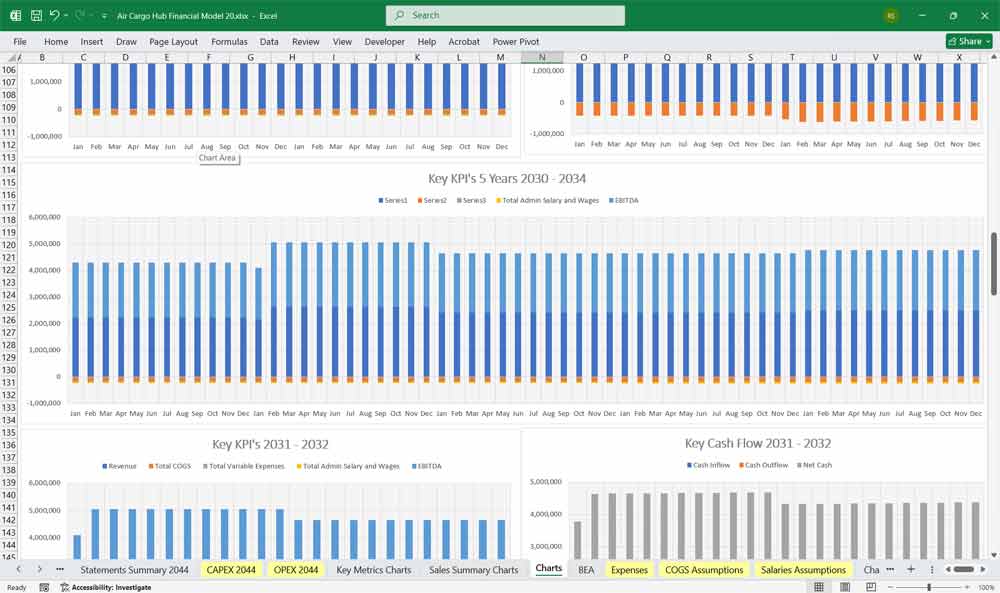
20x Income Statements, Cash Flow Statements, Balance Sheets, CAPEX Sheets, OPEX Sheets, Statement Summary Sheets, and Revenue Forecasting Charts with the specified revenue streams, BEA charts, sales summary charts, employee salary tabs and expenses sheets.
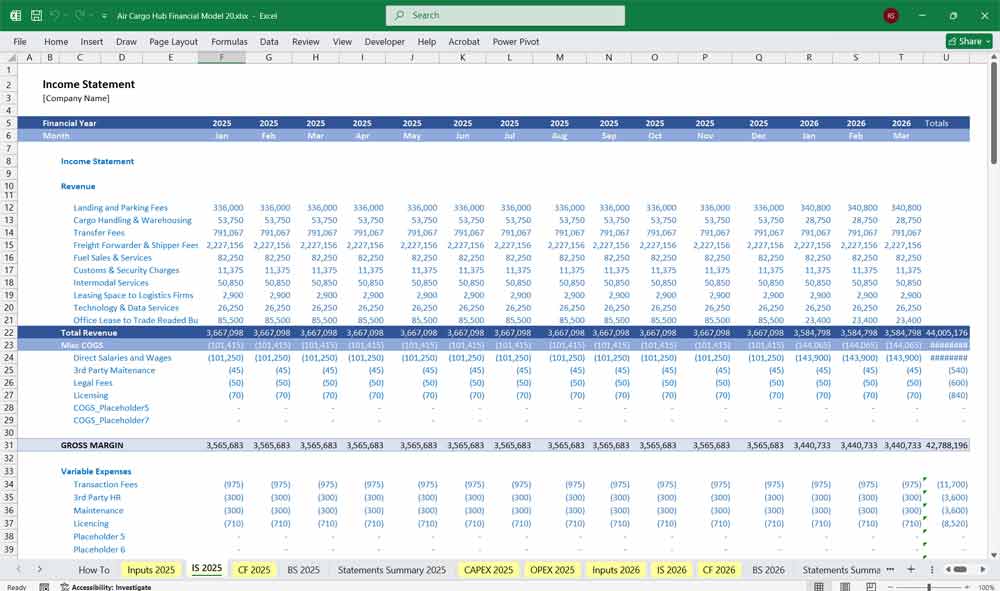
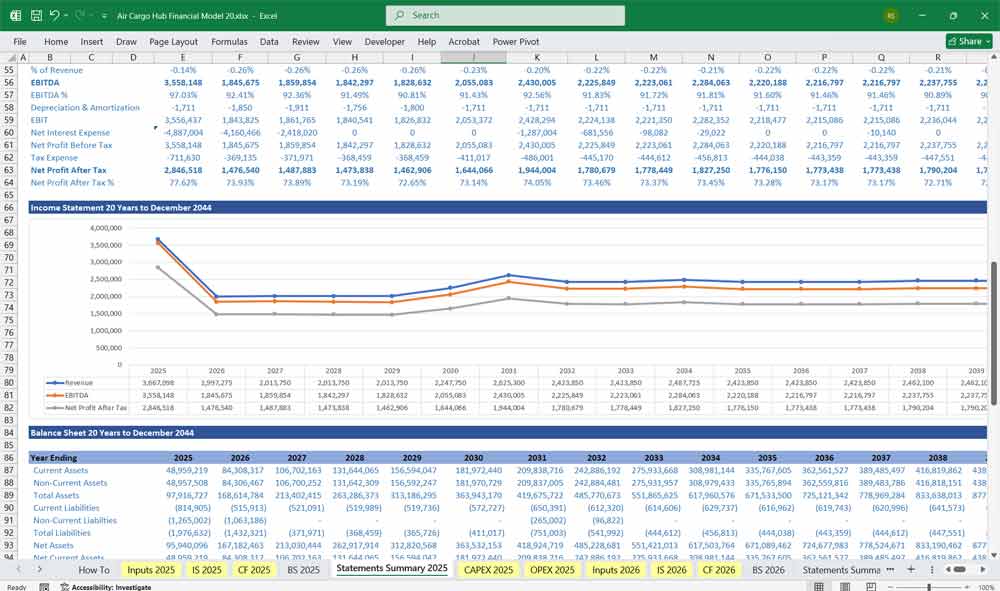
Income Statement (Profit & Loss Statement)
The Income Statement outlines the revenues, costs, and profitability of the air cargo hub.
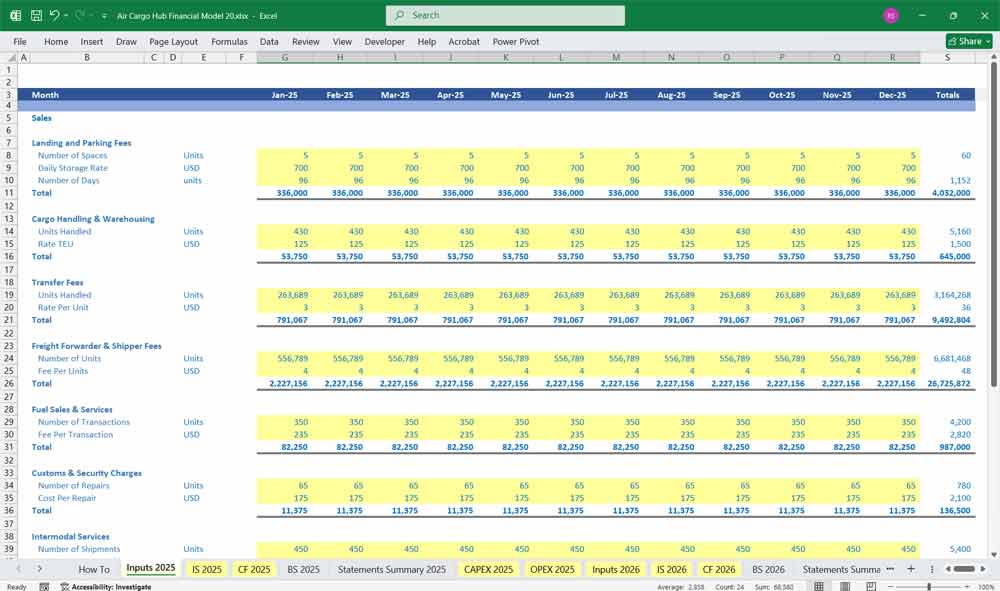
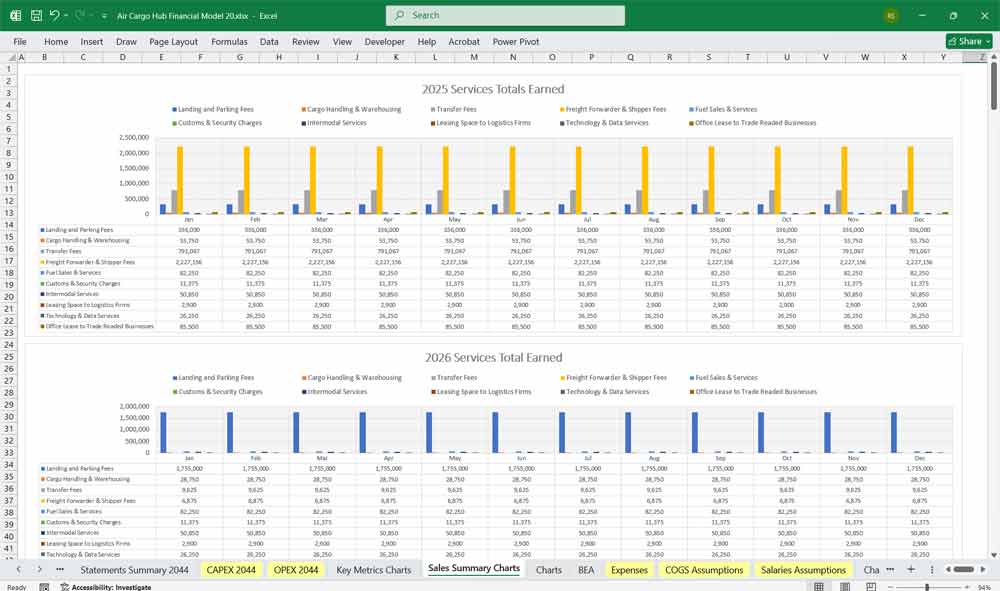
Revenue Streams:
Revenue is derived from multiple sources, categorized into the 6-Tier Subscription:
Landing & Parking Fees
- Number of cargo flights × landing fee rate per ton MTOW (Maximum Takeoff Weight) + hourly parking charges
Cargo Handling & Warehousing
- Tons of cargo handled × handling fee + warehousing rental (per m² per day)
Transfer Fees (Air-to-Air, Air-to-Truck)
- Number of interline/transfer cargo instances × fixed transfer fee
Freight Forwarder & Shipper Fees
- Fee per transaction/service or space rental charges in freight forwarder village
Fuel Sales & Services
- Fuel volume sold (liters or gallons) × markup per liter
Customs & Security Charges
- Fee per consignment or per shipment based on volume or weight
Intermodal Services
- Revenue from truck/train interconnectivity services, per shipment
Intermodal Services
- Revenue from truck/train interconnectivity services, per shipment
Leasing to Logistics Firms
- Long-term lease income (warehouses, office space, cold storage, etc.)
Operating Expenses
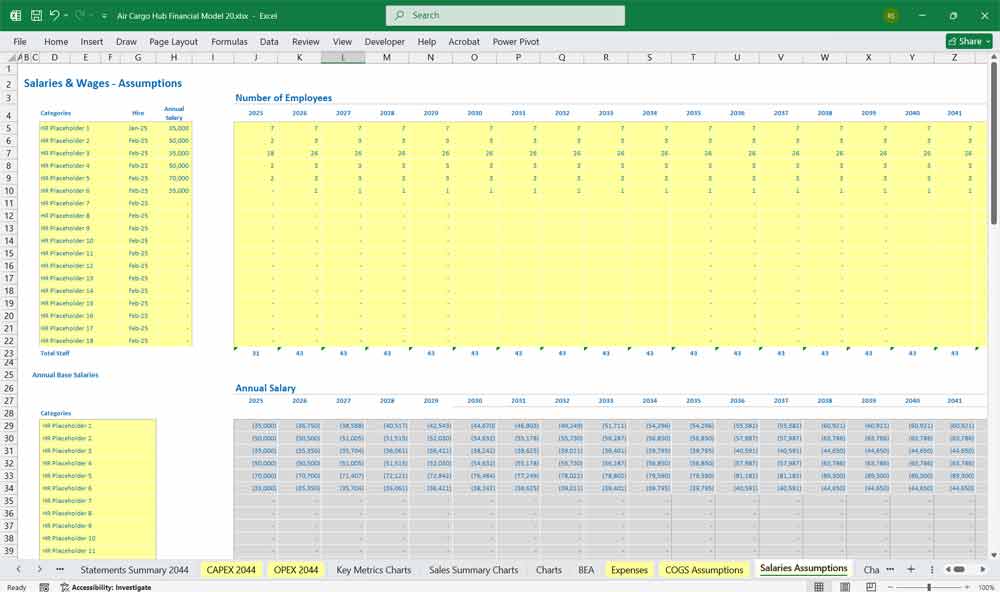
Salaries and Wages (terminal ops, customs, ground handling, etc.)
Maintenance (facilities, runways, equipment)
Utilities and IT systems
Fuel procurement costs (COGS)
Administrative expenses
Security and customs operations
Insurance
Marketing and airline incentives
Depreciation & Amortization
Based on CapEx schedule (buildings, runways, systems, vehicles)
EBITDA, EBIT, and Net Income
EBITDA = Revenue – Operating Expenses (excluding D&A)
EBIT = EBITDA – Depreciation & Amortization
Net Income = EBIT – Interest – Taxes
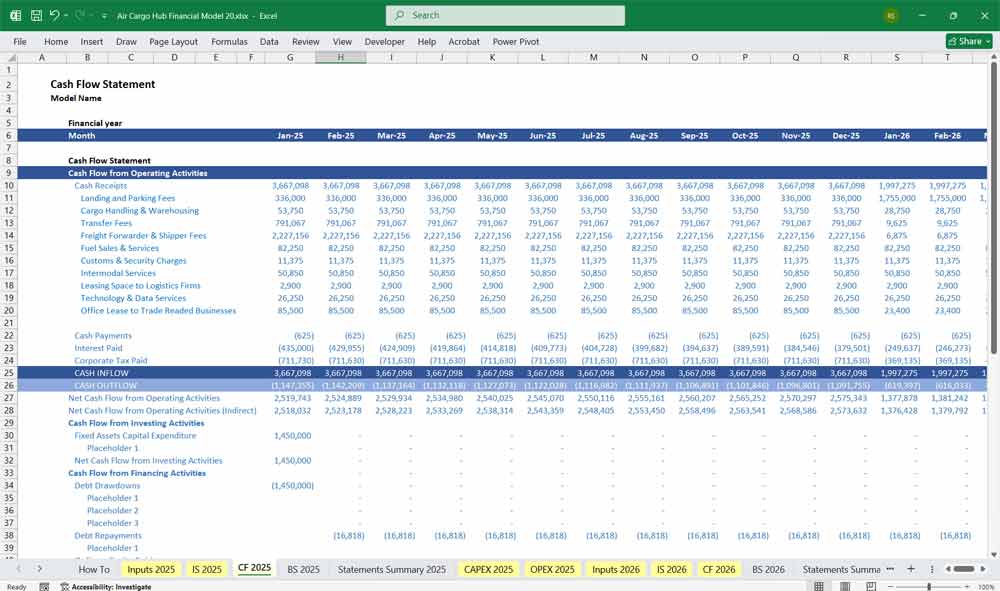
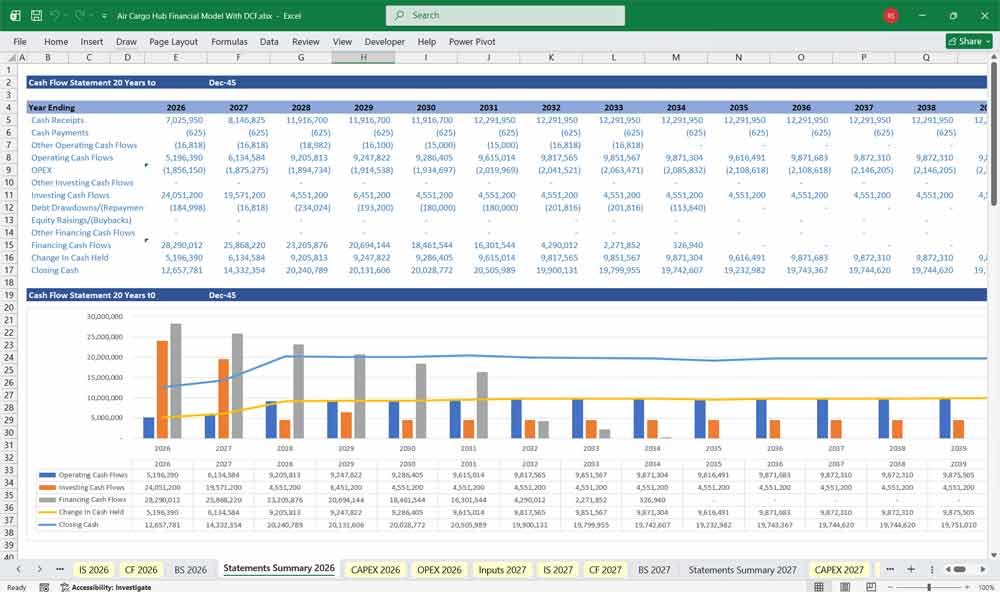
Air Cargo Hub Cash Flow Statement
Operating Activities
Cash Receipts:
All revenue items from income statement
Adjusted for changes in working capital (Accounts Receivable, Payables)
Cash Payments:
Salaries, fuel procurement, utilities, services
Taxes paid
Net working capital adjustments
Investing Activities
Capital Expenditures:
Runways, taxiways, terminals, IT systems, warehousing infrastructure
Expansion CapEx (e.g., new cargo terminals, automation tech)
Asset Sales (if any)
Financing Activities
Debt Issuance/Repayment
Equity Inflows
Interest Paid
Dividends Paid
Free Cash Flow
Operating CF – CapEx
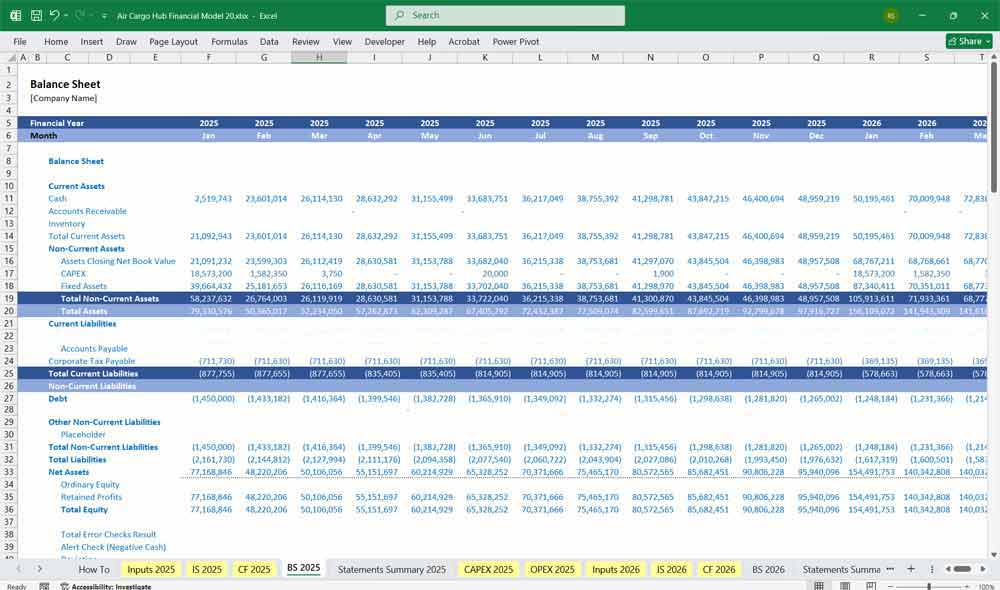
Air Cargo Hub Balance Sheet
Assets
Current Assets:
Cash & Cash Equivalents
Accounts Receivable (airlines, logistics firms, etc.)
Inventory (fuel, spare parts)
Prepaid expenses
Non-Current Assets:
Property, Plant, & Equipment (PP&E)
Runways, terminals, fuel farms, warehouses, trucks
Intangible Assets (licenses, software systems)
Right-of-Use Assets (if leased infrastructure)
Liabilities
Current Liabilities:
Accounts Payable
Accrued Salaries
Short-term Debt
Taxes Payable
Non-Current Liabilities:
Long-term Loans or Bonds
Lease Liabilities
Deferred Tax Liabilities
Equity
Share Capital
Retained Earnings
Revaluation Reserves (if applicable)
Key Financial Metrics for an Air Cargo Hub
Revenue Metrics
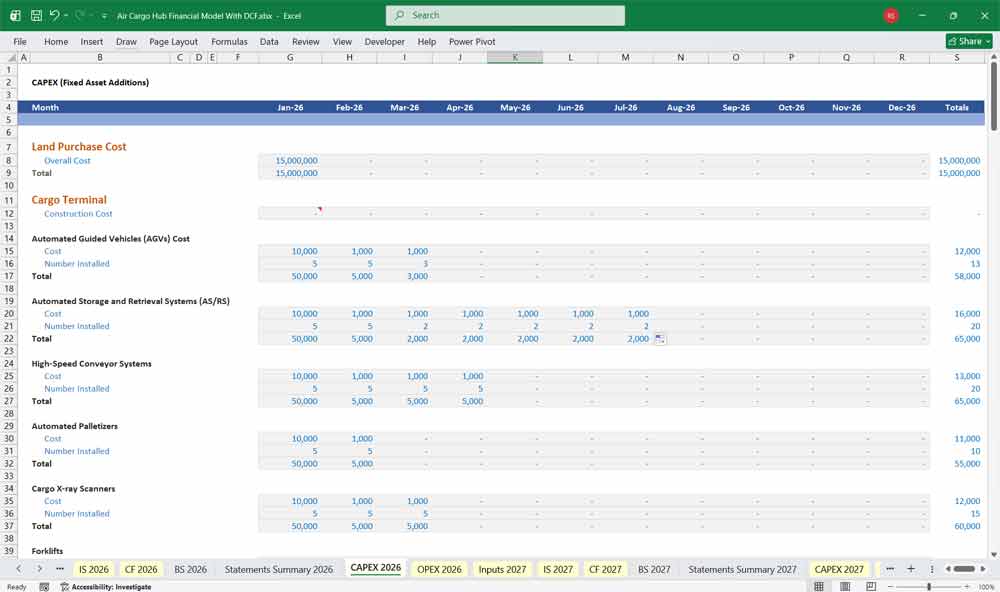
Capital Expenditure (CapEx): Initial investment in infrastructure, hardware, and construction.
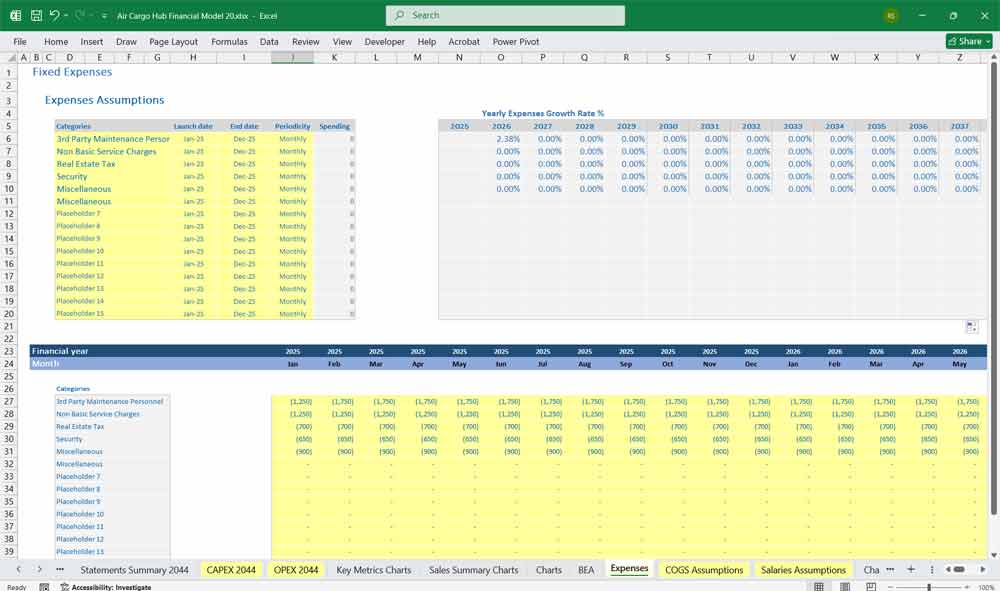
Operational Expenditure (OpEx): Ongoing costs for maintenance, utilities, staffing, and software.
- CAPEX Examples
Automated Storage and Retrieval Systems (AS/RS
- High-Speed Conveyor Systems
- Cargo X-ray Scanners
- X-ray Scanners
- Automated Sorting Systems
- Automated Guided Vehicles (AGVs)
Monthly Recurring Revenue Predictable income from ongoing services like Cargo Handling & Warehousing, Freight Forwarder & Shipper Fees.
Revenue per Handled Units: Average income generated per package or per ton.
Revenue per Acre Leasing: Income generated per acre of physical space. Long-term lease income (warehouses, office space, cold storage, etc.)
Power Usage Effectiveness (PUE): Ratio of total energy used to energy delivered to IT equipment (lower PUE = better efficiency).
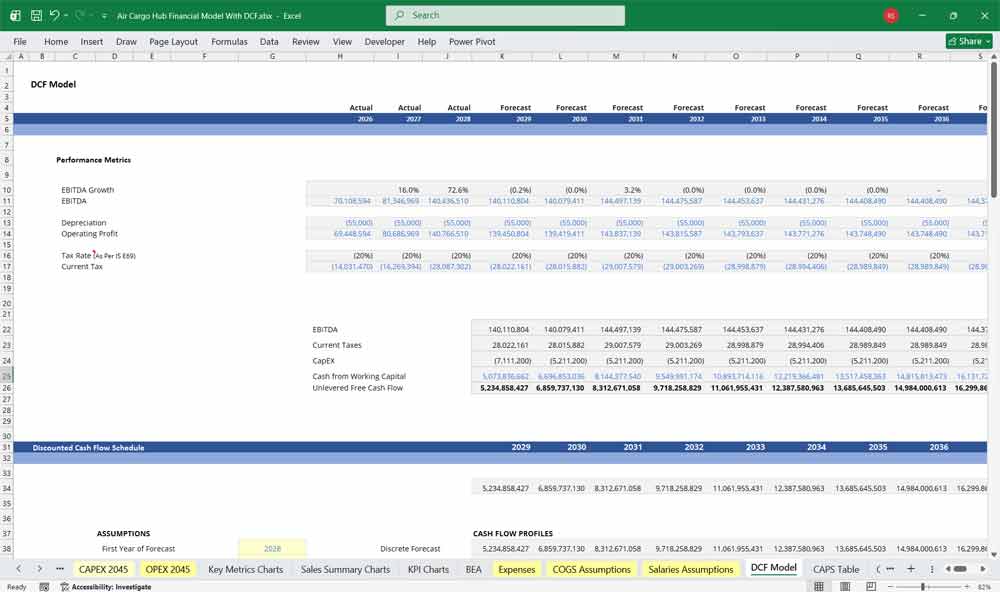
Valuing Your Air Cargo Hub With A Discounted Cash Flow DCF Model
DCF: Valuing the “Tolls” on Global Trade
This 20-year Discounted Cash Flow (DCF) analysis for an air cargo hub, the valuation centers on “throughput and tolls”—the steady collection of landing fees, parking charges, and high-margin warehouse rentals. Unlike a passenger terminal, a cargo hub’s cash flow is driven by tonnage velocity and the growth of “just-in-time” e-commerce logistics. The model must project massive front-loaded CapEx for runway expansions, automated sortation systems, and specialized cold-chain facilities for pharmaceuticals. Over two decades, the DCF meticulously discounts these long-term “annuity-like” cash flows, ensuring the Net Present Value (NPV) reflects the hub’s strategic role as a permanent fixture in the global supply chain.
WACC: Pricing Infrastructure Stability and Geopolitical Beta
The Weighted Average Cost of Capital (WACC) for an air cargo hub typically reflects its status as a “hard asset,” often resulting in a more favorable hurdle rate between 6% and 9%. Because these hubs possess immense tangible value in land and infrastructure, they can secure high-leverage, low-cost project financing or municipal bonds, which effectively compresses the WACC. However, the discount rate must price in a “trade beta”—the risk that global tariffs or a shift in manufacturing centers could redirect flight paths. A well-calibrated WACC ensures that future cash flows are appropriately “punished” for the high fixed-cost base and the hub’s sensitivity to the volatile global trade environment.
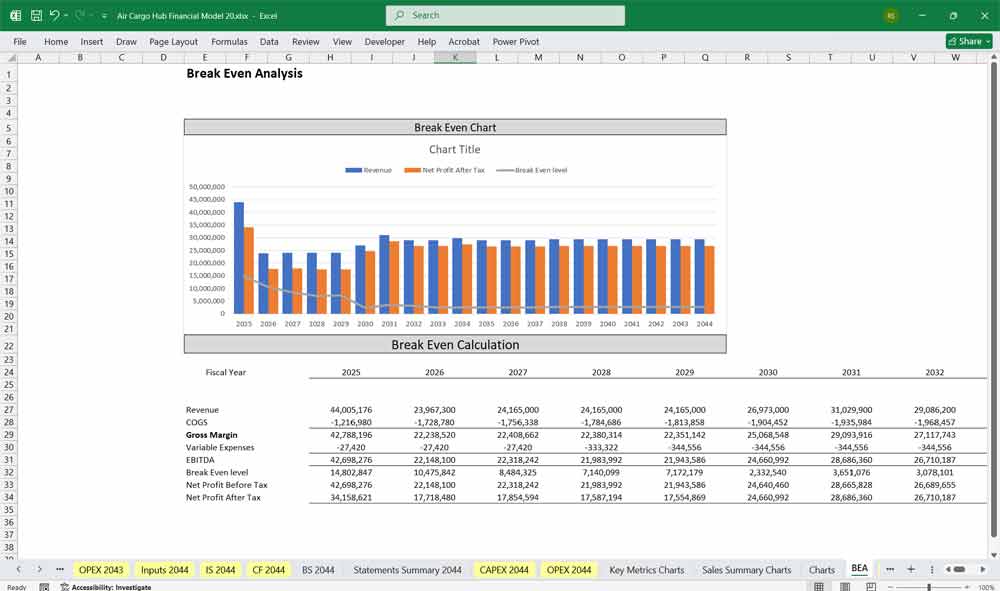
Sensitivity Analysis: Stress-Testing Tonnage and Fuel Spreads
For an air cargo hub, Sensitivity Analysis is the primary tool for measuring “capacity resilience.” Analysts use sensitivity tables to see how a 5% drop in total landed weight or a 10% increase in operational labor costs impacts the hub’s debt-service coverage ratio. Perhaps most critically, the model must stress-test the indirect impact of jet fuel prices; while the hub doesn’t buy the fuel, a price spike can lead carriers to cancel routes or downsize aircraft, directly eroding landing fee revenue. By identifying the break-even point for “slot utilization,” the sensitivity analysis reveals the hub’s ability to remain profitable even during a sudden contraction in global consumer spending.
Final Notes on the Financial Model
This 20 Year Air Cargo Hub Financial Model must focus on balancing capital expenditures with steady revenue growth from diversified services. By optimizing operational costs, and power efficiency, and maximizing high-margin services like Landing & Parking Fees, Cargo Handling & Warehousing, and Freight Forwarder & Shipper Fees, the model ensures sustainable profitability and cash flow stability.
Download Link on Next Page