
Sodium Hydroxide Plant Financial Model
This 20-Year, 3-Statement Excel Sodium Hydroxide Plant Financial Model includes 5 editable revenue streams from Sodium Hydroxide, Chlorine, Hydrogen, Sodium hypochlorite, and Hydrochloric Acid. Cost structures, Discounted Cash Flow (DCF) with Terminal Value, Sensitivity Analysis, WACC, and financial statements to forecast the financial health of your Sodium Hydroxide (Caustic Soda), (chlor-alkali) Plant.
20-Year Financial Model for a Sodium Hydroxide Plant
This very extensive 20 Year Sodium Hydroxide Model involves detailed revenue projections, cost structures, capital expenditures, and financing needs. This model provides a thorough understanding of the financial viability, profitability, and cash flow position of your plant. Includes: 20x Income Statements, Cash Flow Statements, Balance Sheets, CAPEX sheets, OPEX Sheets, Statement Summary Sheets, and Revenue Forecasting Charts with the revenue streams, BEA charts, sales summary charts, employee salary tabs and expenses sheets.
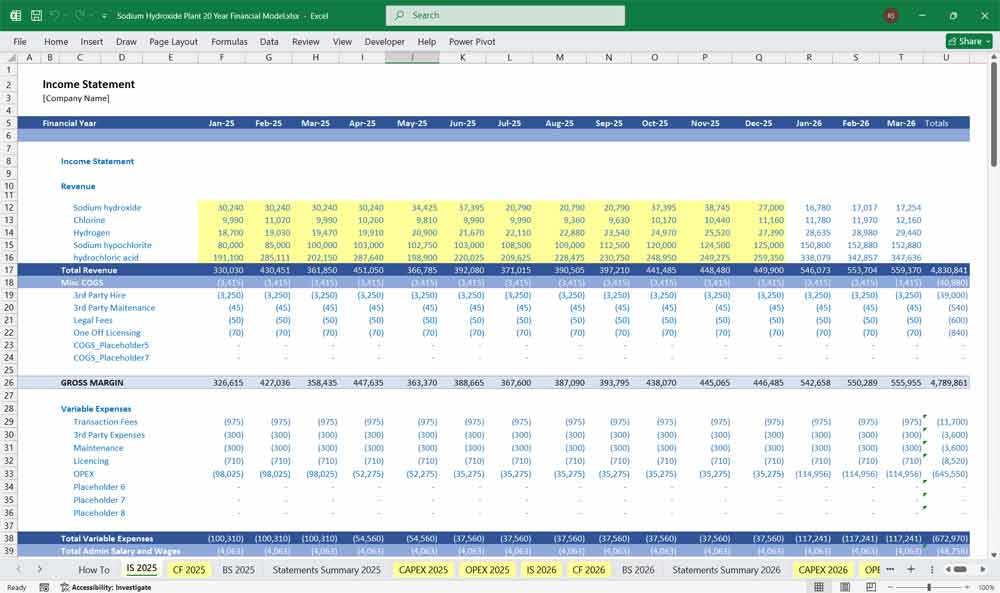
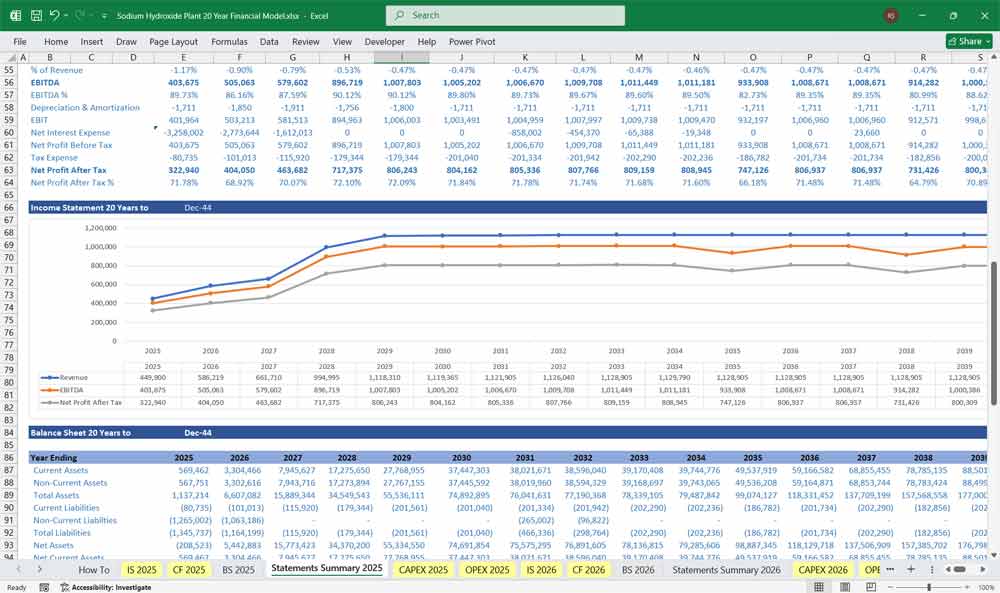
The Income Statement (Profit & Loss Projection)
The Income Statement shows the projected profitability of the plant.
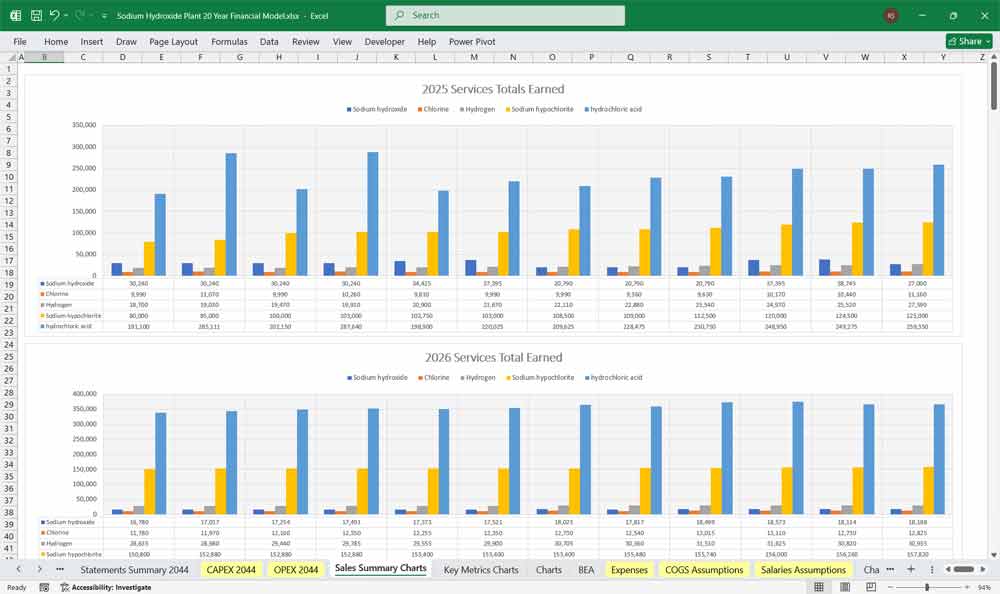
Revenue
Sodium Hydroxide Caustic Soda Revenue: Calculated as the volume of caustic soda sold multiplied by its forecasted price per ton.
By-Product Revenue: Calculated as the volume of chlorine and hydrogen produced and sold multiplied by their respective forecasted prices. The production volumes are directly tied to the caustic soda production volume based on the chemical process stoichiometry.
Cost of Goods Sold
Variable Costs:
Raw Materials: Primarily the cost of salt consumed.
Utilities: The cost of electricity is the largest component, calculated as power consumption rate multiplied by the power tariff. This is followed by the cost of steam/fuel.
Other Chemicals: For brine purification.
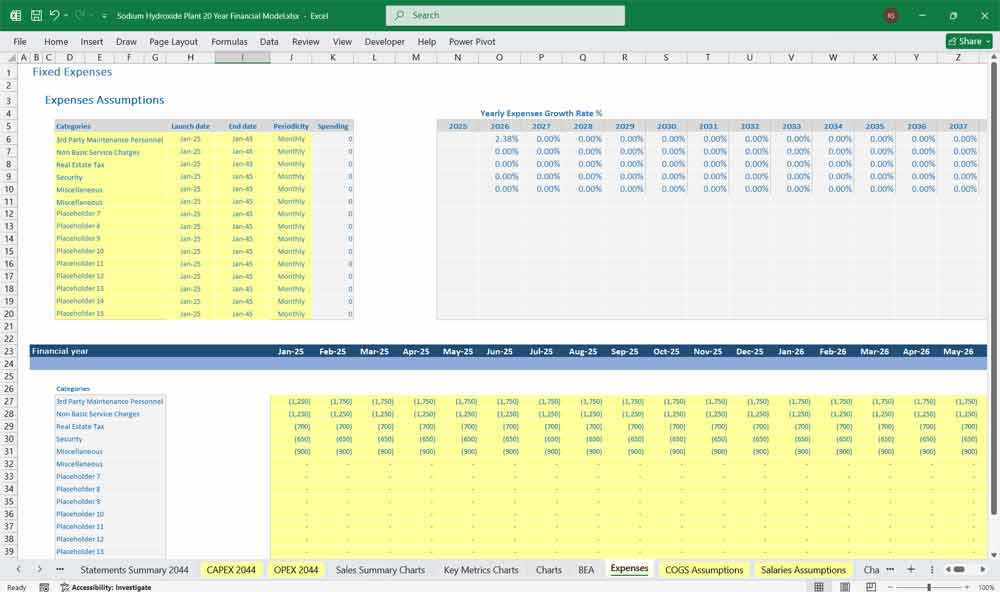
Fixed Operating Costs:
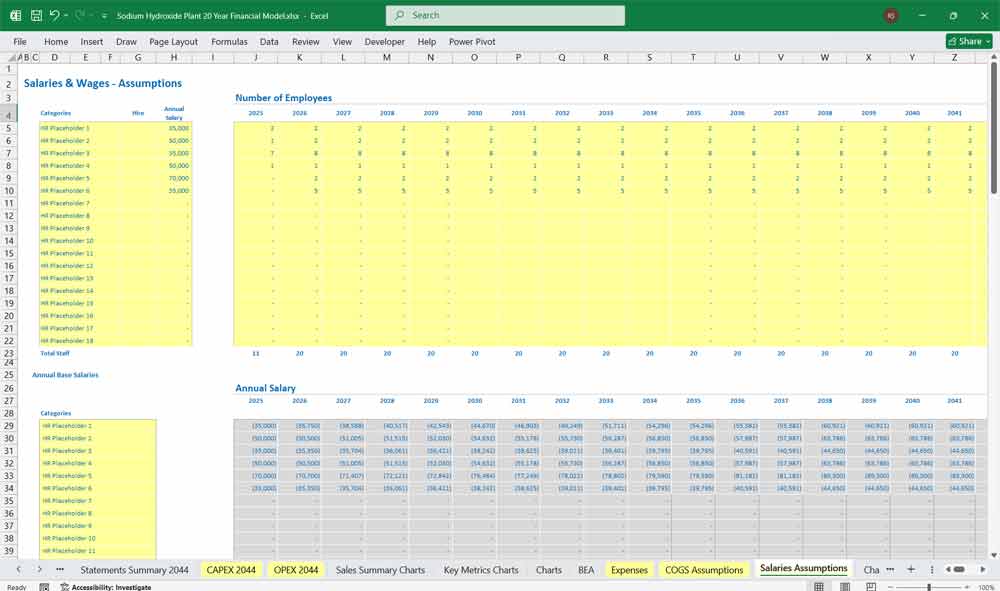
Labor costs.
Maintenance costs, often expressed as a percentage of fixed assets.
Plant overheads.
Gross Profit
This is calculated as Total Revenue minus Total Cost of Goods Sold.
Operating Expenses
Selling, General & Administrative Expenses: Includes salaries for administrative staff, marketing, insurance, and other corporate overheads.
Earnings Before Interest, Taxes, Depreciation, and Amortization
Calculated as Gross Profit minus Operating Expenses. This is a key measure of the project’s operational cash flow.
Depreciation and Amortization
A non-cash expense calculated based on the Capital Expenditure and the chosen depreciation method and asset lives.
Earnings Before Interest and Tax
Calculated as EBITDA minus Depreciation and Amortization.
Interest Expense
The cost of debt, calculated based on the outstanding loan balance and the interest rate.
Profit Before Tax
Calculated as Earnings Before Interest and Tax minus Interest Expense.
Income Tax Expense
Calculated as Profit Before Tax multiplied by the corporate tax rate. In early years, this is often zero due to tax shields from high depreciation and interest expenses.
Net Income
The final profit after all expenses and taxes, calculated as Profit Before Tax minus Income Tax Expense.
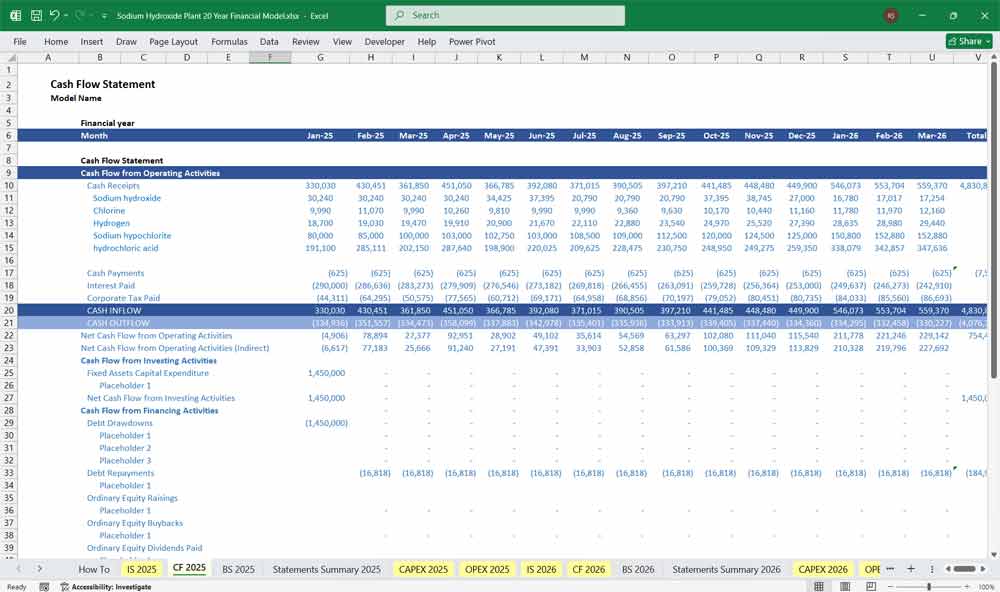
Sodium Hydroxide (Caustic Soda) Plant Cash Flow Statement
The Cash Flow Statement tracks the movement of cash and is vital for assessing the plant’s ability to service debt.
Cash Flow from Operating Activities
Starts with the Net Income from the Income Statement.
Adds back non-cash expenses, primarily Depreciation.
Adjusts for changes in Working Capital: an increase in Accounts Receivable or Inventory consumes cash, while an increase in Accounts Payable provides cash.
The result is the Net Cash Provided by Operating Activities.
Cash Flow from Investing Activities
Consists almost entirely of Capital Expenditures outflows, which occur primarily during the construction period.
Cash Flow from Financing Activities
Inflows: Includes the drawdown of debt and the injection of equity capital.
Outflows: Includes the repayment of debt principal, payment of interest, and distribution of dividends to shareholders.
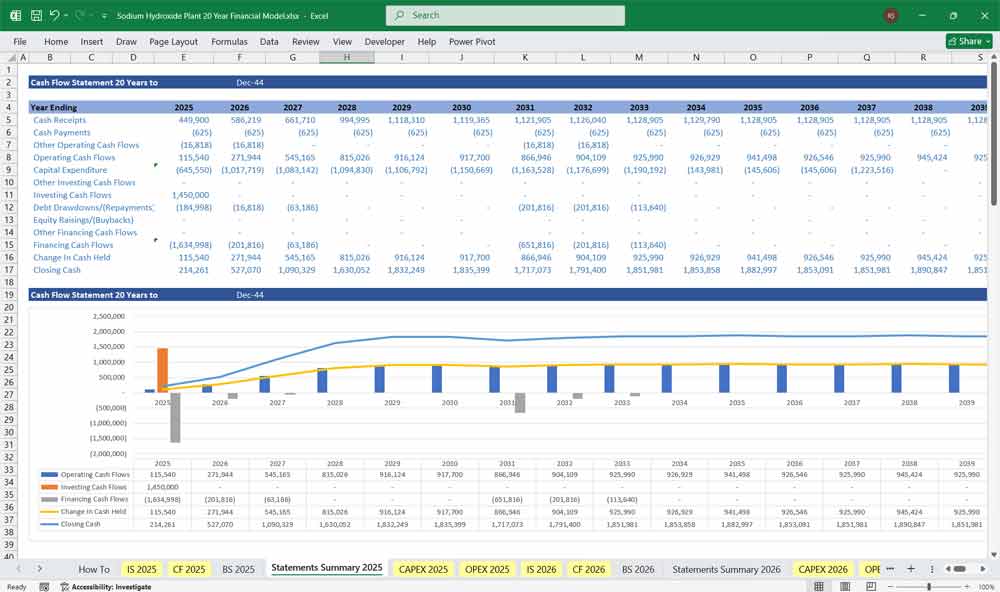
Net Change in Cash and Ending Cash Balance
The sum of cash flows from operating, investing, and financing activities equals the Net Change in Cash for the period.
This change is added to the Opening Cash Balance to arrive at the Closing Cash Balance, which must agree with the Cash balance on the Balance Sheet.
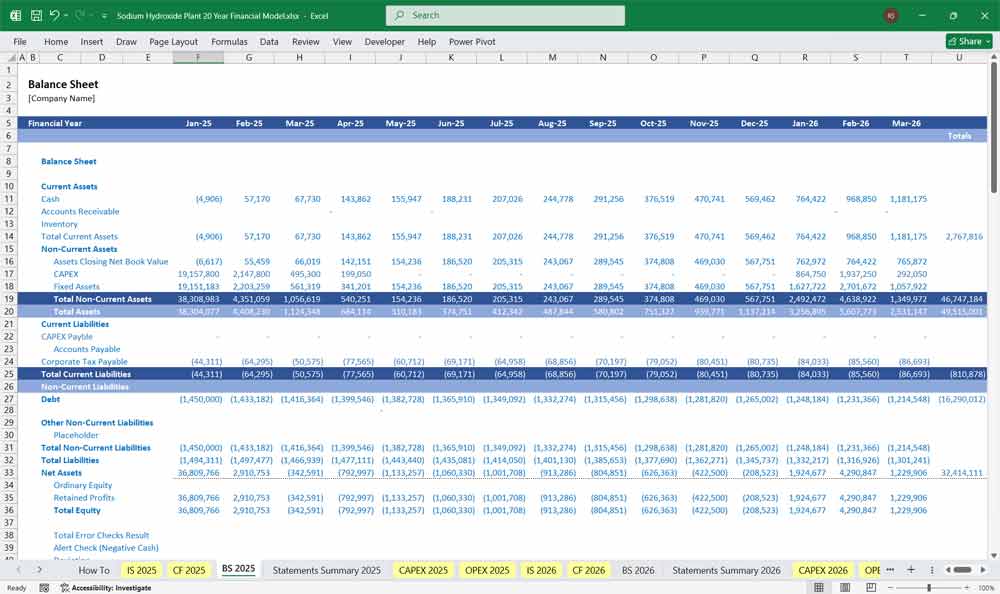
Sodium Hydroxide (Caustic Soda) Plant Balance Sheet
The Balance Sheet provides a snapshot of the project’s financial position at the end of each period.
Assets
Current Assets:
Cash and Cash Equivalents: The closing balance from the Cash Flow Statement.
Accounts Receivable: Calculated based on revenue and the Days Sales Outstanding assumption.
Inventory: Calculated based on Cost of Goods Sold and the Days Inventory Held assumption.
Non-Current Assets:
Property, Plant, and Equipment: The initial Capital Expenditure minus the accumulated depreciation.
Liabilities and Equity
Current Liabilities:
Accounts Payable: Calculated based on Cost of Goods Sold and the Days Payable Outstanding assumption.
Short-Term Debt: The portion of the long-term loan due for repayment within the next year.
Non-Current Liabilities:
Long-Term Debt: The outstanding loan balance after current repayments.
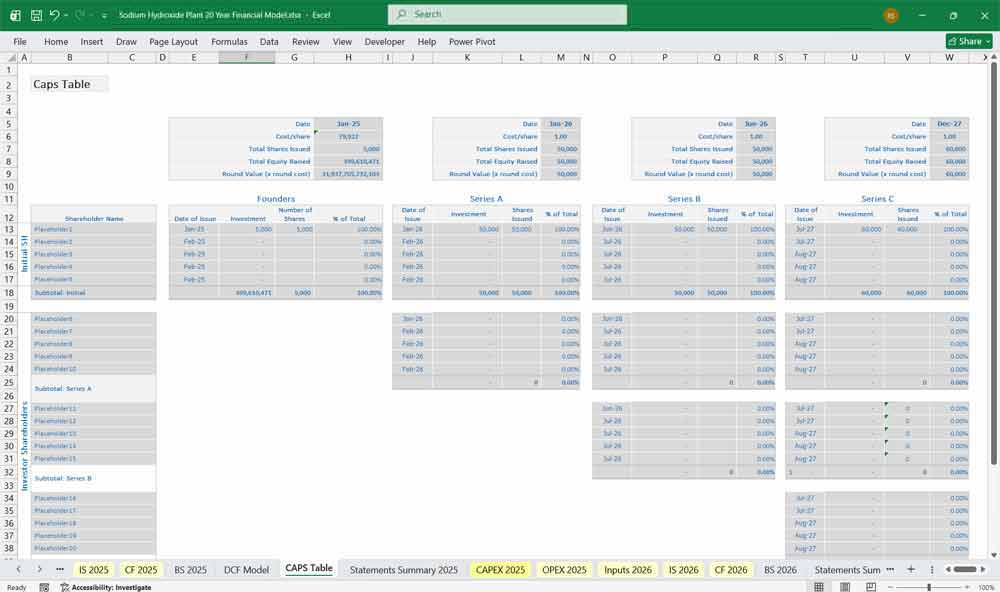
Equity:
Share Capital: The cumulative equity invested by shareholders.
Retained Earnings: The cumulative Net Income of the project minus all dividends paid out. This line item is the essential link that connects the Income Statement to the Balance Sheet.
The Balance Sheet must always balance: Total Assets must equal the sum of Total Liabilities and Total Equity.
Key Sodium Hydroxide (Caustic Soda) Industry-Specific Considerations
Core Model Assumptions and Drivers
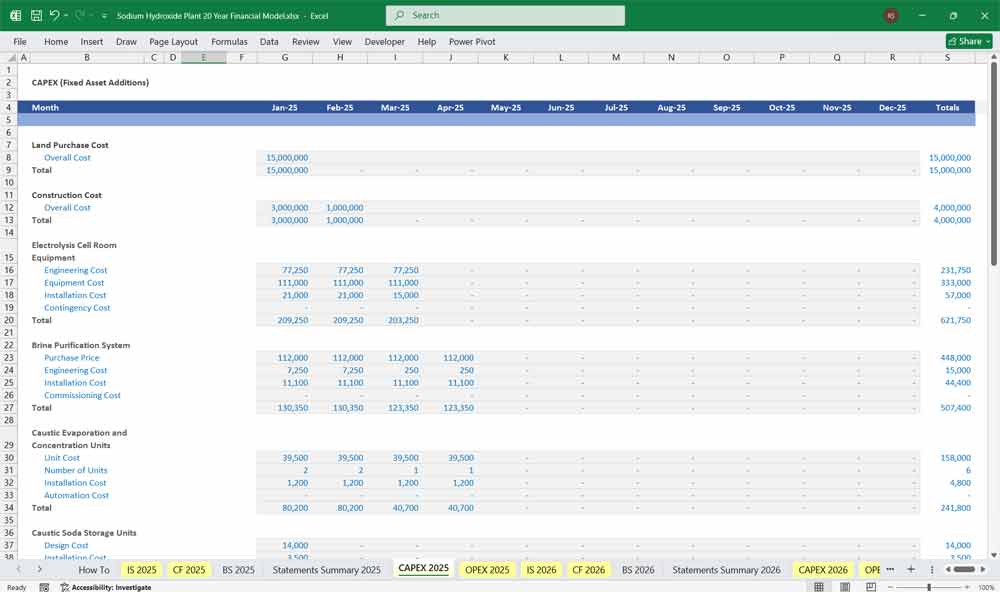
Capital Expenditure Assumptions
Plant Capacity: Defined in metric tons per annum of caustic soda production.
Construction Period: The timeline over which the plant is built, typically two to three years, with capital expenditures phased accordingly.
Total Capital Cost: A detailed breakdown including land, site preparation, process units (electrolysis cells, evaporators), utilities, storage tanks, engineering and design costs, and a contingency allowance.
Depreciation Method and Life: The model assumes a straight-line depreciation method over the useful life of the assets, which differs for various components.
Operational Assumptions
Production Ramp-Up: A profile projecting the percentage of nameplate capacity utilized in each operating year.
Technology Selection: Assumption of the membrane cell process as the modern standard, which defines the consumption rates for raw materials and utilities.
Key Input Consumption Rates:
Salt consumption per ton of caustic soda.
Electricity consumption per ton of caustic soda. This is the single most critical variable cost driver.
Steam consumption for concentration.
Pricing: Forecasted prices for caustic soda, chlorine, and hydrogen. These are highly volatile and are often modeled with various scenarios.
Input Costs: Forecasted costs for salt, electricity, natural gas, labor, and maintenance.
Financial Assumptions
Financing Structure: The ratio of debt to equity used to fund the project.
Debt Terms: Interest rate, loan term, grace period, and repayment schedule.
Working Capital Parameters: Assumptions for Days Sales Outstanding, Days Inventory Held, and Days Payable Outstanding.
Tax Rate: The effective corporate income tax rate.
Supporting Analysis and Outputs
Debt Schedule
A detailed table projecting the opening debt balance, interest payment, principal repayment, and closing debt balance for each period. This schedule feeds interest expense into the Income Statement and principal repayment into the Cash Flow Statement.
Key Financial Metrics
Net Present Value: The value of the project in today’s dollars, using a discount rate that reflects the risk of the investment.
Internal Rate of Return: The project’s effective compounded rate of return.
Debt Service Coverage Ratio: A key covenant for lenders, calculated as Net Operating Income divided by Total Debt Service. It measures the project’s ability to service its debt.
Payback Period: The time required for the project to recoup its initial investment.
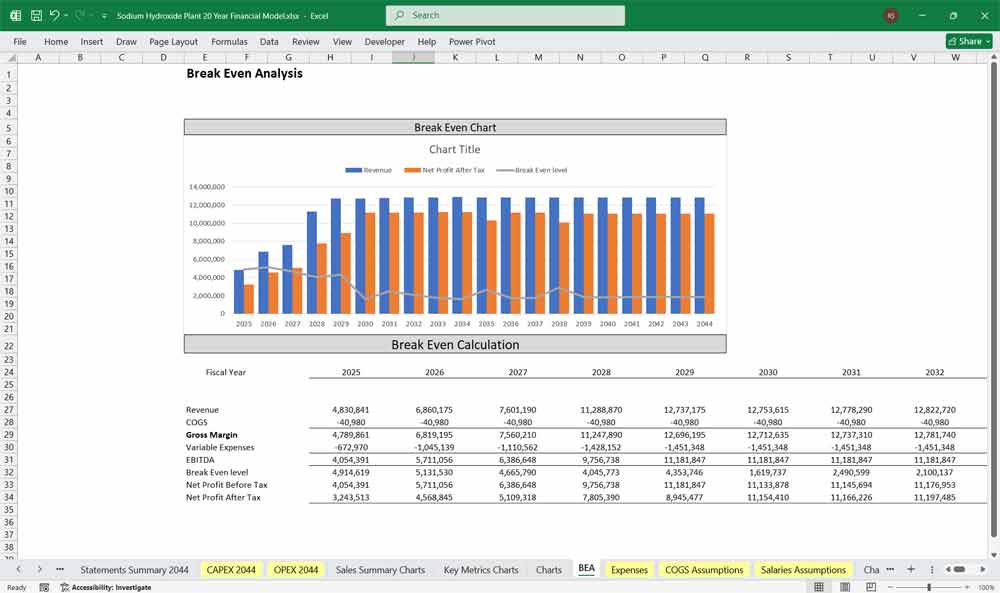
Sensitivity and Scenario Analysis
The model’s outputs are tested against changes in key assumptions. Common analyses include varying the price of caustic soda and chlorine, and the cost of electricity, to understand the project’s risk profile and break-even points.
This comprehensive structure ensures that every financial aspect of the Sodium Hydroxide plant, from the cost of salt to the final debt repayment, is captured and interrelated, providing a complete picture of the project’s financial feasibility.
Benefits Of A 20 Year Sodium Hydroxide (Caustic Soda) Plant Model
This 20-year financial model provides a long-term view of the economic sustainability and profitability of a caustic soda plant, which is crucial given the capital-intensive nature of chlor-alkali projects. These plants often require significant upfront investment in electrolyzers, brine purification systems, and power infrastructure, with payback periods extending beyond a decade. A long-range model allows investors and project sponsors to capture the full return on capital, including late-stage cash flows, residual value, and potential reinvestment cycles such as membrane replacements or capacity expansions. It ensures that profitability is not overstated in the early years and that the financial viability reflects the full lifecycle of the asset.
Sodium Hydroxide Plant And Long-Term Decision-Making
Over a 20-year horizon, the model also provides a robust framework for strategic decision-making and risk management. The chlor-alkali industry is sensitive to fluctuations in power prices, caustic soda demand, and chlorine utilization. A long-term projection helps analyze how such variables affect the project’s debt service capability, cash flow resilience, and internal rate of return under different market scenarios. It allows planners to test sensitivity cases — such as electricity cost escalation or price cycles — and determine when to refinance, optimize operations, or integrate downstream products (like hydrochloric acid or sodium hypochlorite) to stabilize revenue.
Financing Tool For Your Sodium Hydroxide (Caustic Soda) Plant
A 20-year model serves as a critical communication and financing tool for stakeholders, lenders, and regulators. It provides transparency into capital recovery, depreciation schedules, and tax impacts, helping financial institutions assess creditworthiness and structure long-term debt. Governments and environmental agencies also benefit from seeing the project’s projected performance, energy efficiency, and compliance costs over its operational life. In essence, the extended model period not only ensures accurate financial evaluation but also builds confidence in the project’s sustainability, enabling better investment decisions and long-term partnerships.
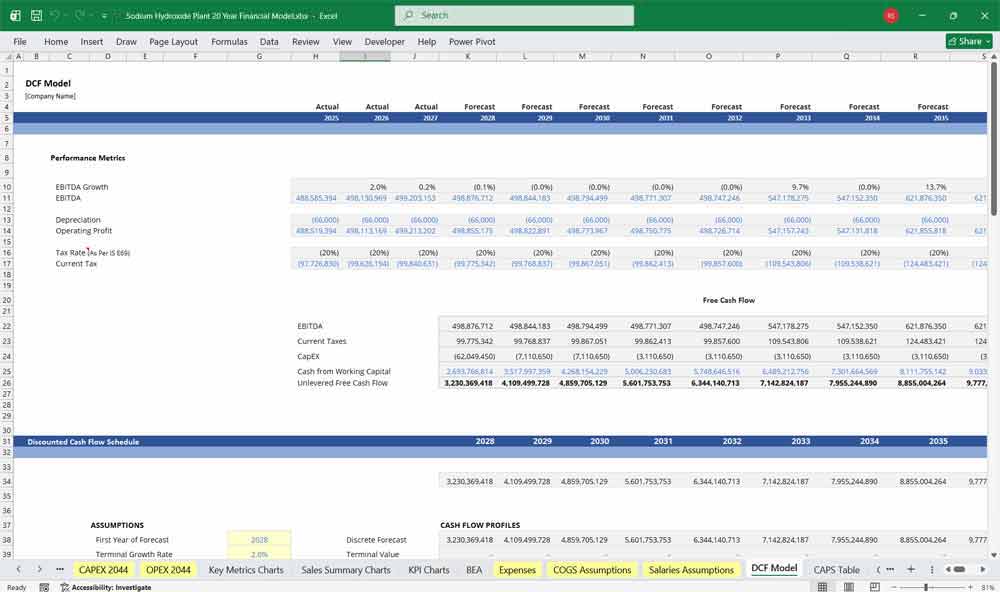
Value Your Sodium Hydroxide (Caustic Soda) Plant With A DCF
Discounted Cash Flow (DCF): The “Chlor-Alkali” Balancing Act
This 20-year Discounted Cash Flow (DCF) analysis for a sodium hydroxide (caustic soda) plant, the valuation is a study in “ECU” (Electrochemical Unit) economics. Since caustic soda is co-produced with chlorine through the electrolysis of brine, the model must simultaneously project the market demand for both chemicals. The DCF accounts for massive front-loaded CapEx—specifically the membrane cell electrolyzers—balanced against the long-term cash flows driven by the paper, alumina, and soap industries. Over two decades, the Net Present Value (NPV) is heavily influenced by the “replacement cycle” of expensive membranes and the plant’s ability to monetize chlorine byproducts, ensuring the valuation reflects a complex chemical balancing act rather than a single-stream commodity play.
WACC: Pricing “Power Beta” and Industrial Tangibility
WACC represents the plant’s required rate of return, blending the cost of equity and debt based on its capital structure. For a sodium hydroxide plant, WACC is influenced by factors such as energy price exposure, regulatory risks, and the stability of industrial demand. Since chlor-alkali operations are capital-intensive but often operate in mature markets, WACC tends to reflect moderate risk, though it can rise with higher leverage or exposure to volatile electricity markets.
Sensitivity Analysis: Stress-Testing the “Power-to-Price” Spread
Sensitivity analysis tests how changes in key assumptions impact the plant’s valuation. For a sodium hydroxide facility, the most critical variables typically include caustic soda prices, electricity costs, plant capacity utilization, and WACC. By adjusting these inputs, analysts can identify which factors most affect project viability and assess downside risks, such as margin compression from rising energy costs or declining product prices.
Final Notes on the Financial Model
This 20 Year Sodium Hydroxide Plant Financial Model focuses on balancing capital expenditures with steady revenue growth from a Sodium Hydroxide (Caustic Soda), (chlor-alkali), and its by-product sales. By optimizing operational costs, and power efficiency, and maximizing high-margin services, the models ensure sustainable profitability and cash flow stability.
Download Link On Next Page
Download Link On Next Page