
Shoe Store Financial Model
Excel Financial Models for a Shoe Store, covering the Income Statement, Cash Flow Statement, and Balance Sheet. With revenues from 40 and 80 product lines and discount analysis. Cost structures and financial statements to forecast the financial health of your Shoe sales.
Financial Model for a Shoe Store
Covering key components such as the Income Statement, Cash Flow Statement, and Balance Sheet.
Financial Model Overview
The financial model will project revenues, costs, and profitability based on the number of product lines (40 or 80). Key assumptions include:
Revenue Drivers: Number of products, average selling price (ASP), and sales volume.
Cost Drivers: Cost of goods sold (COGS), operating expenses, and inventory costs.
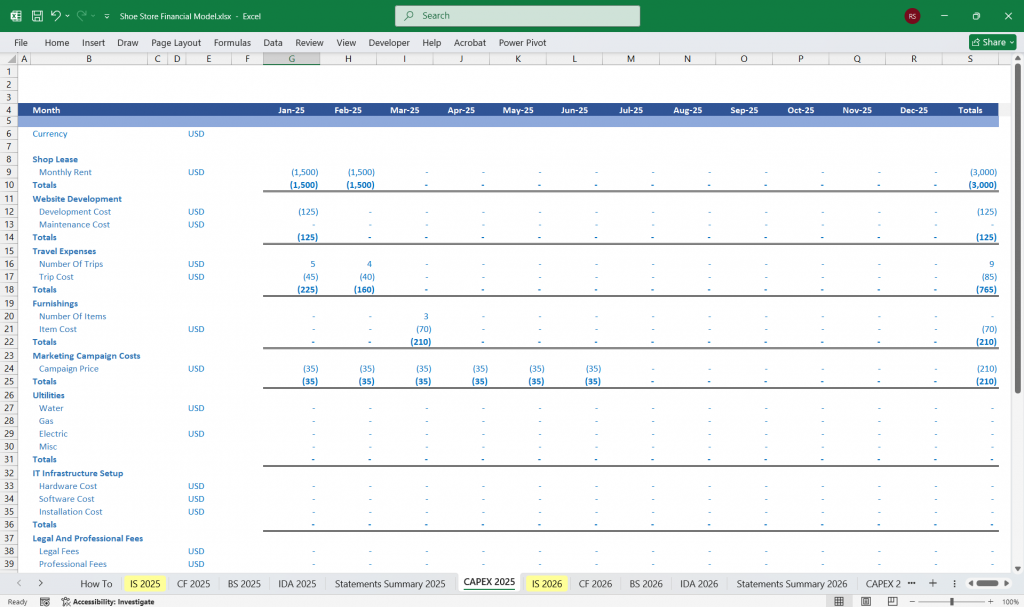
Capital Expenditures: Store setup costs, equipment, and renovations.
Working Capital: Inventory, accounts receivable, and accounts payable.
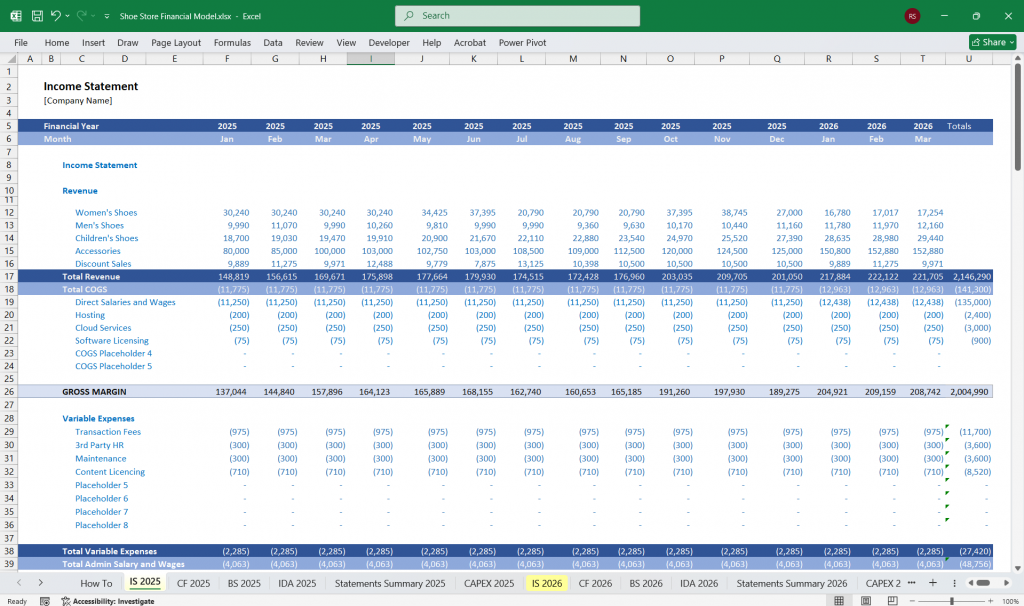
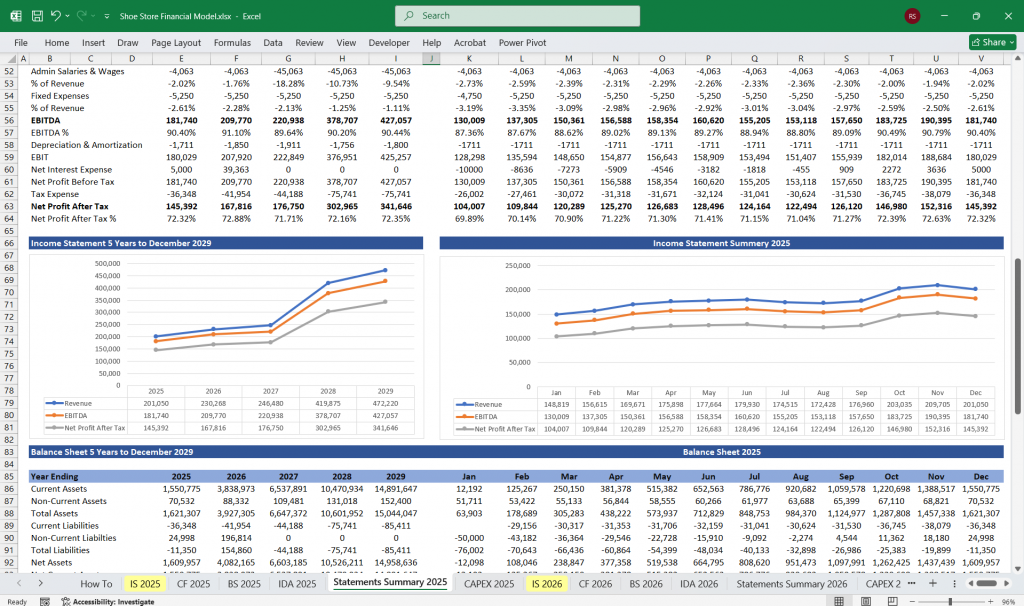
Income Statement
The Income Statement shows the store’s profitability over time. It includes revenues, costs, and expenses.
Key Line Items:
Revenue:
40-Product Line: Revenue = Number of products (40) × ASP × Sales Volume.
80-Product Line: Revenue = Number of products (80) × ASP × Sales Volume.
Assumptions: ASP = $50 (example), Sales Volume = 100 units per product per month.
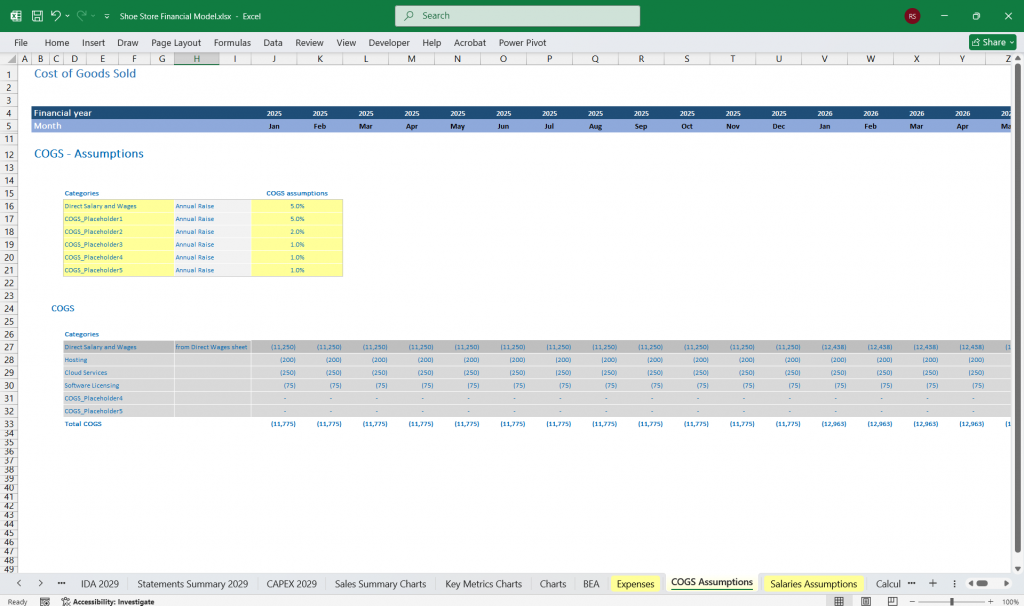
Cost of Goods Sold (COGS):
COGS = Number of units sold × Cost per unit.
Assumptions: Cost per unit = $25 (example).
Gross Profit:
Gross Profit = Revenue – COGS.
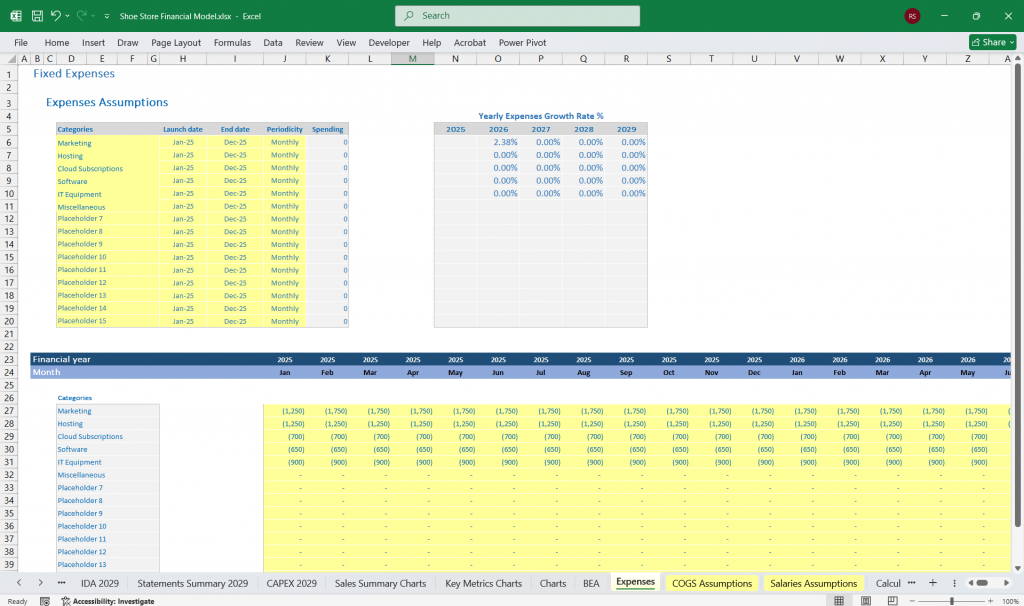
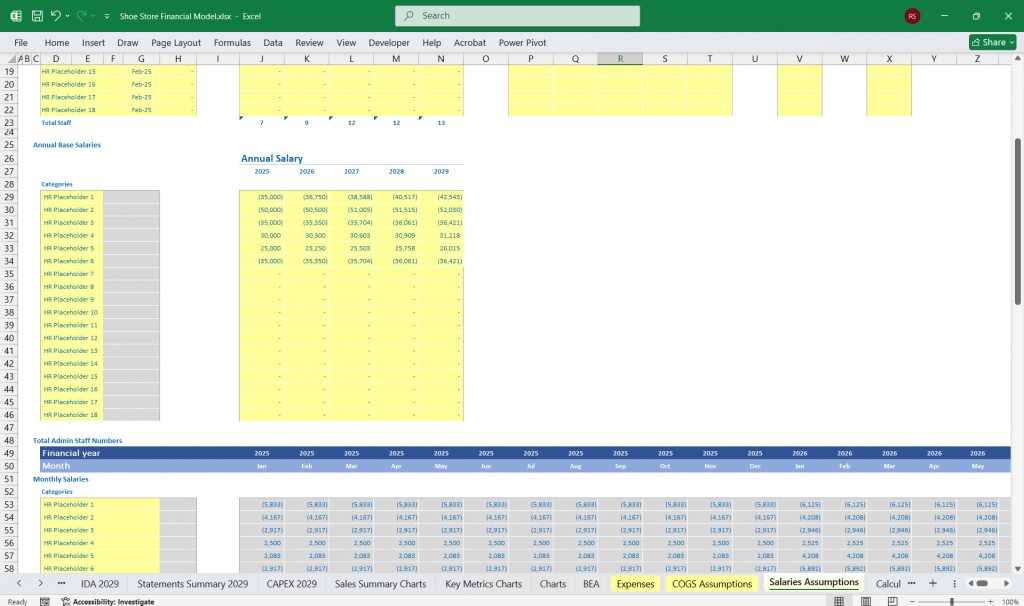
Operating Expenses:
Fixed Costs: Rent, utilities, salaries, marketing.
Variable Costs: Shipping, packaging, commissions.
Assumptions: Rent = 5,000/month,Salaries=5,000/month,Salaries=10,000/month, Marketing = $2,000/month.
EBITDA (Earnings Before Interest, Taxes, Depreciation, and Amortization):
EBITDA = Gross Profit – Operating Expenses.
Depreciation & Amortization:
Depreciation of store fixtures and equipment.
Assumptions: $1,000/month.
Operating Income (EBIT):
EBIT = EBITDA – Depreciation & Amortization.
Interest Expense:
Interest on loans or credit lines.
Assumptions: $500/month.
Net Income:
Net Income = EBIT – Interest Expense – Taxes.
Assumptions: Tax rate = 25%.
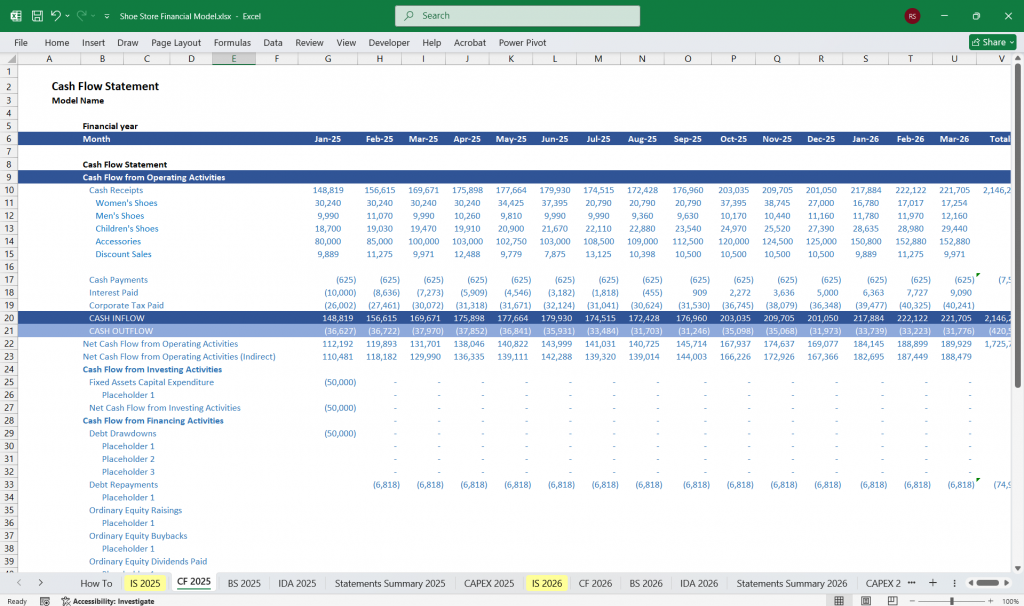
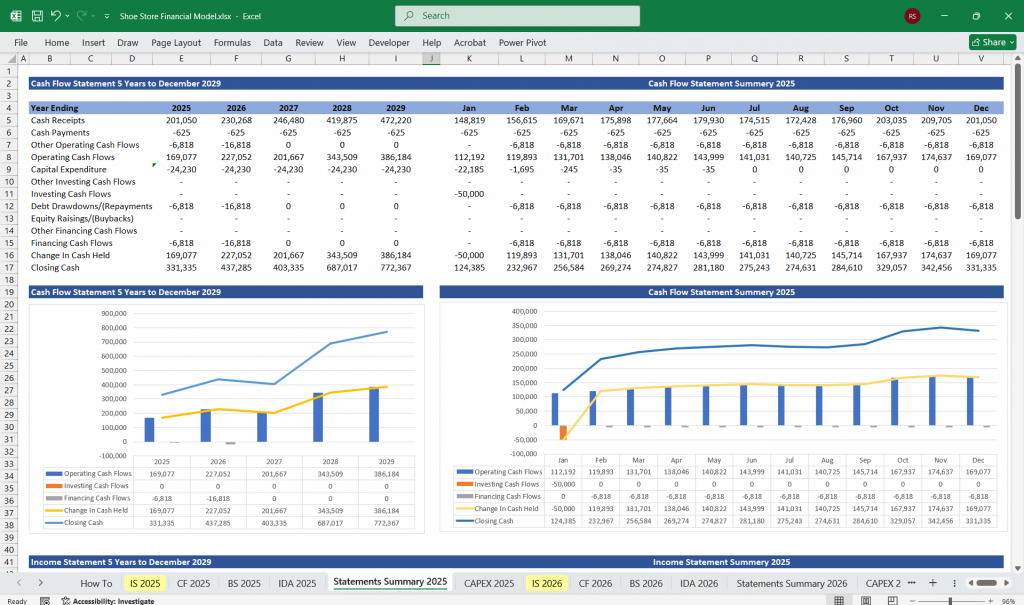
Shoe Store Cash Flow Statement
The Cash Flow Statement tracks the store’s cash inflows and outflows, divided into operating, investing, and financing activities.
Key Line Items:
Operating Activities:
Cash from sales (Revenue).
Cash paid for COGS, operating expenses, and taxes.
Net Cash from Operating Activities = Net Income + Depreciation – Changes in Working Capital.
Investing Activities:
Capital expenditures (e.g., store setup, equipment).
Assumptions: Initial setup cost = 50,000(40−productline),50,000(40−productline),80,000 (80-product line).
Financing Activities:
Cash from loans or equity investments.
Cash used to repay loans or distribute dividends.
Net Change in Cash:
Net Change in Cash = Cash from Operating Activities + Cash from Investing Activities + Cash from Financing Activities.
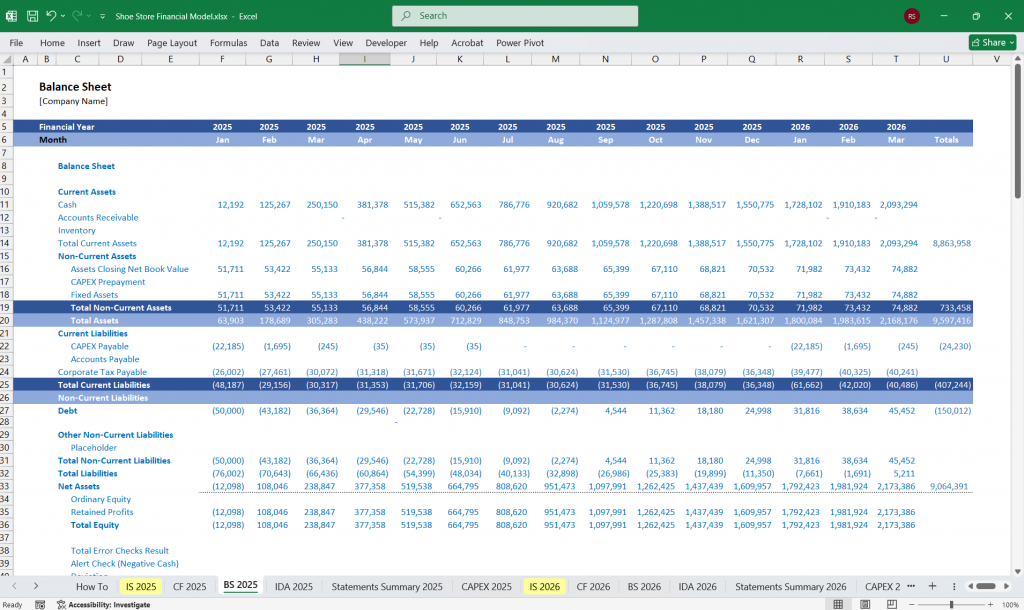
Shoe Store Balance Sheet
The Balance Sheet provides a snapshot of the store’s financial position at a specific point in time.
Key Line Items:
Assets:
Current Assets: Cash, accounts receivable, inventory.
Inventory = Number of units in stock × Cost per unit.
Fixed Assets: Store fixtures, equipment (net of depreciation).
Liabilities:
Current Liabilities: Accounts payable, short-term loans.
Long-Term Liabilities: Long-term loans.
Equity:
Owner’s equity + Retained Earnings.
Balance Sheet Equation:
Assets = Liabilities + Equity.
Shoe Store Business – Key Bullet Points
1. Product Categories & Inventory Management
Women’s Shoes (heels, flats, boots, sneakers, sandals)
Men’s Shoes (dress shoes, casual shoes, athletic sneakers, boots)
Children’s Shoes (school shoes, play shoes, baby shoes, seasonal styles)
Accessories (socks, shoe care kits, insoles, laces, bags)
Seasonal & Trend-Based Collections (holiday editions, summer/winter styles)
Discount/Outlet Section (clearance sales, last-season stock, BOGO deals)
2. Shoe Store Pricing & Promotions
Premium Pricing (for branded/luxury shoes)
Mid-Range Pricing (for everyday comfort & style)
Budget-Friendly Options (affordable brands, discount racks)
Sales Strategies:
Seasonal Sales (Black Friday, End-of-Season Clearance)
Membership Discounts (loyalty programs, VIP perks)
Bundle Deals (buy shoes + accessories at a discount)
3. Shoe Store Layout & Visual Merchandising
Gender & Age Sections (clearly labeled for easy navigation)
Trending & New Arrivals Display (front of store to attract attention)
Discount Rack Placement (near checkout to encourage impulse buys)
Interactive Displays (mirrors, seating for trying on shoes)
4. Shoe Store Customer Experience & Services
Professional Fitting Assistance (trained staff for sizing advice)
Comfort & Style Consultations (helping customers find the right pair)
Special Orders (for rare sizes or custom requests)
Online-Store Integration (click-and-collect, in-store returns for online purchases)
5. Shoe Store Marketing & Sales Channels
Social Media Campaigns (Instagram, TikTok for showcasing new styles)
Email Marketing (exclusive shoe store discounts for subscribers)
Local Advertising (flyers, partnerships with nearby businesses)
In-Store Events (fashion shows, seasonal promotions)
6. Shoe Store Supplier & Inventory Management
Diverse Suppliers (mix of high-end, mid-range, and budget brands)
Stock Rotation (keep fresh inventory, avoid overstocking)
Exclusive Deals with Brands (limited editions, early releases)
7. Shoe Store Discount & Clearance Strategy
Flash Sales (limited-time offers to move slow-selling stock)
Loyalty Member Exclusive Discounts (encourage repeat buyers)
Bulk Discounts (e.g., “Buy 2, Get 1 Free” on socks/accessories)
8. Shoe Store Technology & POS Systems
Digital Inventory Tracking (real-time shoe store stock updates)
Mobile Payment Options (Apple Pay, Google Pay)
CRM Software (track customer preferences & purchase history)
9. Shoe Store Competitor Analysis & Unique Selling Points (USPs)
Price Matching (against nearby shoe stores)
Niche Focus (e.g., specializing in vegan shoes, wide-fit options)
Exceptional Return Policy (easy exchanges, extended return windows)
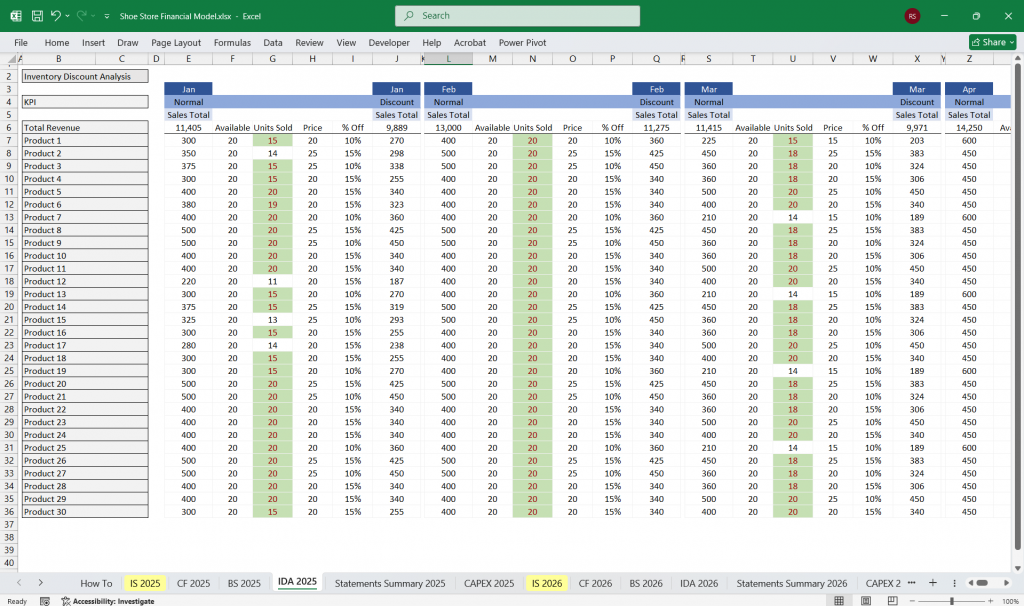
Inventory Discount Analysis for a Shoe Store
To optimize profitability, a shoe store should regularly analyze discounted inventory by tracking which products (e.g., slow-moving styles, seasonal overstock) are marked down, by how much, and how quickly they sell. Key metrics include discount depth (percentage off), sell-through rate, and profit margins post-markdown. Strategies like flash sales for stagnant stock, bundling accessories with discounted shoes, or targeted promotions for loyalty members can help clear inventory without excessive loss. By reviewing historical data, the store can adjust future purchasing, pricing, and discount timing to minimize losses while maintaining cash flow and customer interest.
Shoe Store Financial Projections:
Revenue: 80 × 50×100=50×100=400,000/month.
COGS: 80 × 100 × 25=25=200,000/month.
Gross Profit: 400,000−400,000−200,000 = $200,000/month.
Operating Expenses: $20,000/month (higher due to increased inventory management).
EBITDA: 200,000−200,000−20,000 = $180,000/month.
Net Income: 180,000−180,000−1,500 (Depreciation) – 1,000(Interest)−1,000(Interest)−44,375 (Taxes) = $133,125/month.
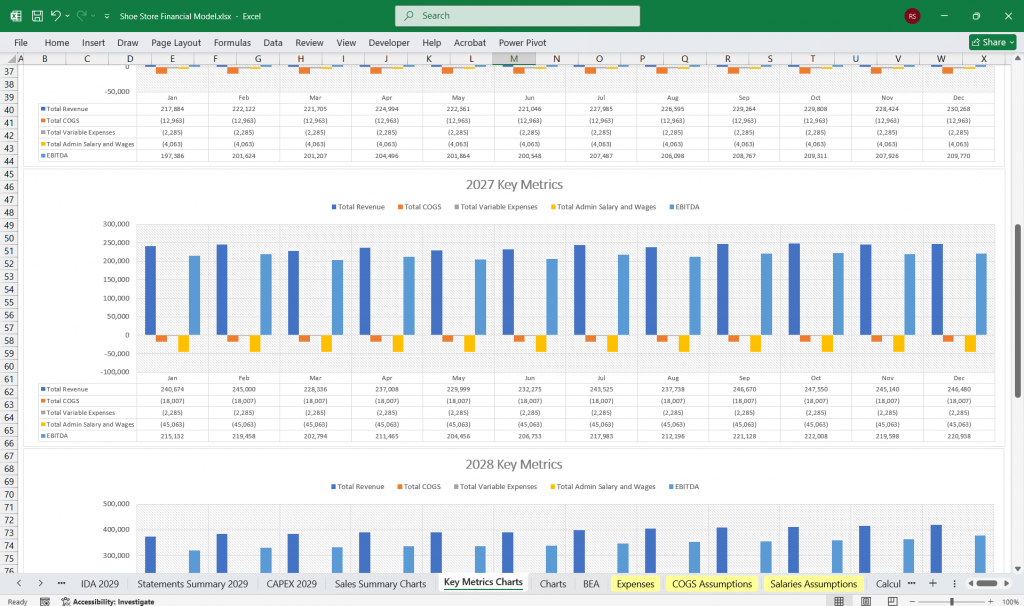
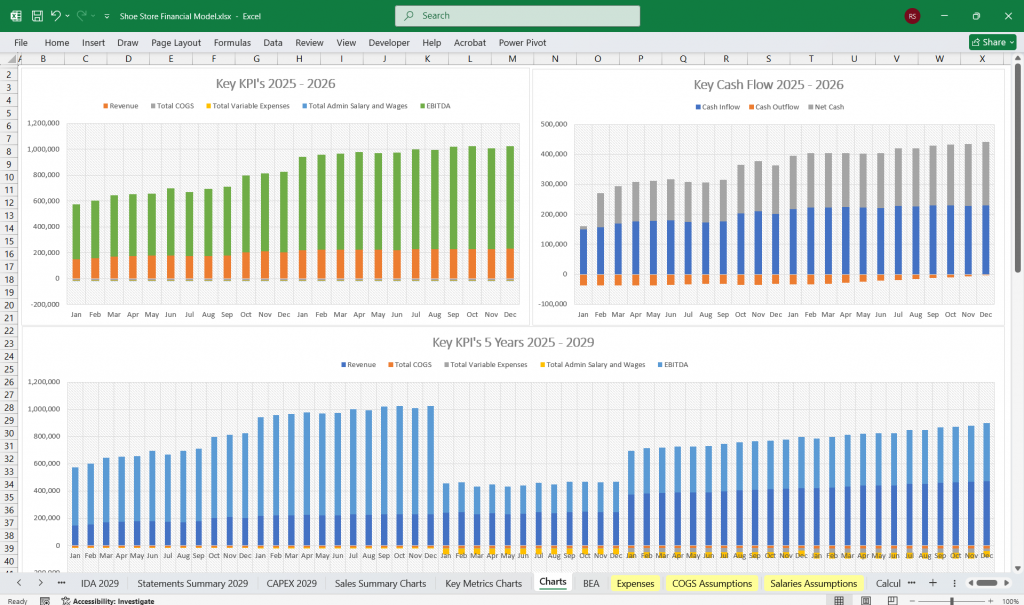
Key Metrics
Gross Margin: Gross Profit / Revenue.
Operating Margin: Operating Income / Revenue.
Net Profit Margin: Net Income / Revenue.
Inventory Turnover: COGS / Average Inventory.
Return on Equity (ROE): Net Income / Equity.
Sensitivity Analysis
Analyze how changes in key assumptions (e.g., ASP, Sales Volume, COGS) impact profitability.
Example: A 10% decrease in Sales Volume reduces Net Income by 15%.
Final Notes on the Financial Model
- Scenario Analysis: Create best-case, base-case, and worst-case projections.
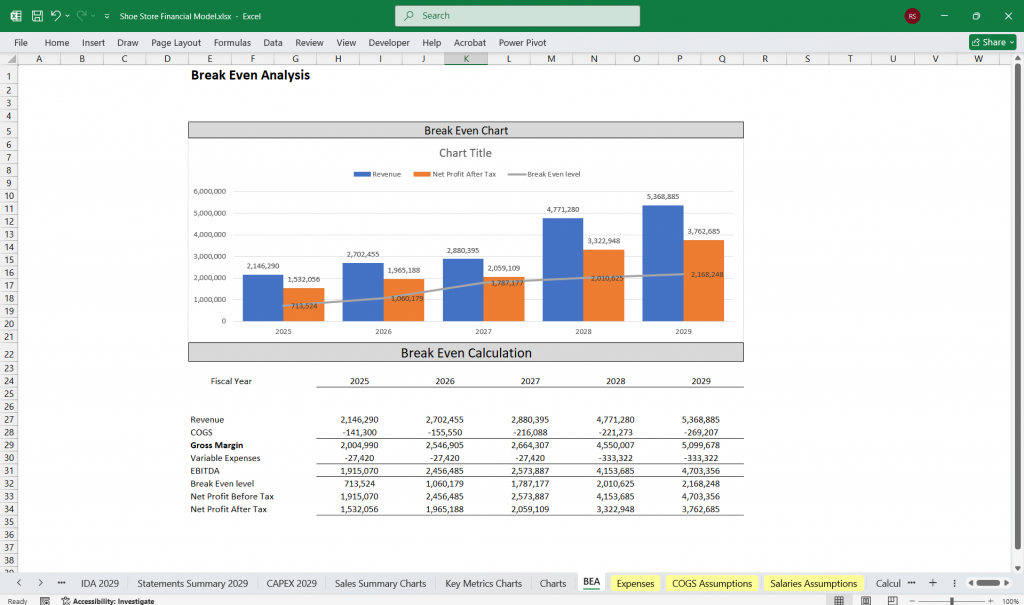
- Break-even Analysis: Determine sales volume required to cover fixed & variable costs
This financial model provides a comprehensive framework for evaluating the financial performance of a shoe store with 40 or 80 product lines. It can be customized further based on specific store details and market conditions.
Download Link On Next Page