Restaurant Finance Model

This Restaurant Finance Model in Excel provides a structured framework to analyze financial health and profitability. Revenues from Eat In, and Bar sales, through to App. 

Financial Model For A Restaurant 

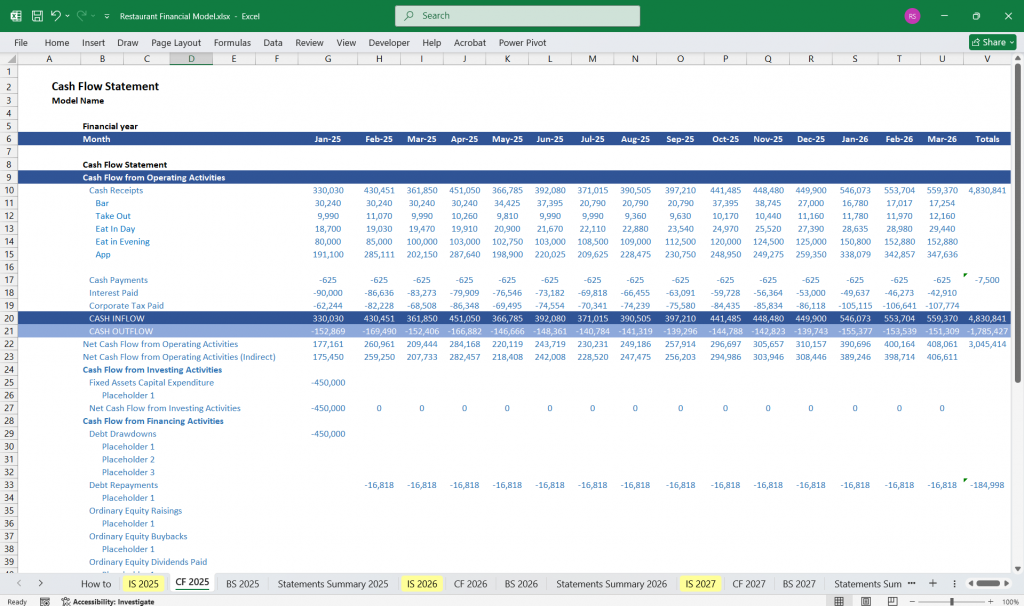
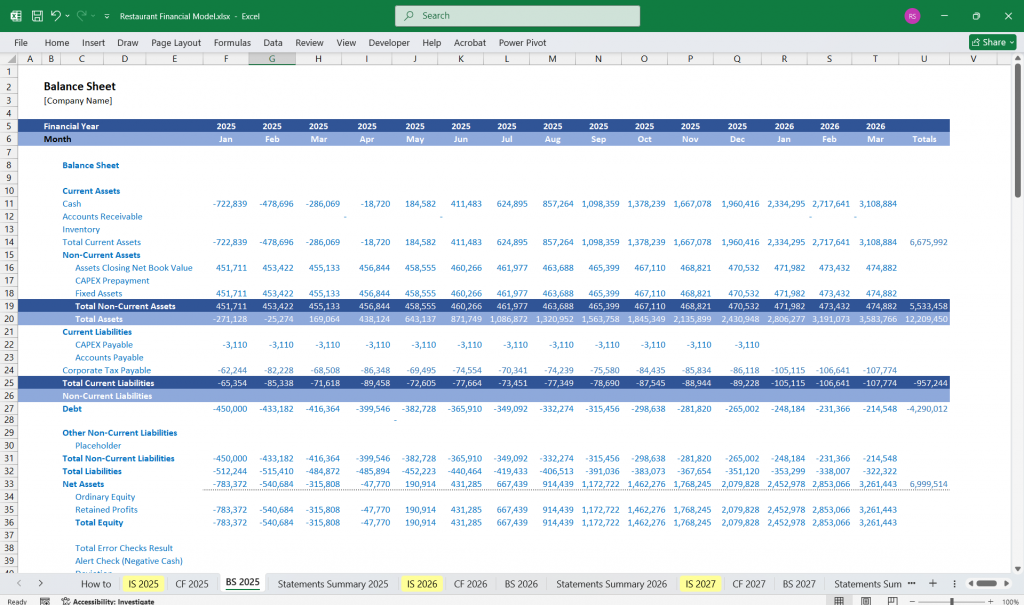
This financial model for a restaurant, bar, and cafe, involves projecting the financial performance of a restaurant over a period of 5 years. Below is a detailed description of the financial model, including the Income StatementCash Flow Statement, and Balance Sheet. This model assumes the business has both in-person and app-based sales, but is completely editable to your own spec.
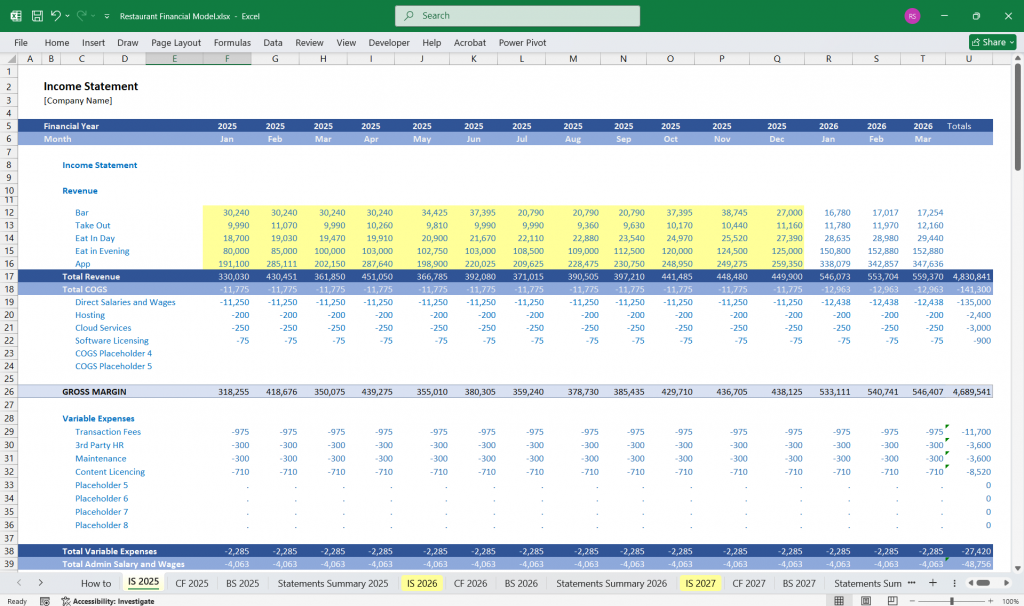
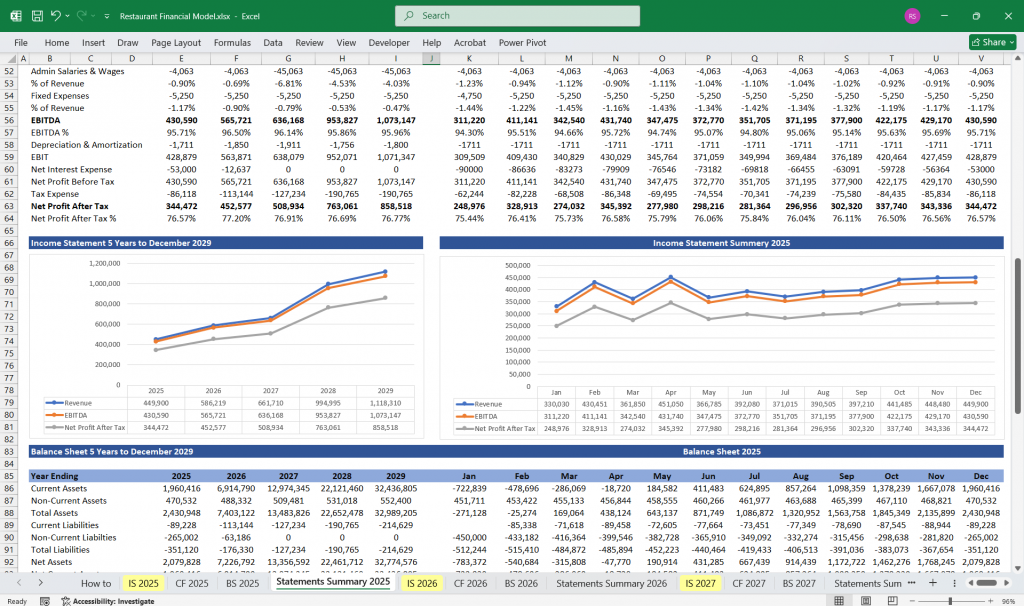
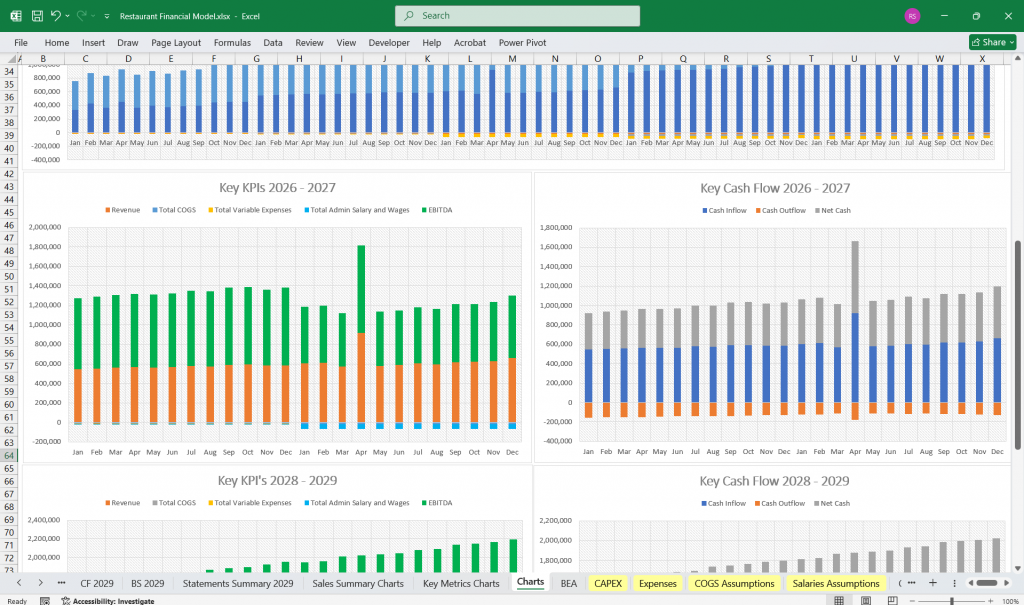
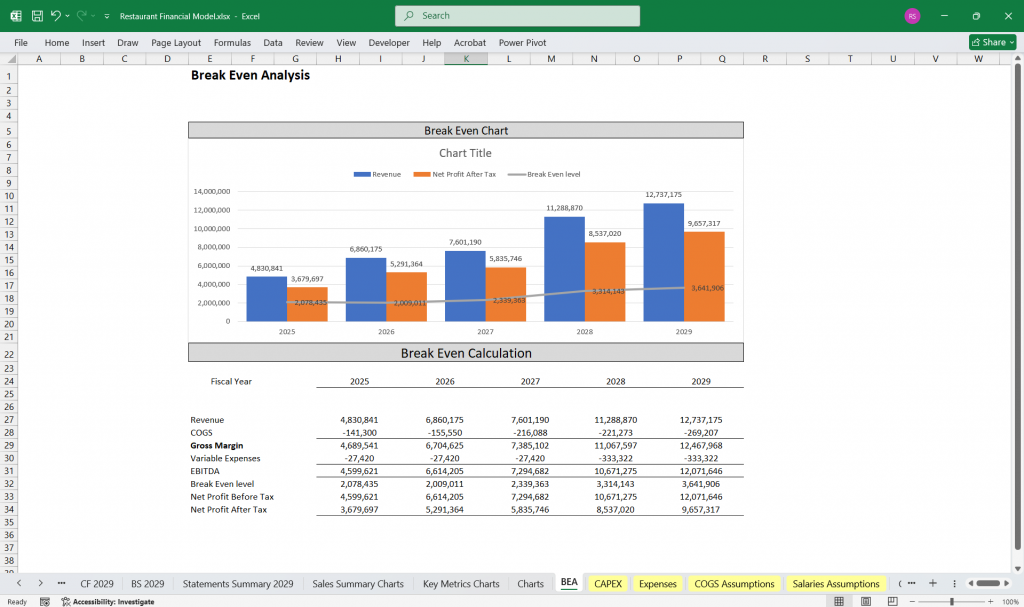
Income Statement

The Income Statement (Profit & Loss Statement) shows the revenue, costs, and profitability of the business over a specific period.
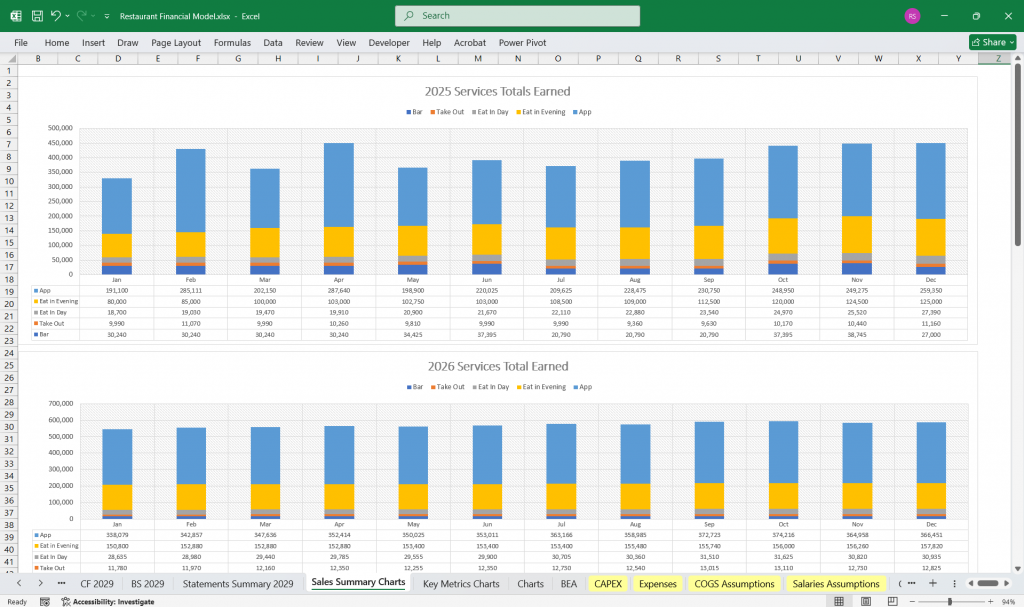
Revenue

  1. In-Person Sales:

    • Food and beverage sales from the physical location.

    • Breakdown by category (e.g., food, alcohol, coffee, desserts).

  2. App Sales:

    • Revenue from online orders via the app (delivery and pickup).

    • Subscription fees (if applicable, e.g., loyalty programs or premium features).

  3. Other Revenue:

    • Catering or event hosting.

    • Merchandise sales (e.g., branded mugs, T-shirts).

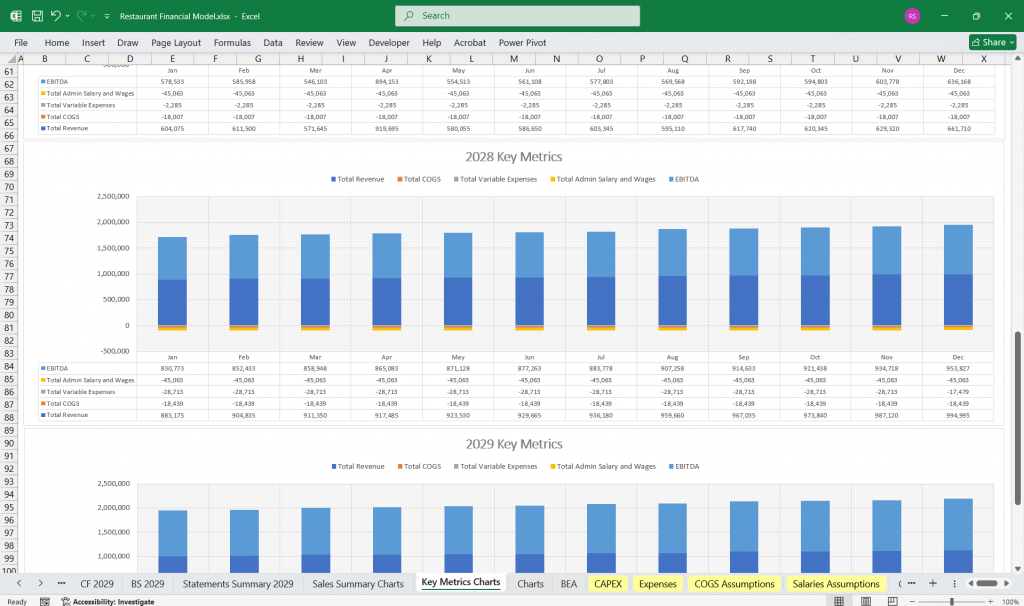
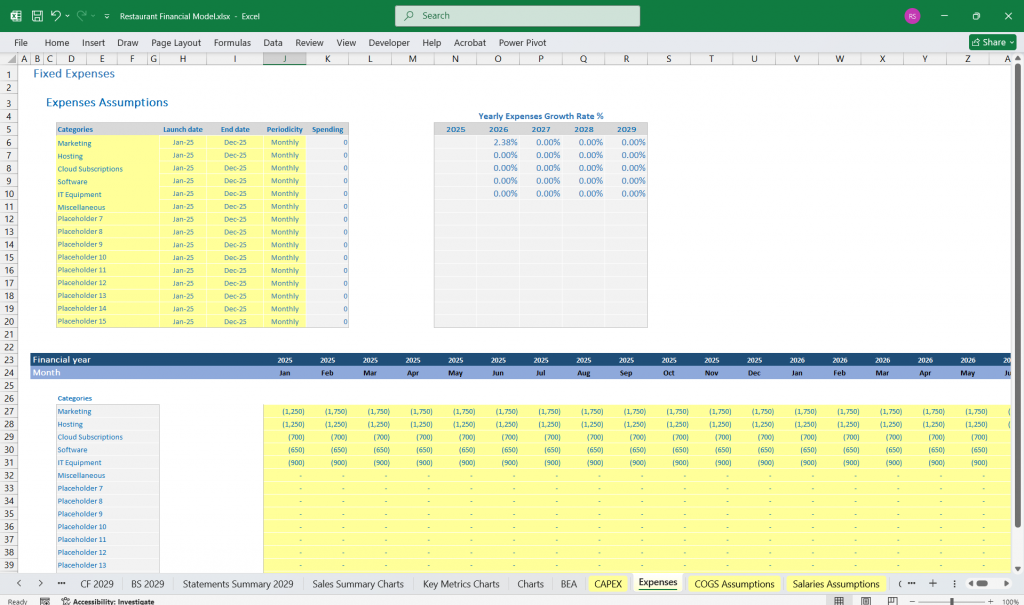
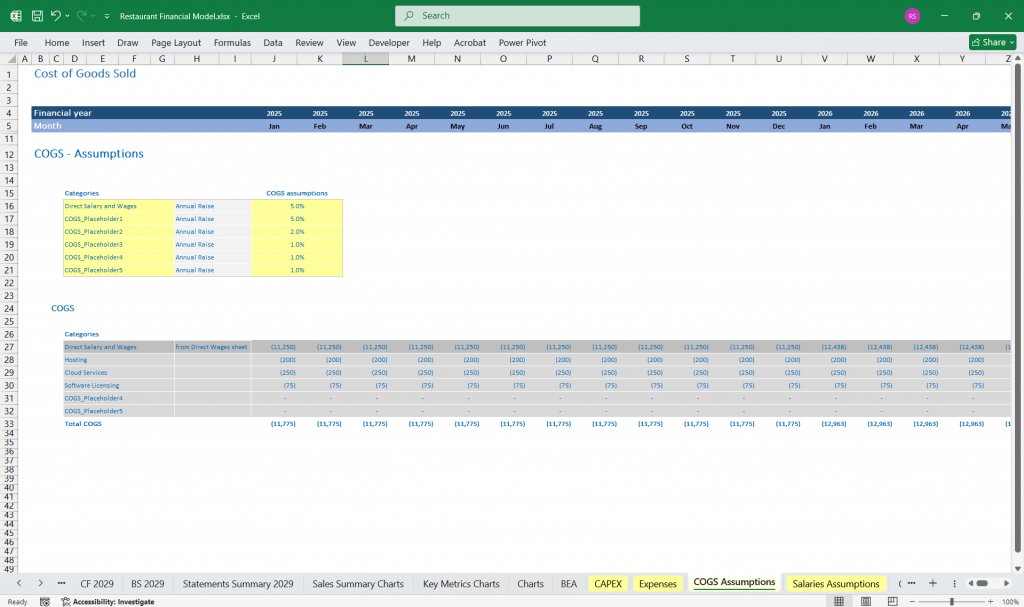
Cost of Goods Sold (COGS)

  1. Food and Beverage Costs:

    • Cost of ingredients, beverages, and packaging for both in-person and app sales.

  2. App-Related Costs:

    • Payment processing fees (e.g., credit card fees, app platform fees).

    • Delivery costs (if using third-party services or in-house delivery).

Operating Expenses

  1. Fixed Costs:

    • Rent, utilities, insurance, and licenses.

    • Salaries for permanent staff (e.g., chefs, managers, waitstaff).

    • App maintenance and development costs.

  2. Variable Costs:

    • Hourly wages for part-time staff.

    • Marketing and advertising (e.g., social media, app promotions).

    • Commissions to third-party delivery platforms (if applicable).

EBITDA (Earnings Before Interest, Taxes, Depreciation, and Amortization)

  • Revenue – COGS – Operating Expenses.

Depreciation and Amortization

  • Depreciation of kitchen equipment, furniture, and fixtures.

  • Amortization of software development costs (for the app).

Interest and Taxes

  • Interest on loans or credit lines.

  • Income taxes (based on taxable income).

Net Income

  • EBITDA – Depreciation – Interest – Taxes.

Restaurant Finance Model

Restaurant Finance Model Cash Flow Statement

The Cash Flow Statement tracks the inflows and outflows of cash, ensuring the business has enough liquidity to operate.

Operating Activities

  1. Cash Inflows:

    • Revenue from in-person and app sales.

    • Cash from catering or events.

  2. Cash Outflows:

    • Payments to suppliers (food, beverages, packaging).

    • Salaries and wages.

    • Rent, utilities, and other fixed costs.

    • Marketing and app-related expenses.

Investing Activities

  1. Cash Outflows:

    • Purchase of kitchen equipment, furniture, and fixtures.

    • Investment in app development or upgrades.

    • Renovations or expansions of the physical location.

Financing Activities

  1. Cash Inflows:

    • Loans or equity investments.

  2. Cash Outflows:

    • Loan repayments.

    • Dividends to investors (if applicable).

Net Cash Flow

  • Sum of cash flows from operating, investing, and financing activities.

Restaurant Finance Model

Restaurant Finance Model Balance Sheet

The Balance Sheet provides a snapshot of the business’s financial position at a specific point in time, showing assets, liabilities, and equity.

Assets

  1. Current Assets:

    • Cash and cash equivalents.

    • Inventory (food, beverages, packaging).

    • Accounts receivable (e.g., catering deposits, unpaid app sales).

  2. Non-Current Assets:

    • Kitchen equipment, furniture, and fixtures (net of depreciation).

    • App software (net of amortization).

    • Leasehold improvements (e.g., renovations).

Liabilities

  1. Current Liabilities:

    • Accounts payable (e.g., unpaid supplier invoices).

    • Accrued expenses (e.g., wages, utilities).

    • Short-term loans or credit lines.

  2. Non-Current Liabilities:

    • Long-term loans (e.g., equipment financing, expansion loans).

Equity

  1. Owner’s Equity:

    • Initial investment.

    • Retained earnings (cumulative net income minus dividends).

Balance Sheet Equation

  • Assets = Liabilities + Equity.

Restaurant Finance Model

Restaurant Finance Model Key Assumptions and Drivers

  1. Restaurant Revenue Drivers:

    • Average spend per customer (in-person and app).

    • Number of customers (foot traffic and app users).

    • Growth rate of app sales.

  2. Restaurant Cost Drivers:

    • Food and beverage cost percentages.

    • Labor costs as a percentage of revenue.

    • App-related costs (e.g., platform fees, restaurant app delivery costs).

  3. Restaurant Capital Expenditures:

    • Initial setup costs (e.g., kitchen equipment, app development).

    • Ongoing maintenance and kitchen upgrades.


Restaurant Finance Summary Spreadsheet
Restaurant Finance Spreadsheet
Restaurant Income Revenue Template
Restaurant Key KPI Chart
Restaurant Financial Model
Restaurant Financial Template
Restaurant Financial BEA Chart
Restaurant Expenses Template
Restaurant Finance Model

Senario For The Financial Model

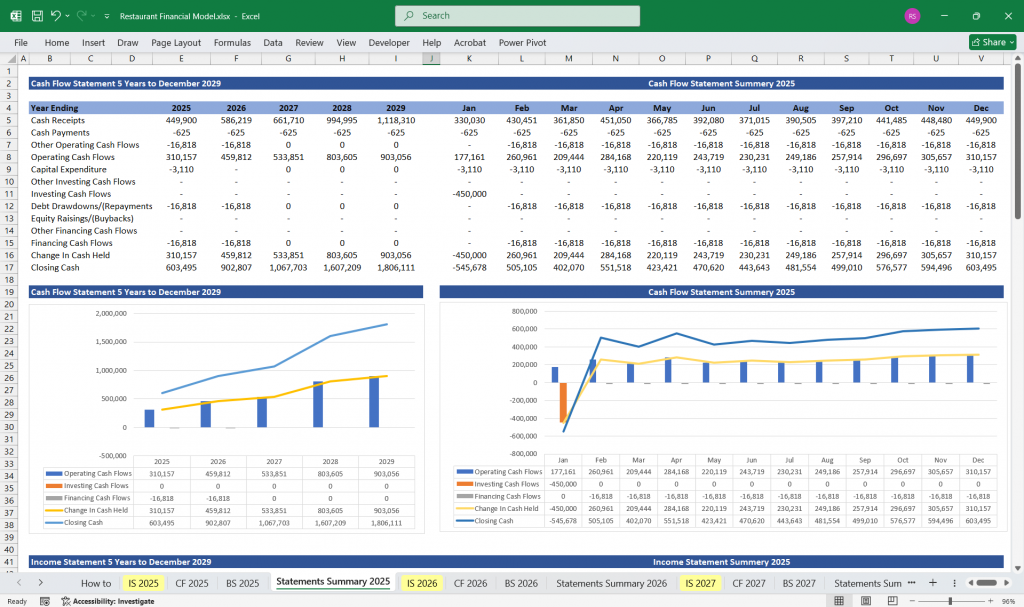
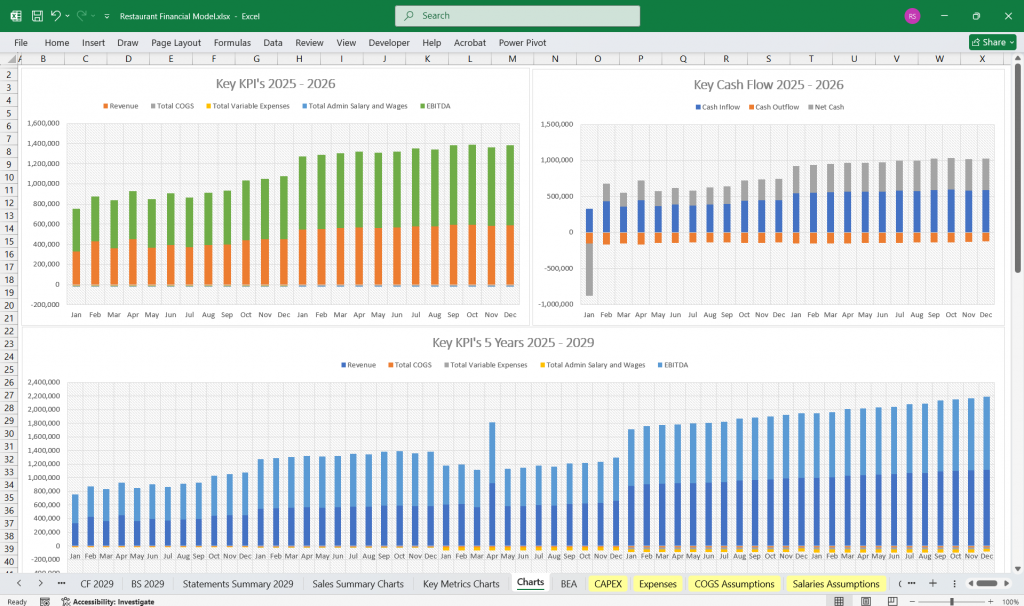
  • Test scenarios for changes in key drivers (e.g., 10% decrease in app sales, 5% increase in food costs).

  • Assess the impact on profitability, cash flow, and liquidity.

This Restaurant financial model in Excel provides a comprehensive framework for analyzing the financial performance of a restaurant, bar, cafe, or similar business with app sales. It can be customized further based on specific business needs and market conditions.

Restaurant Finance Model

Download Link On Next Page

$80.00