
Real Estate Broker DCF Financial Model Excel Template
This 20-Year, 3-Statement Real Estate Broker DCF Financial Model Excel Template. A comprehensive Discounted Cash Flow (DCF) Financial Model with Terminal Value, Sensitivity Analysis, and WACC for real estate professionals. Includes dynamic inputs for rental income, expenses, and terminal value. Fully editable Excel file—no hidden formulas or locked cells.
DCF Financial Model for a Real Estate Broker
20 Year Private Real Estate Broker Model involves detailed revenue projections, cost structures, WACC, MOIC, capital expenditures, and financing needs. This model provides a comprehensive assessment of your company’s financial viability, including Discounted Cash Flow (DCF) with Terminal Value, Sensitivity Analysis, WACC profitability, and cash flow position. Includes: 20x Income Statements, Cash Flow Statements, Balance Sheets, General Expenses, Working Capital, and CAPEX sheets, Statement Summary Sheets, and Revenue Forecasting Charts with the revenue streams, BEA charts, sales summary charts, employee salary tabs and expenses sheets.
Overview of the Real Estate Financial Model
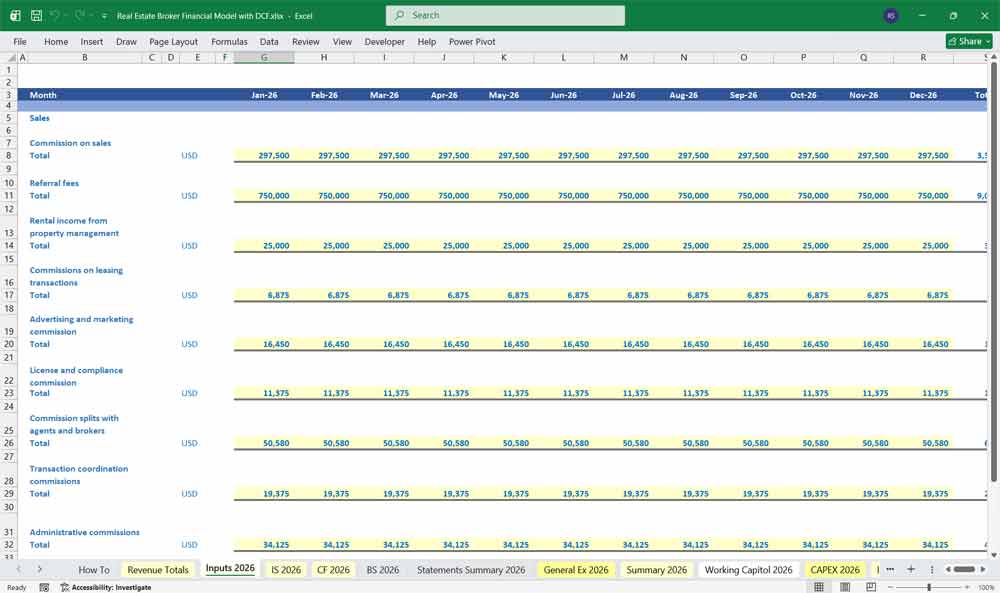
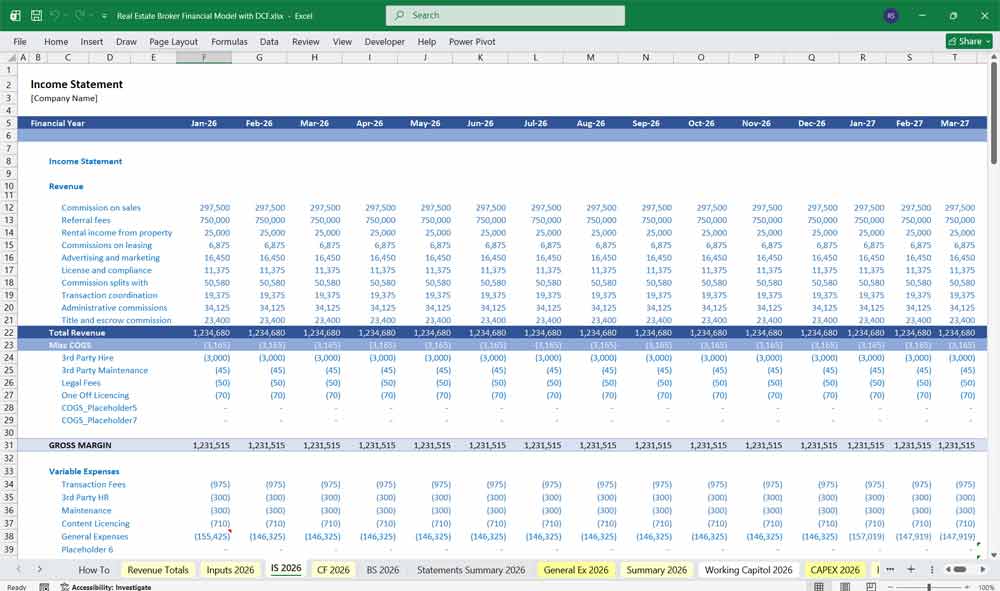
Income Statement
The Income Statement for a brokerage is all about the “Spread”—the difference between the gross commission earned and what is paid out to the agents.
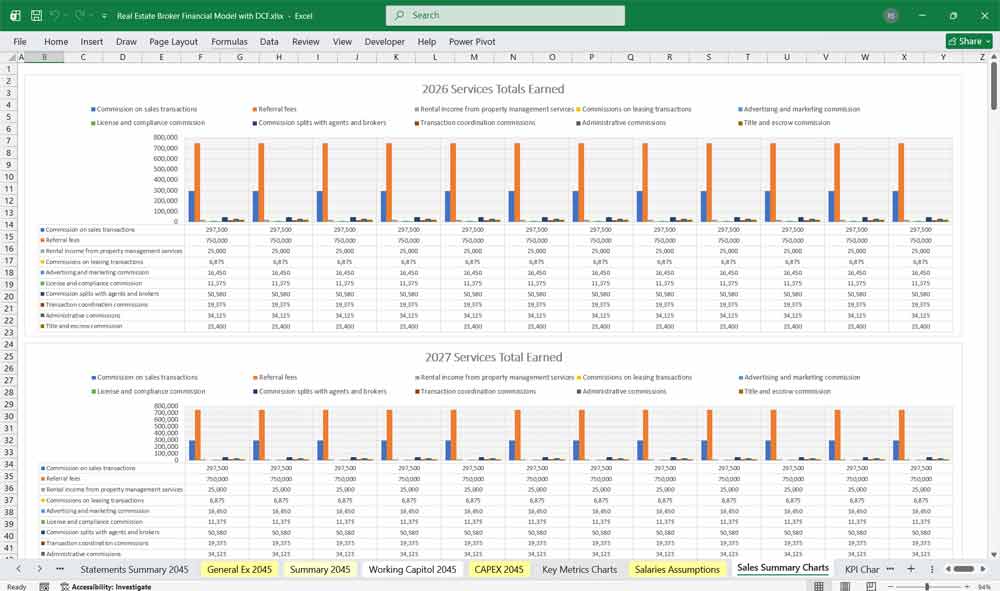
Revenue (Top Line)
Gross Commission Income (GCI): Total commission collected from all closed transactions (Buyer-side and Seller-side).
Referral Fees: Income from referring clients to other brokerages or states.
Brokerage Fees: Admin fees or “desk fees” charged directly to agents.
Cost of Goods Sold (COGS)
Agent Commission Splits: The portion of GCI paid to the agents (e.g., a 70/30 split).
Franchise Fees: If applicable, the percentage of GCI paid to a national brand (e.g., RE/MAX or Keller Williams).
Transaction Coordinator Fees: Costs directly tied to closing a specific deal.
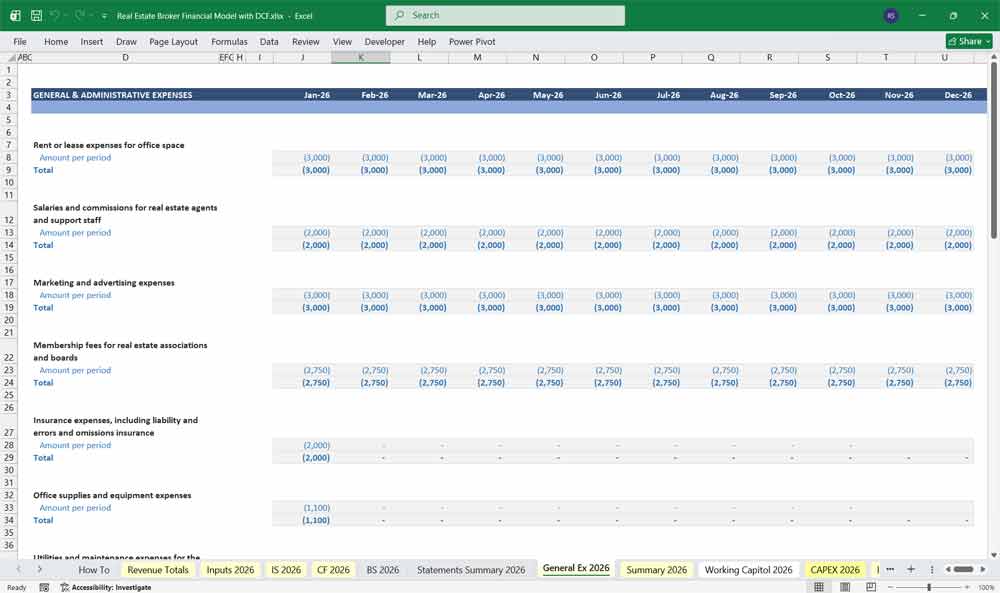
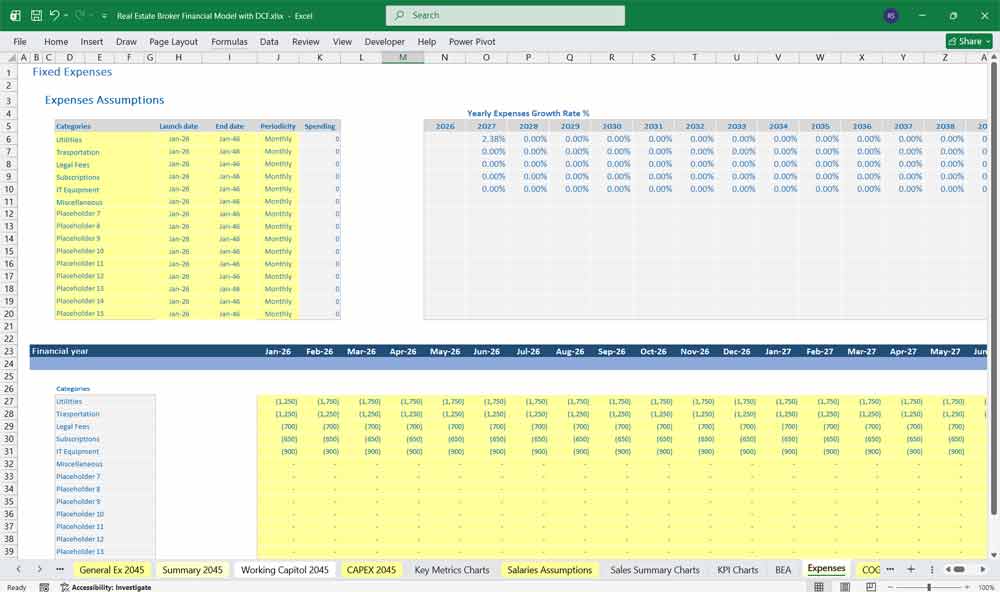
Operating Expenses (OpEx)
Marketing & Lead Gen: Zillow leads, Google Ads, and local branding.
Payroll: Salaries for non-agent staff (Admins, Receptionists, Marketing Managers).
Rent & Utilities: Office space overhead.
Software/SaaS: CRM (like Salesforce or Lofty), DocuSign, and MLS dues
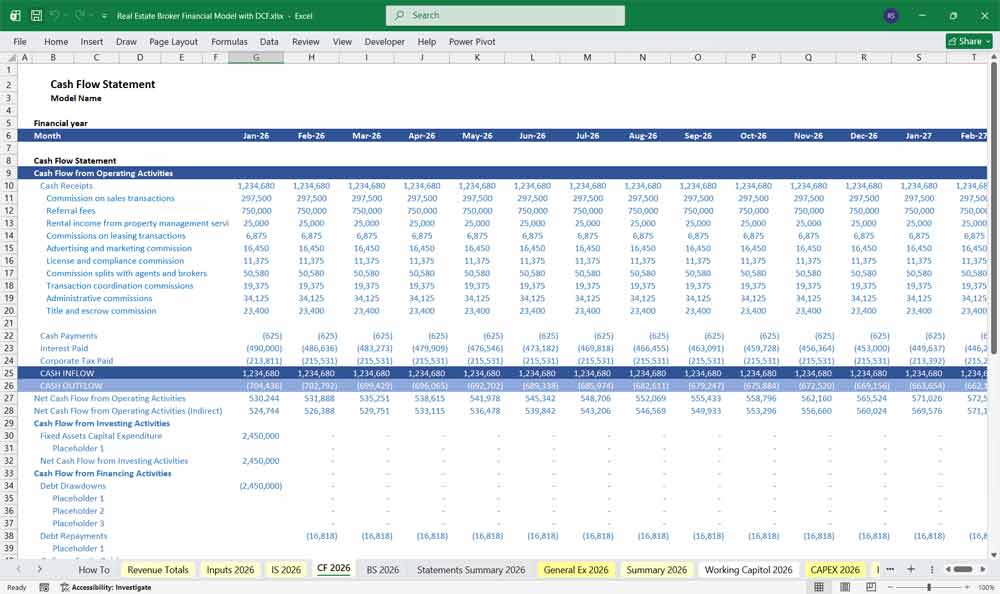
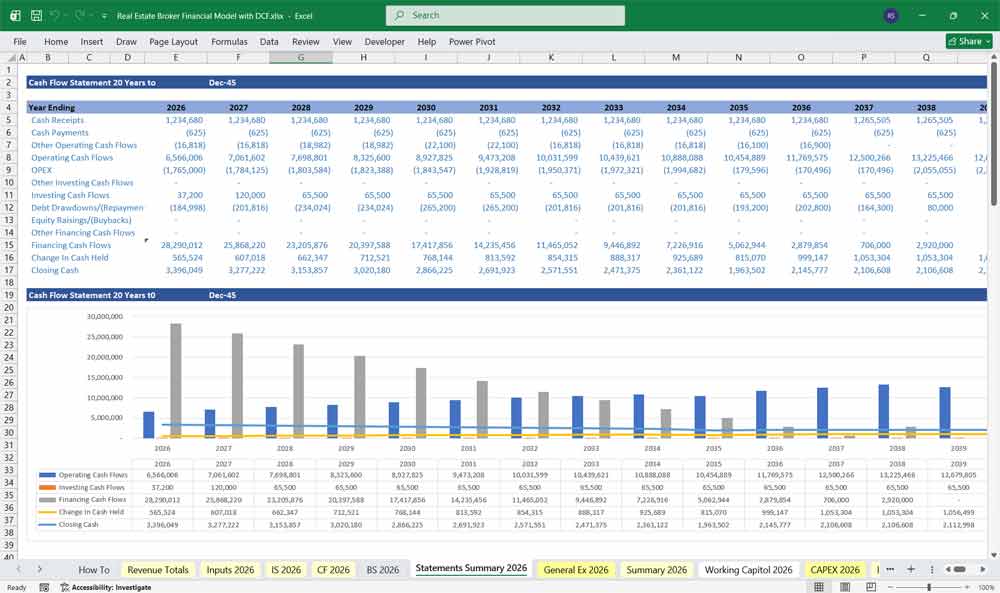
Real Estate Broker Cash Flow Statement
In real estate, timing is everything. A brokerage can be “profitable” on paper but out of cash if closings are delayed.
Operating Activities
Net Income Adjustment: Start with Net Income and add back non-cash items like Depreciation.
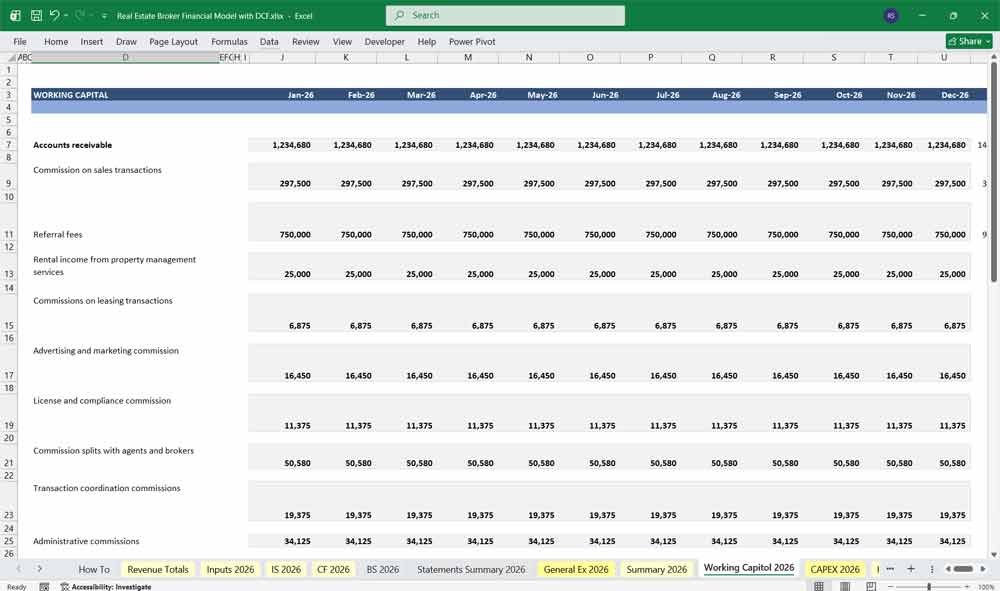
Working Capital Changes: * Accounts Receivable: Tracking commissions earned but not yet deposited.
Accounts Payable: Unpaid bills to vendors or marketing agencies.
Investing Activities
CapEx (Capital Expenditures): Purchase of office furniture, signage, or computer hardware.
Leasehold Improvements: Costs to renovate a new office storefront.
Financing Activities
Debt Service: Interest and principal payments on business loans.
Distributions: Dividends paid out to the Broker-Owner or partners.
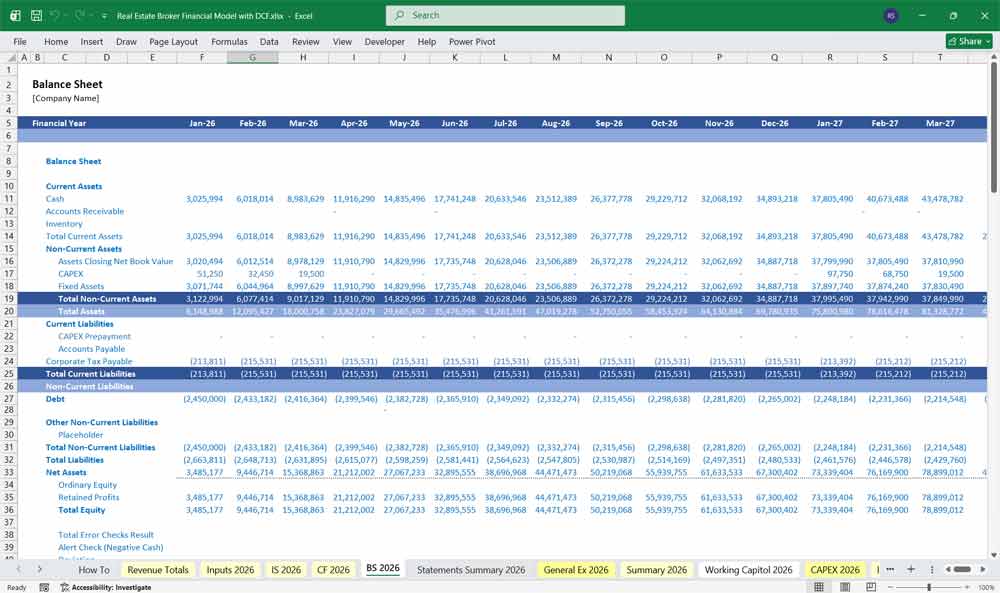
Real Estate Broker Balance Sheet
This provides a snapshot of the brokerage’s health at a specific moment in time.
Assets
Current Assets: * Cash: The most vital metric for a brokerage.
Commissions Receivable: Money owed from escrow/title companies for closed deals.
Fixed Assets: Office equipment, signage, and owned real estate (if the brokerage owns its building).
Liabilities
Current Liabilities: * Agent Commissions Payable: Money sitting in the bank that must be paid out to agents.
Accrued Expenses: Unpaid taxes or licensing fees.
Long-Term Liabilities: Business lines of credit or SBA loans.
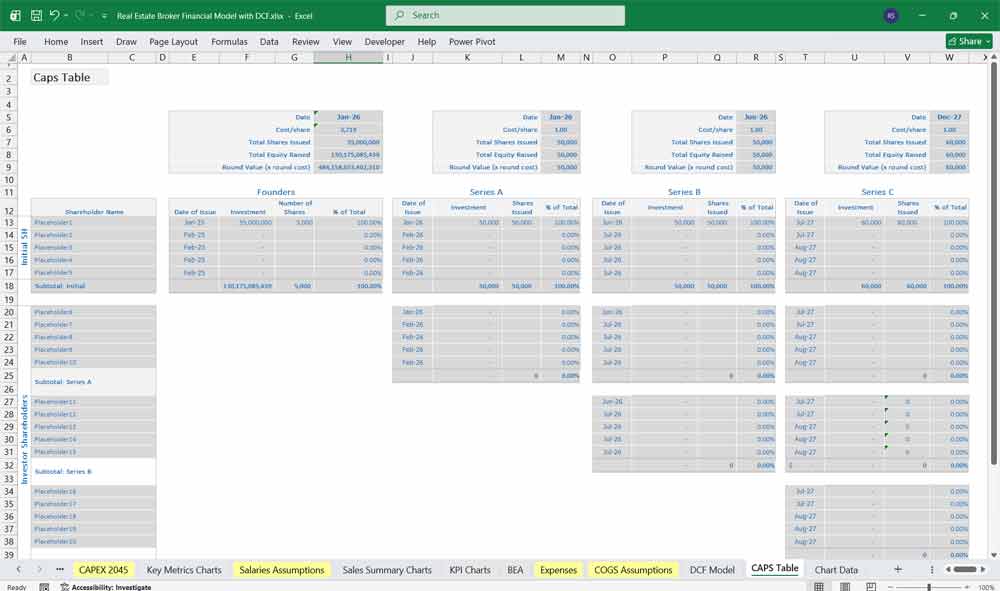
Equity
Retained Earnings: Cumulative profits kept in the business for future growth.
Owner’s Capital: The initial investment made to start the firm.
Real Estate Model Key Metrics & KPIs
This brokerage financial model calculates operational metrics.
Sales Performance
Transactions per Agent
Sales Volume per Agent
Average Commission per Deal
Profitability Metrics
Gross Margin
EBITDA Margin
Net Margin
Efficiency Metrics
Revenue per Agent
Cost per Transaction
Lead Conversion Rate
Liquidity
Current Ratio
Cash Runway
Working Capital
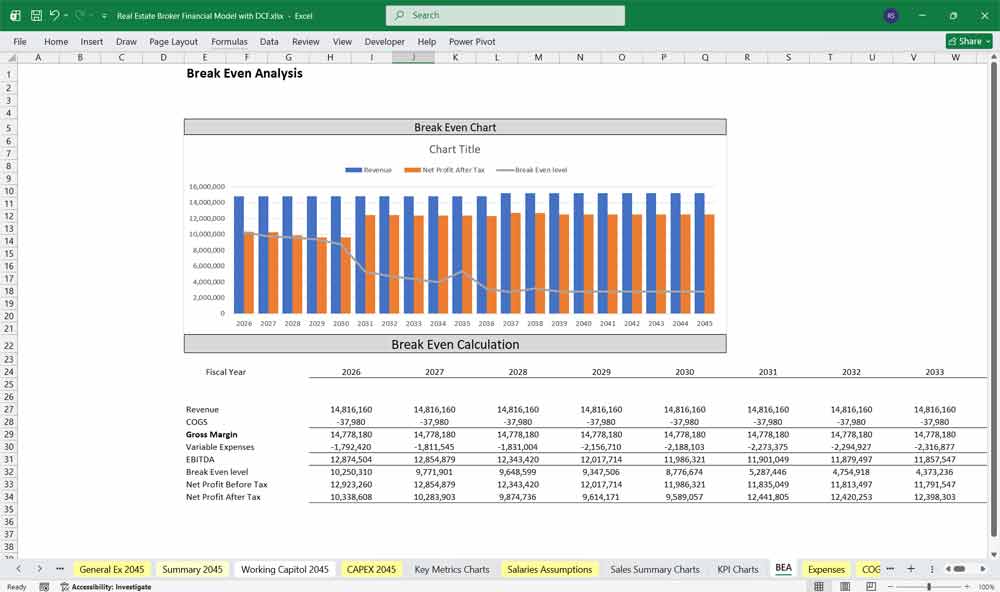
Scenario & Sensitivity Analysis
Real estate markets fluctuate, so models should test:
Market Downturn
Transaction volume decline
Lower average prices
Agent Growth
Hiring new agents
Productivity ramp
Commission Compression
Lower commission rates
Marketing Investment
Increased lead generation
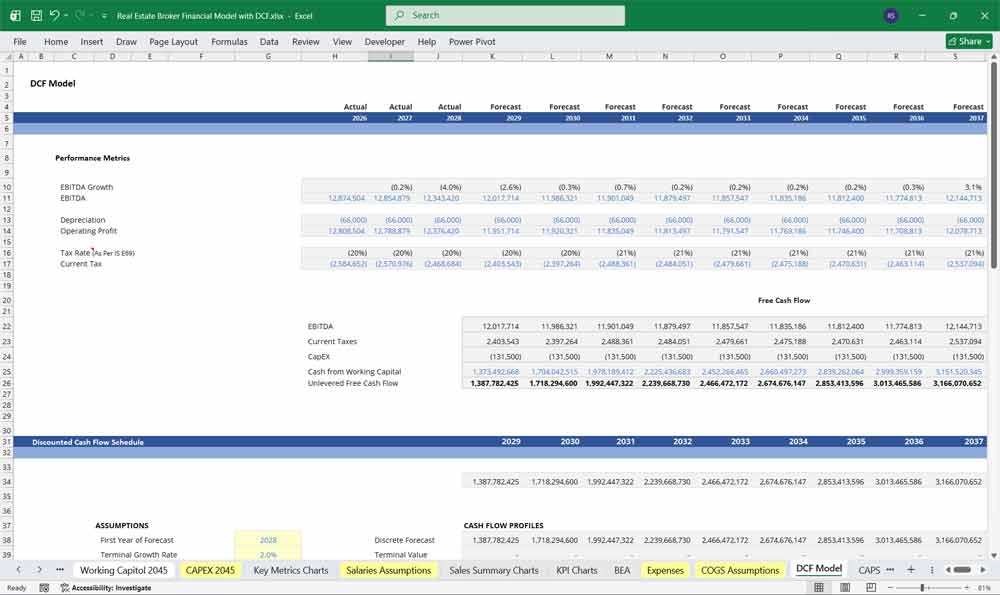
Valuing Your Real Estate Brokerage With A DCF
Discounted Cash Flow (DCF)
A Discounted Cash Flow (DCF) analysis for a real estate brokerage estimates the firm’s value based on projected future cash flows generated from commissions on property transactions, leasing services, and advisory activities. Revenue forecasts are driven by property transaction volumes, commission rates, market conditions in residential or commercial real estate, and the brokerage’s agent network and market share. Costs typically include agent commissions, marketing, administrative expenses, and technology platforms. The projected free cash flows over a defined forecast period, along with a terminal value reflecting the brokerage’s long-term earning potential, are discounted to present value to determine the company’s intrinsic value.
Weighted Average Cost of Capital (WACC)
Weighted Average Cost of Capital (WACC) is used as the discount rate in valuing a real estate brokerage and reflects the blended cost of equity and debt financing. The company’s risk profile is influenced by real estate market cycles, interest rate movements, transaction volumes, and competitive dynamics within the brokerage industry. The WACC incorporates investors’ required returns, the company’s capital structure, and any tax benefits of debt, representing the minimum return necessary to justify investment in the business.
Sensitivity Analysis
Sensitivity analysis is important in valuing a real estate brokerage due to uncertainties in property transaction activity, commission structures, operating margins, and broader economic conditions affecting the real estate market. Analysts typically test changes in key assumptions such as revenue growth, commission rates, agent productivity, operating costs, and WACC. By evaluating how variations in these inputs affect the DCF valuation, sensitivity analysis highlights the most influential value drivers and provides a range of potential outcomes to support strategic and investment decisions.
Final Notes on the Financial Model
This 20 Year Real Estate DCF Financial Model focuses on balancing capital expenditures with steady returns. By optimizing expenditure costs, and efficiency, and maximizing high-margin services, the models ensure sustainable profitability and cash flow stability.